

Guidance on dermal absorption
- PMID: 32625532
- PMCID: PMC7010093
- DOI: 10.2903/j.efsa.2017.4873
Guidance on dermal absorption
Abstract
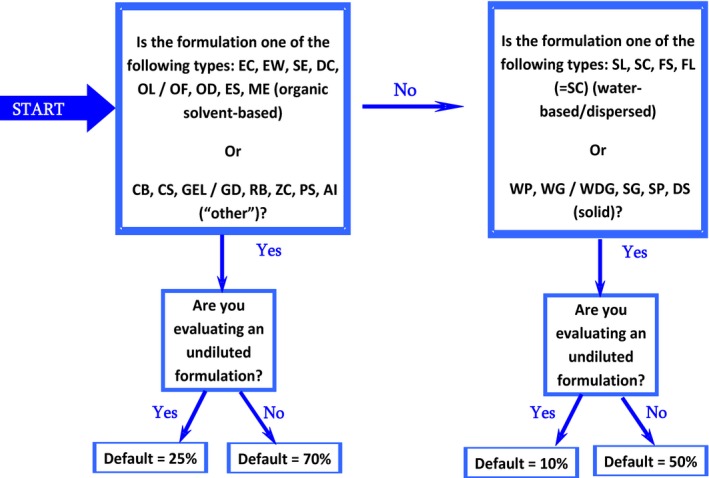
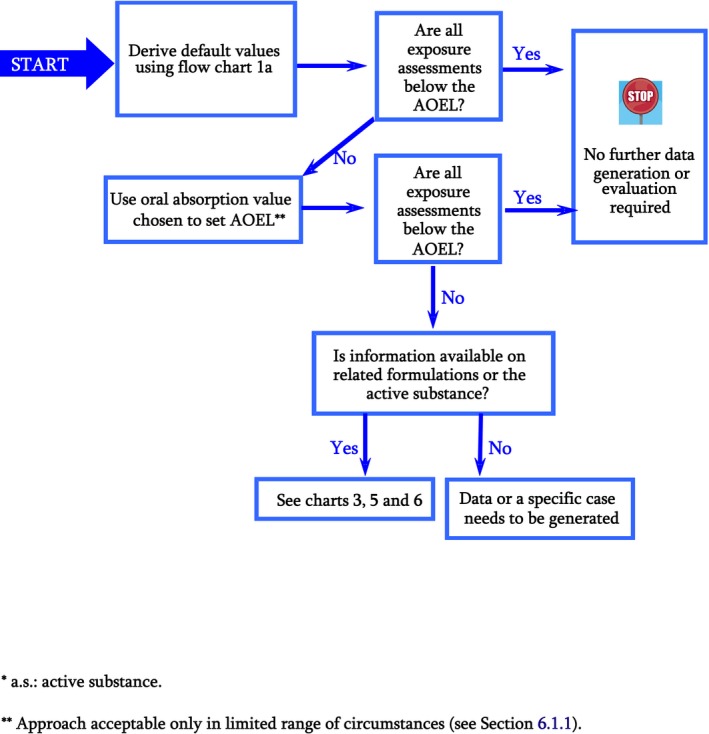
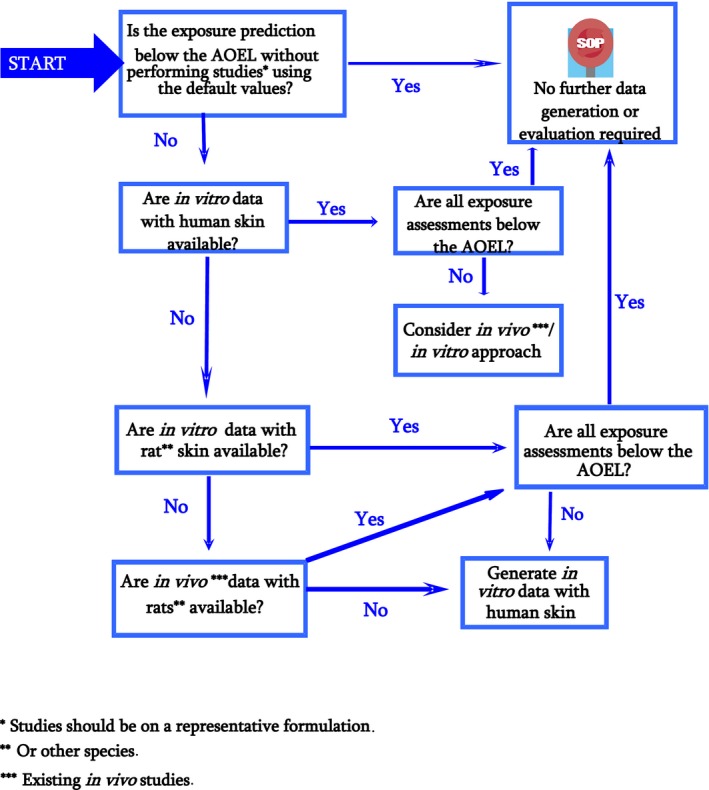
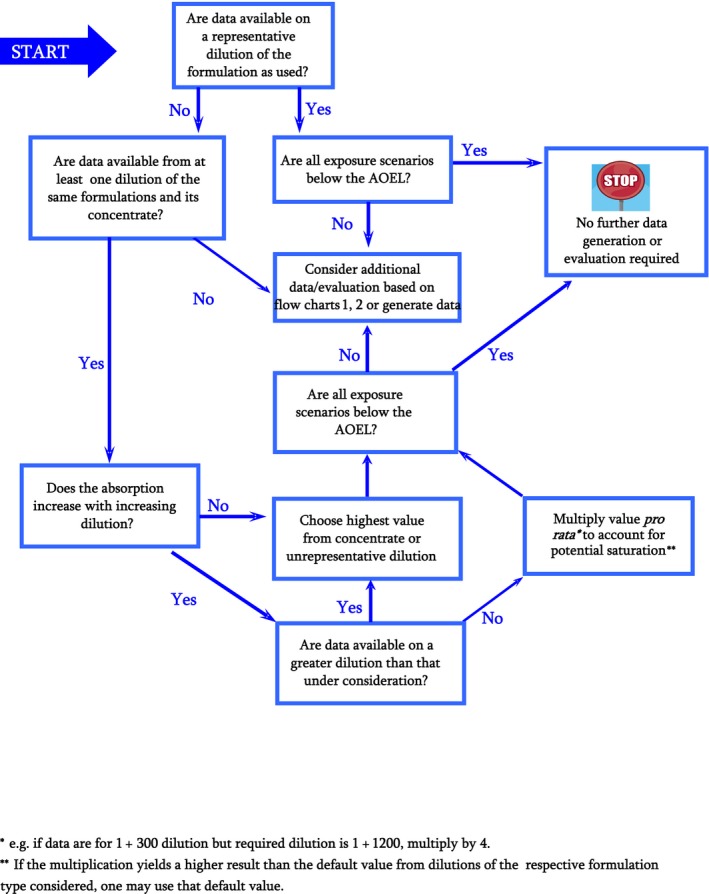
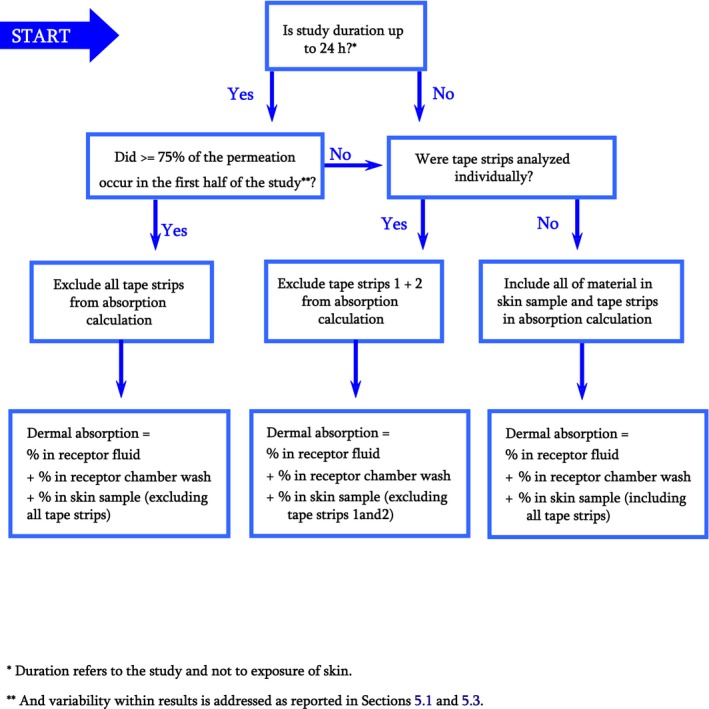
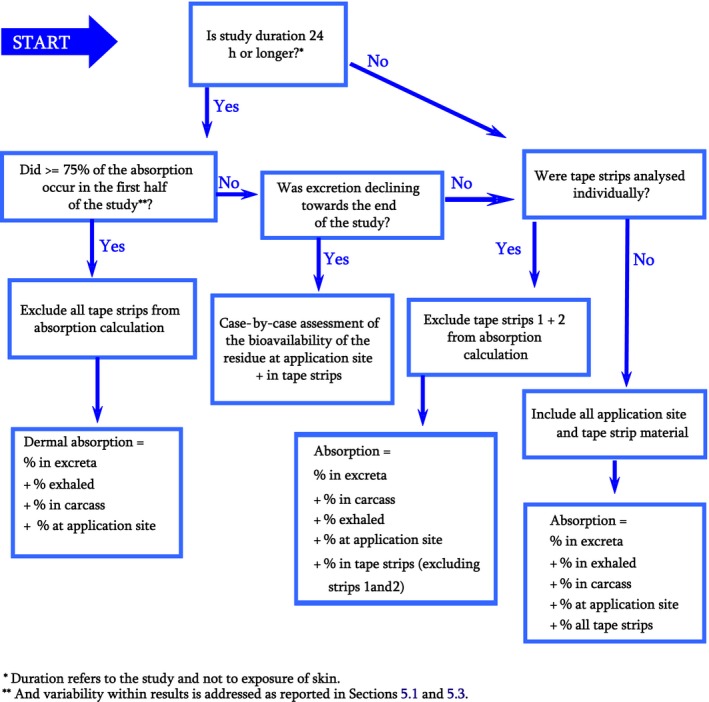
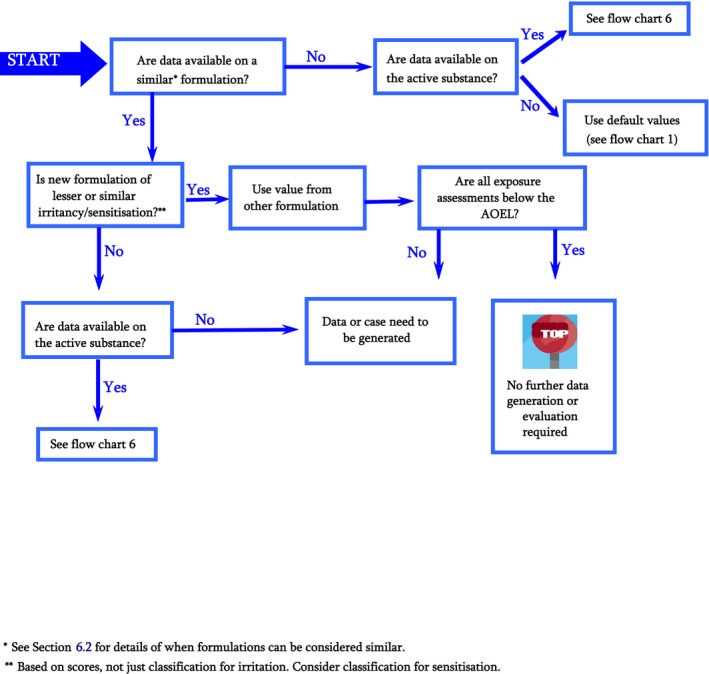
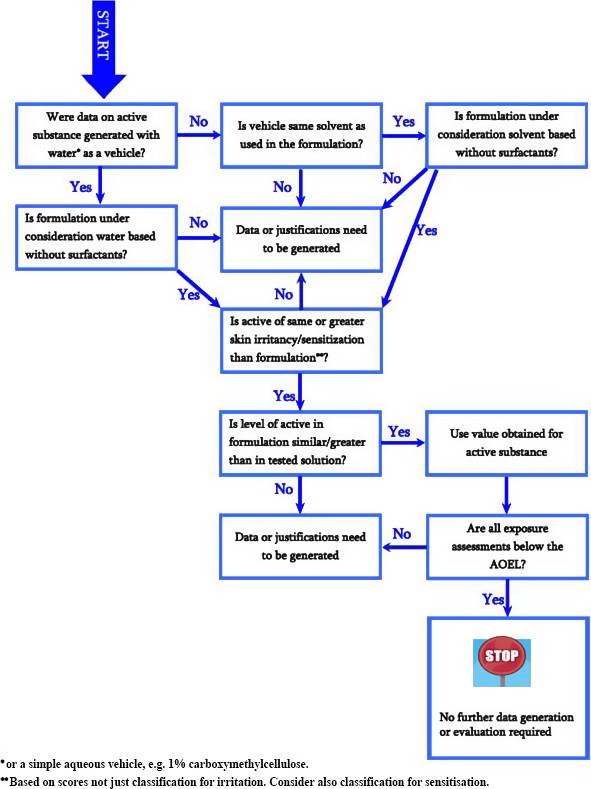
This guidance on the assessment of dermal absorption has been developed to assist notifiers, users of test facilities and Member State authorities on critical aspects related to the setting of dermal absorption values to be used in risk assessments of active substances in Plant Protection Products (PPPs). It is based on the 'scientific opinion on the science behind the revision of the guidance document on dermal absorption' issued in 2011 by the EFSA Panel on Plant Protection Products and their Residues (PPR). The guidance refers to the EFSA PPR opinion in many instances. In addition, the first version of this guidance, issued in 2012 by the EFSA PPR Panel, has been revised in 2017 on the basis of new available data on human in vitro dermal absorption for PPPs and wherever clarifications were needed. Basic details of experimental design, available in the respective test guidelines and accompanying guidance for the conduct of studies, have not been addressed but recommendations specific to performing and interpreting dermal absorption studies with PPPs are given. Issues discussed include a brief description of the skin and its properties affecting dermal absorption. To facilitate use of the guidance, flow charts are included. Guidance is also provided, for example, when there are no data on dermal absorption for the product under evaluation. Elements for a tiered approach are presented including use of default values, data on closely related products, in vitro studies with human skin (regarded to provide the best estimate), data from experimental animals (rats) in vitro and in vivo, and the so called 'triple pack' approach. Various elements of study design and reporting that reduce experimental variation and aid consistent interpretation are presented. A proposal for reporting data for assessment reports is also provided. The issue of nanoparticles in PPPs is not addressed. Data from volunteer studies have not been discussed since their use is not allowed in EU for risk assessment of PPPs.
Keywords: default values; dermal absorption; in vitro; in vivo; plant protection products; triple pack.
© 2017 European Food Safety Authority. EFSA Journal published by John Wiley and Sons Ltd on behalf of European Food Safety Authority.
Figures
References
-
- Aggarwal M, Battalora M, Fisher P, Hüser A, Parr‐Dobrzanski R, Soufi M, Mostert V, Strupp C, Whalley P, Wiemann C and Billington R, 2014. Assessment of in vitro human dermal absorption studies on pesticides to determine default values, opportunities for read‐across and influence of dilution on absorption. Regulatory Toxicology and Pharmacology, 68, 412–423. Available online: http://ac.els-cdn.com/ - PubMed
-
- Aggarwal M, Fisher P, Hüser A, Kluxen FM, Parr‐Dobrzanski R, Soufi M, Strupp C, Wiemann C and Billington R, 2015. Assessment of an extended dataset of in vitro human dermal absorption studies on pesticides to determine default values, opportunities for read‐across and influence of dilution on absorption. Regulatory Toxicology and Pharmacology, 72, 58–70. Available online: http://ac.els-cdn.com - PubMed
-
- Anissimov YG, Jepps OG, Dancik Y and Roberts MS, 2013. Mathematical and pharmacokinetic modelling of epidermal and dermal transport processes. Advanced Drug Delivery Reviews, 65, 169–190. - PubMed
-
- Bates D, Maechler M, Bolker B and Walker S, 2015. Fitting linear mixed‐effects models using lme4. Journal of Statistical Software, 67, 1–48.
-
- Buist HE, 2016. Dermal absorption and toxicological risk assessment: pitfalls and promises. PhD Thesis, Wageningen University. Wageningen University, Wageningen, The Netherlands.
LinkOut - more resources
Full Text Sources