

ECDC/EFSA/EMA second joint report on the integrated analysis of the consumption of antimicrobial agents and occurrence of antimicrobial resistance in bacteria from humans and food-producing animals: Joint Interagency Antimicrobial Consumption and Resistance Analysis (JIACRA) Report
- PMID: 32625542
- PMCID: PMC7009874
- DOI: 10.2903/j.efsa.2017.4872
ECDC/EFSA/EMA second joint report on the integrated analysis of the consumption of antimicrobial agents and occurrence of antimicrobial resistance in bacteria from humans and food-producing animals: Joint Interagency Antimicrobial Consumption and Resistance Analysis (JIACRA) Report
Abstract
The second ECDC/EFSA/EMA joint report on the integrated analysis of antimicrobial consumption (AMC) and antimicrobial resistance (AMR) in bacteria from humans and food-producing animals addressed data obtained by the Agencies' EU-wide surveillance networks for 2013-2015. AMC in both sectors, expressed in mg/kg of estimated biomass, were compared at country and European level. Substantial variations between countries were observed in both sectors. Estimated data on AMC for pigs and poultry were used for the first time. Univariate and multivariate analyses were applied to study associations between AMC and AMR. In 2014, the average AMC was higher in animals (152 mg/kg) than in humans (124 mg/kg), but the opposite applied to the median AMC (67 and 118 mg/kg, respectively). In 18 of 28 countries, AMC was lower in animals than in humans. Univariate analysis showed statistically-significant (p < 0.05) associations between AMC and AMR for fluoroquinolones and Escherichia coli in both sectors, for 3rd- and 4th-generation cephalosporins and E. coli in humans, and tetracyclines and polymyxins and E. coli in animals. In humans, there was a statistically-significant association between AMC and AMR for carbapenems and polymyxins in Klebsiella pneumoniae. Consumption of macrolides in animals was significantly associated with macrolide resistance in Campylobacter coli in animals and humans. Multivariate analyses provided a unique approach to assess the contributions of AMC in humans and animals and AMR in bacteria from animals to AMR in bacteria from humans. Multivariate analyses demonstrated that 3rd- and 4th-generation cephalosporin and fluoroquinolone resistance in E. coli from humans was associated with corresponding AMC in humans, whereas resistance to fluoroquinolones in Salmonella spp. and Campylobacter spp. from humans was related to consumption of fluoroquinolones in animals. These results suggest that from a 'One-health' perspective, there is potential in both sectors to further develop prudent use of antimicrobials and thereby reduce AMR.
Keywords: antimicrobial consumption; antimicrobial resistance; ecological analysis; food‐producing animals; logistic regression; partial least square path modeling; public health.
© 2017 European Centre for Disease Prevention and Control, © European Food Safety Authority and © European Medicines Agency. EFSA Journal published by John Wiley and Sons Ltd on behalf of European Food Safety Authority.
Figures
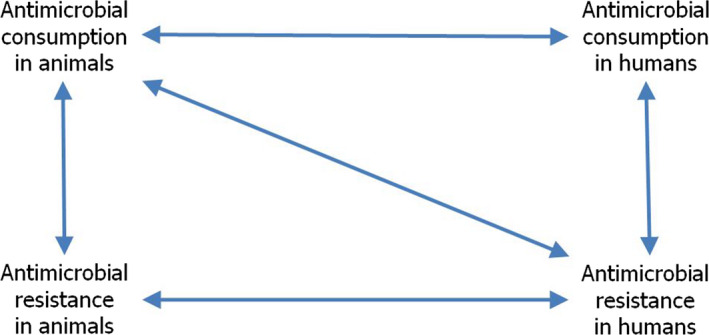
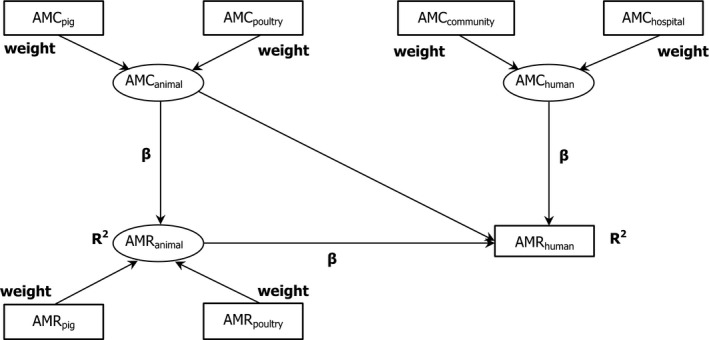
Note: The relationship between AMC in humans and AMR in food‐producing animals was not addressed in this report.
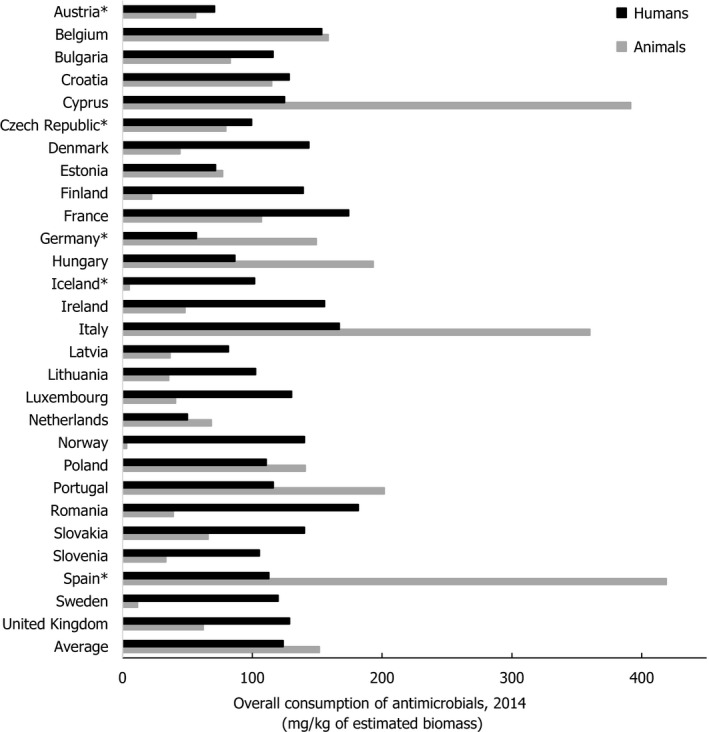
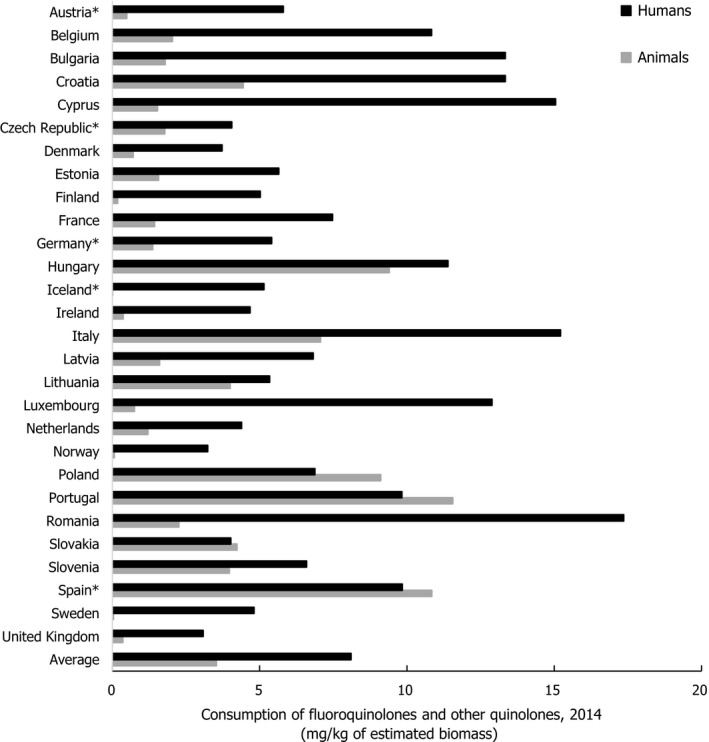
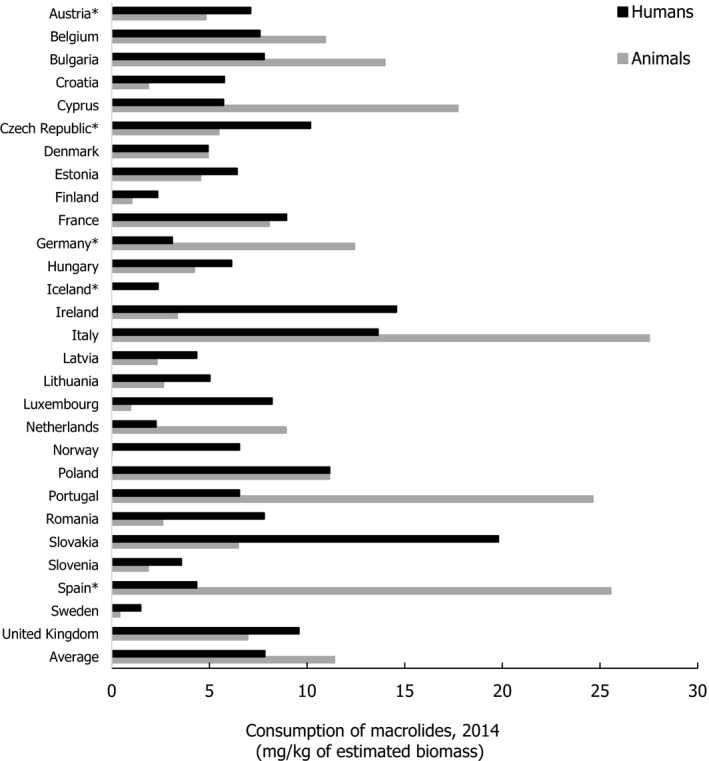
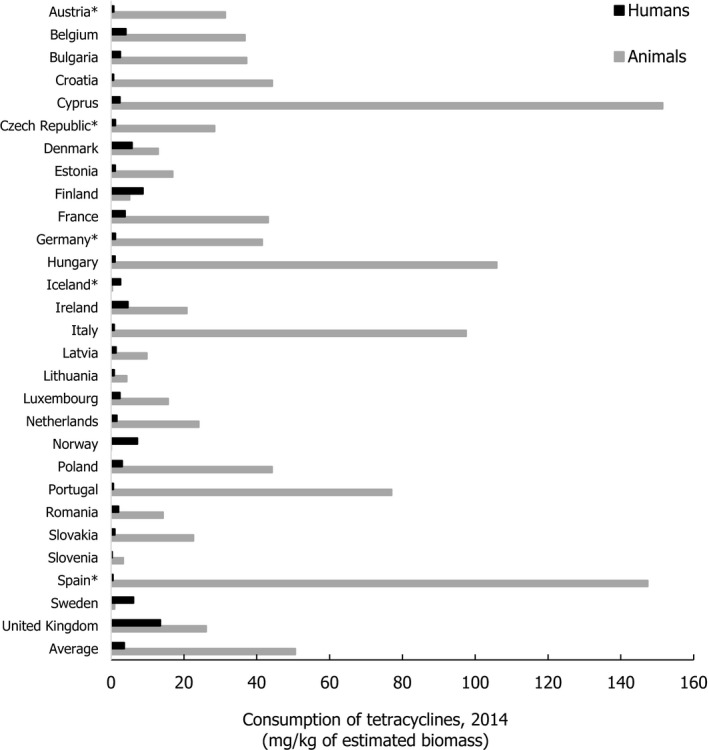
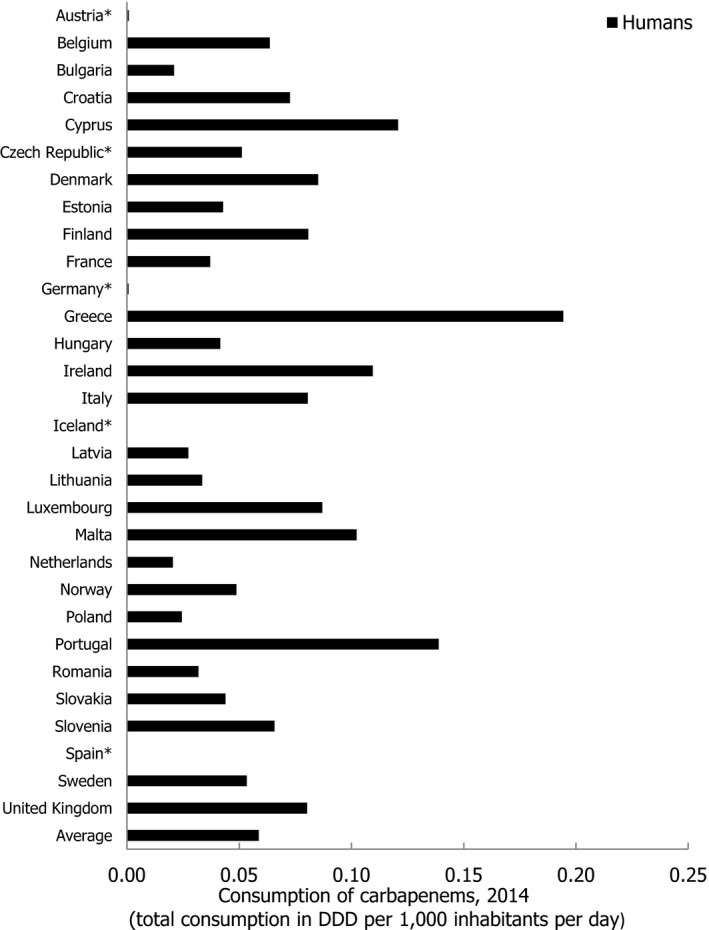
Asterisk (*) denotes that only community consumption was provided for human medicine. The population‐weighted mean proportion (%) of the hospital sector AMC of the 2014 total national AMC for
EU /EEA MS s that provided data for both sectors is 10%.Note: 1) The estimates presented are crude and must be interpreted with caution. For limitations that hamper the comparison of consumption of antimicrobials in humans and animals, please see Section 14.
2) The average figure represents the population‐weighted mean of data from included countries.
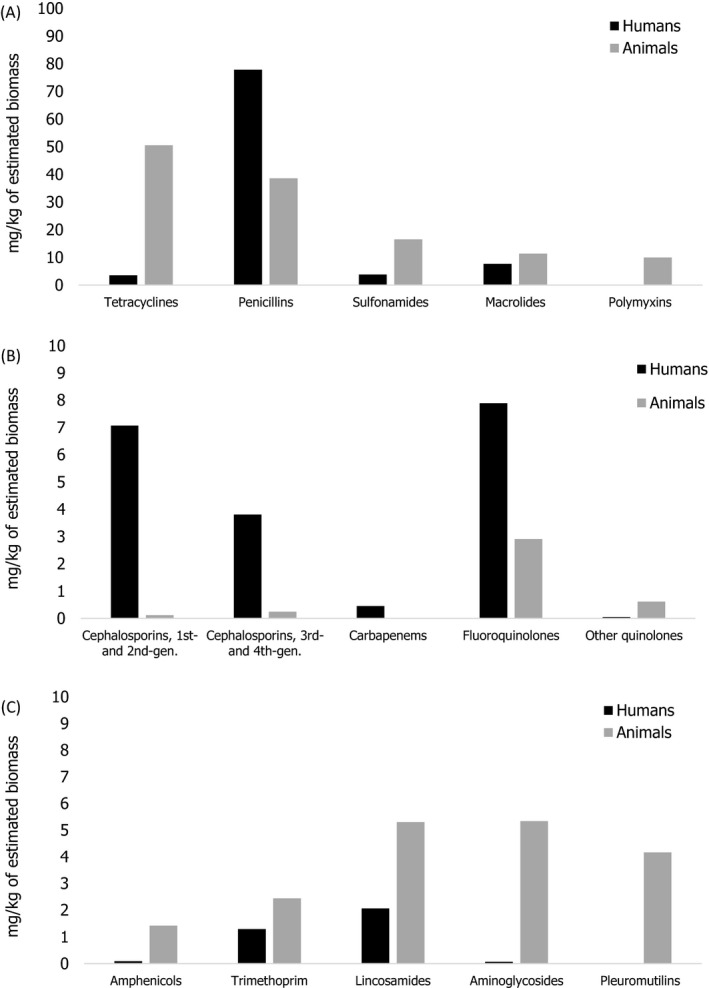
Notes: 1) The y‐axis scale differs between the graphs A, B and C.
2) The estimates presented are crude and must be interpreted with caution. For limitations that hamper the comparison of consumption of antimicrobials in humans and animals, please see Section 14.
3) Classes not included for human medicine were monobactams (
ATC group J01DF ), other cephalosporins and penems (J01DI ), streptogramins (J01FG ), glycopeptides, imidiazoles, nitrofurans, steroid antimicrobials and other antimicrobials (J01XX ). Substances not included for food‐producing animals were bacitracin (ATC vet group QA07AA93 and QJ01XX10), paromomycin (QJ01GB92) and spectinomycin (QJ01XX04).
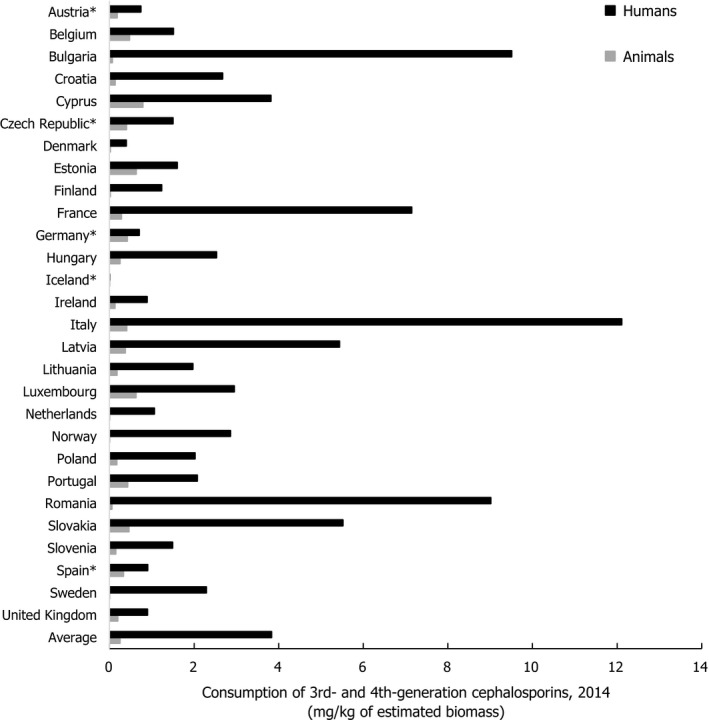
Asterisk (*) denotes that only community consumption was provided for human medicine. The population‐weighted mean proportion (%) of the hospital sector from the 2014 total national consumption of antimicrobials for
EU /EEA MS s that provided data for both sectors was 51.1%.1) The estimates presented are crude and must be interpreted with caution. For limitations that hamper the comparison of consumption of antimicrobials in humans and animals, please see Section 14.
2) The average figure represents the population‐weighted mean of data from included countries.
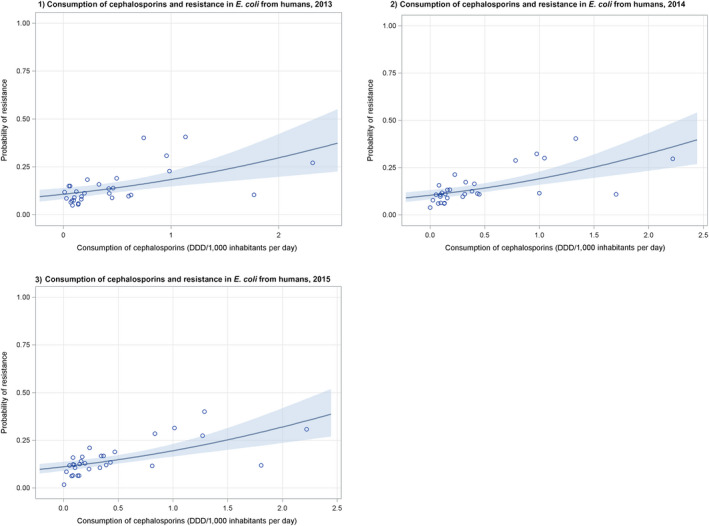
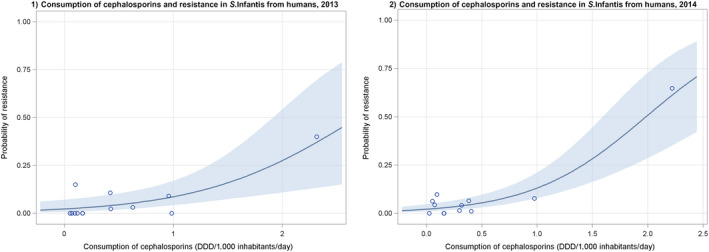
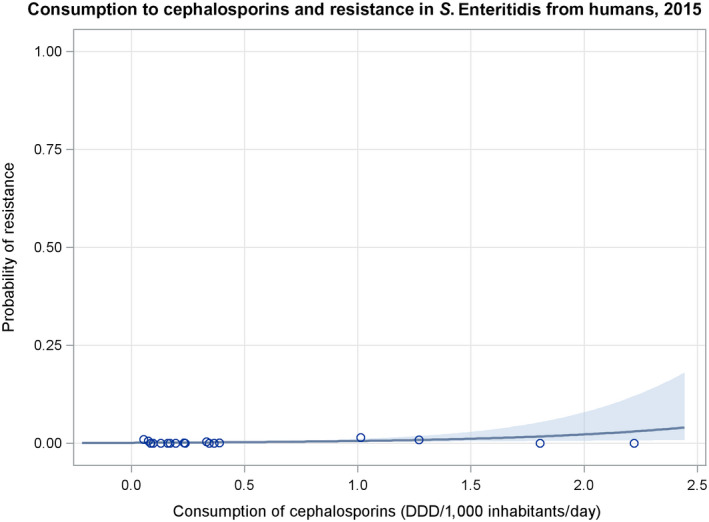
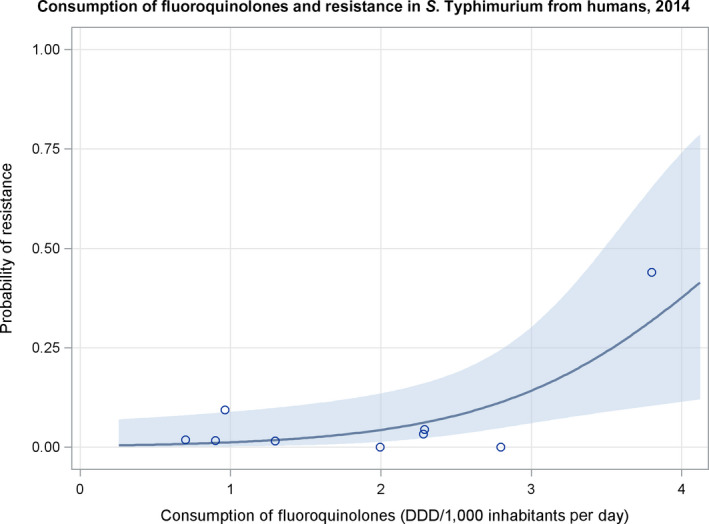
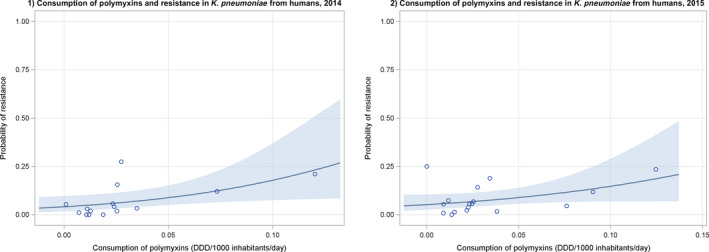
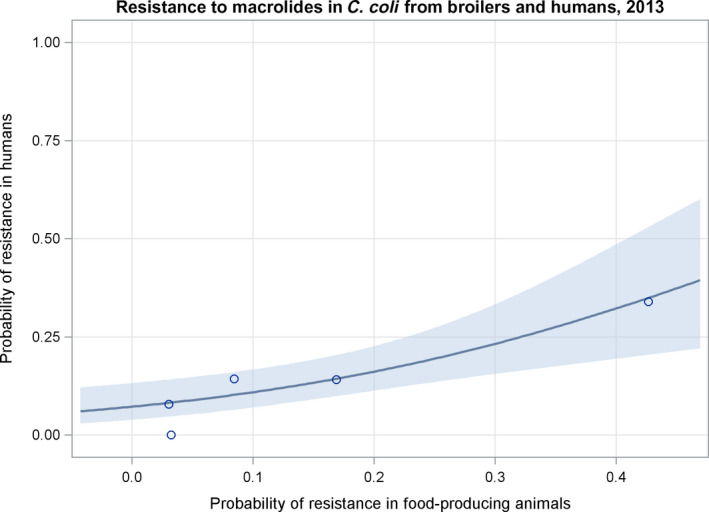
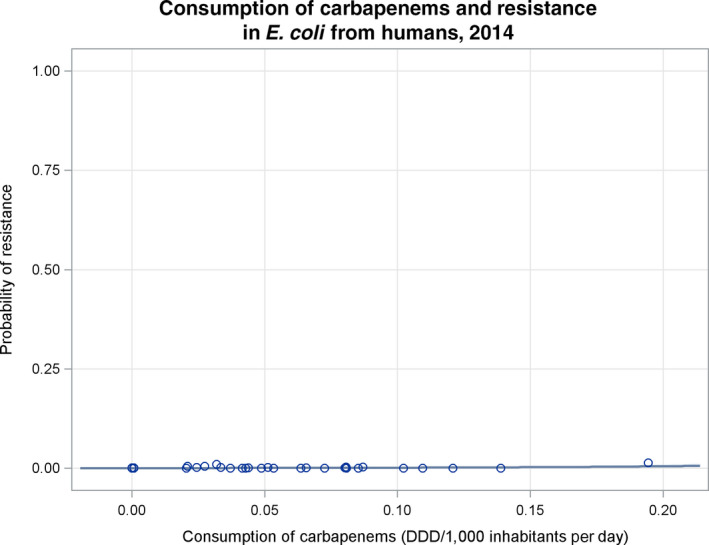
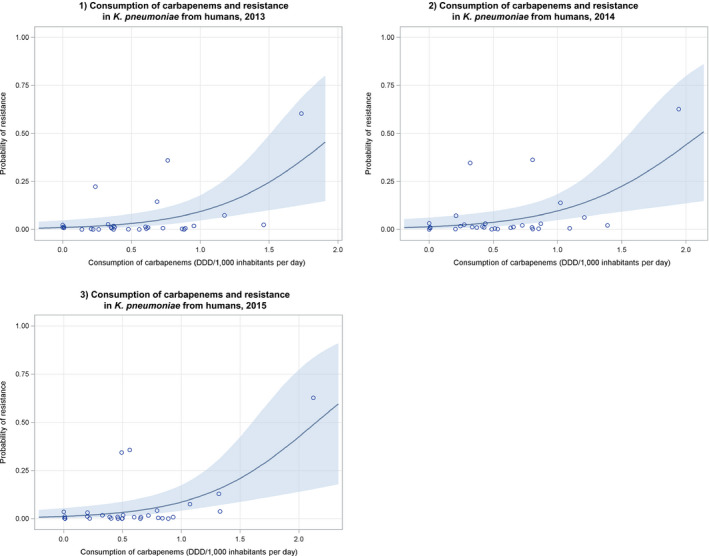
Dots represent countries included in the analysis.
Dots represent countries included in the analysis.
Dots represent countries included in the analysis.
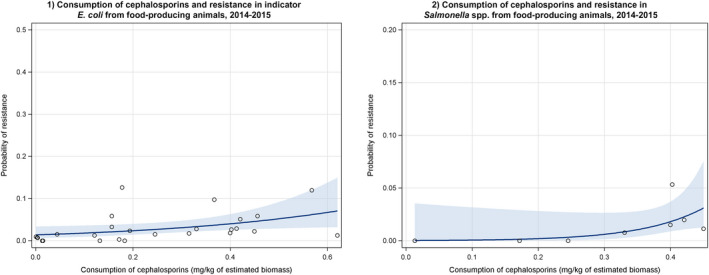
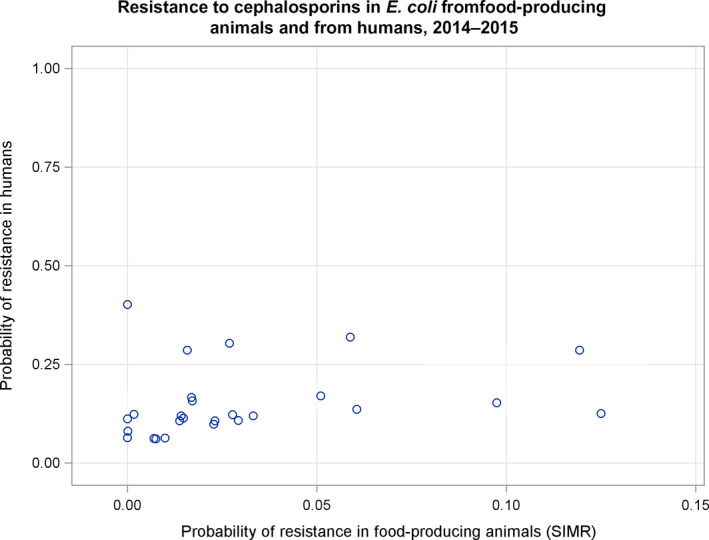
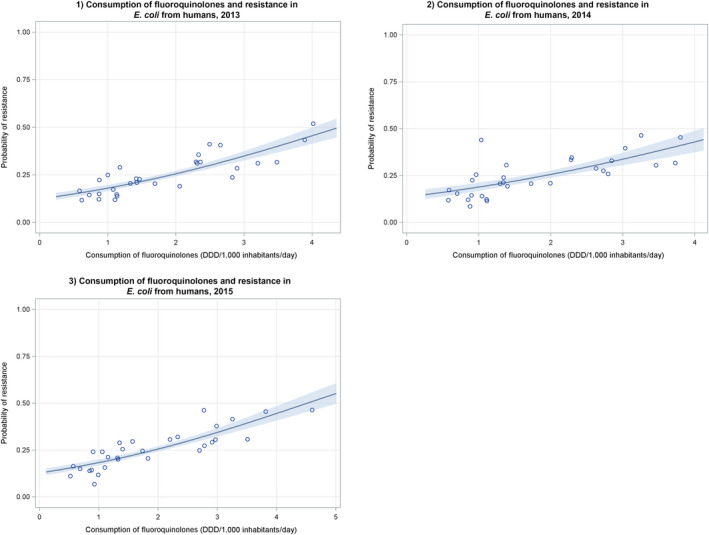
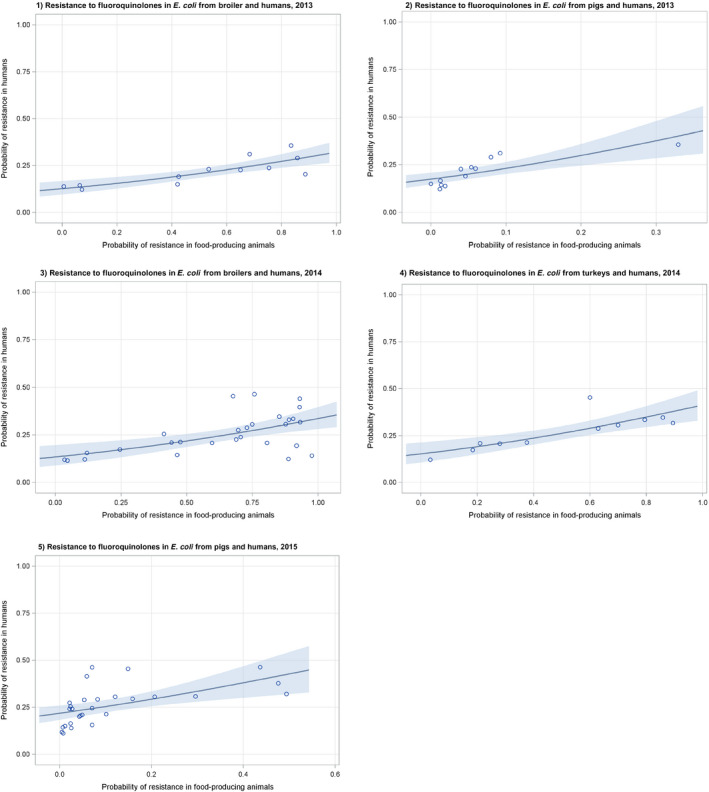
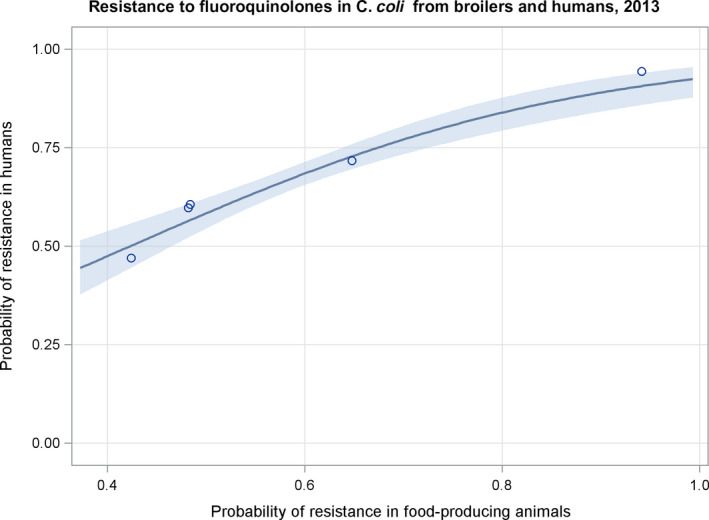
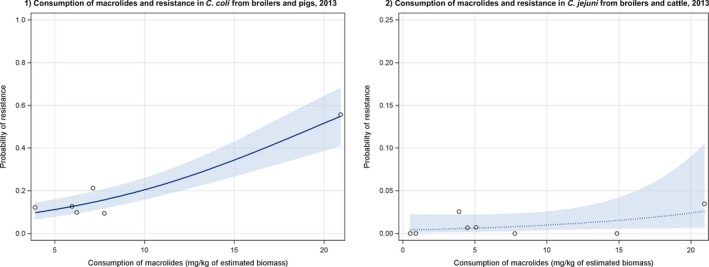
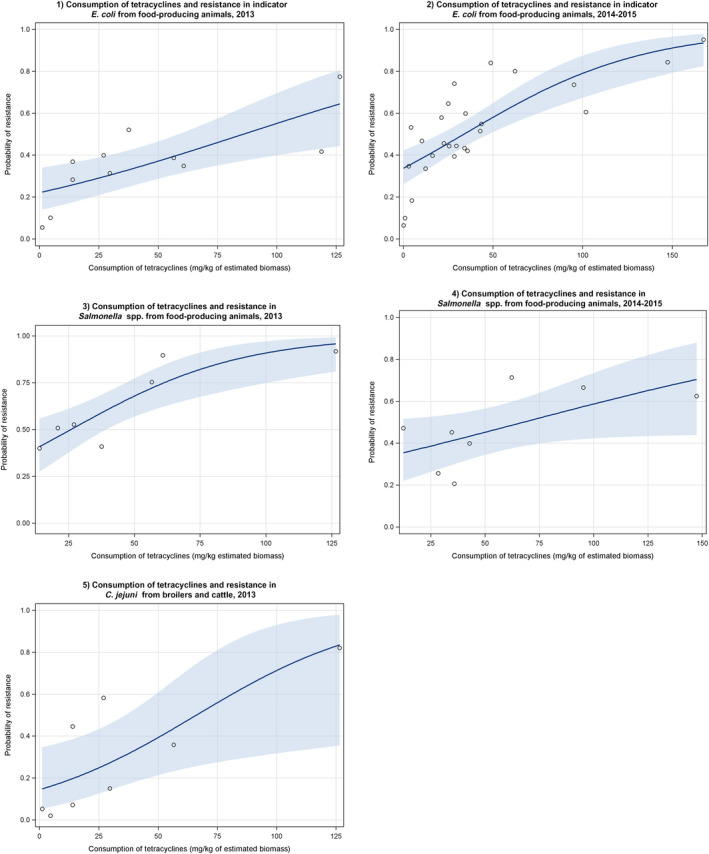
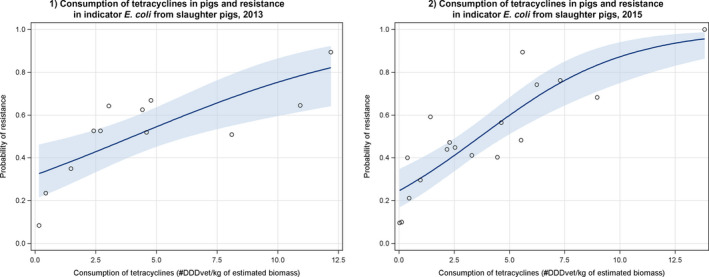
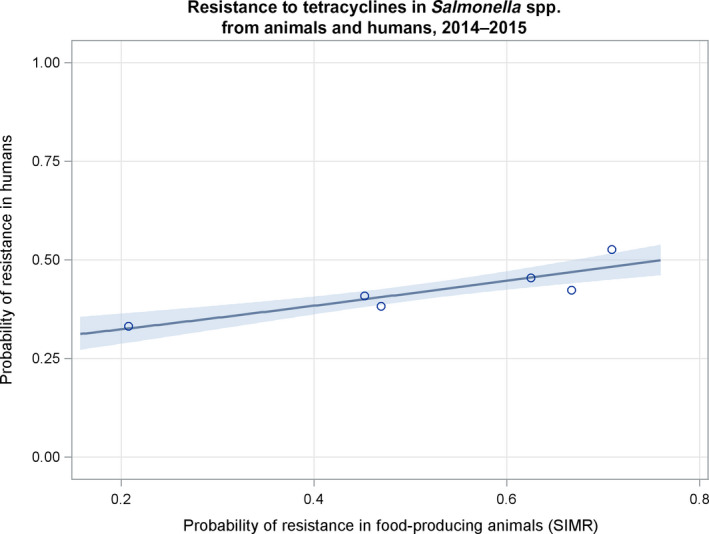
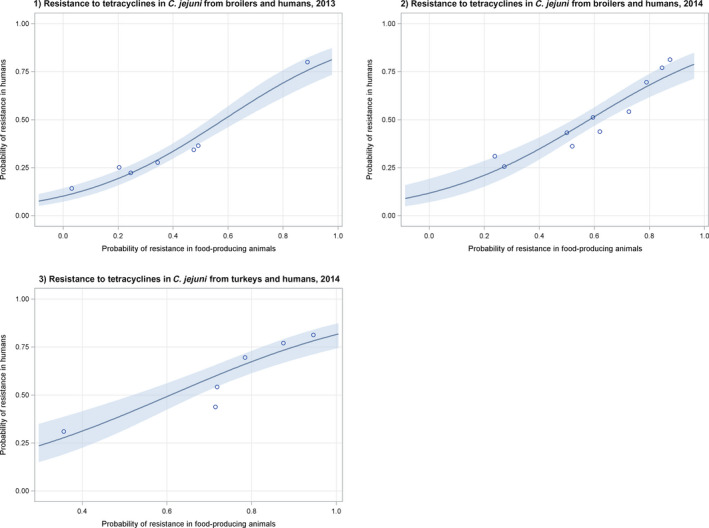
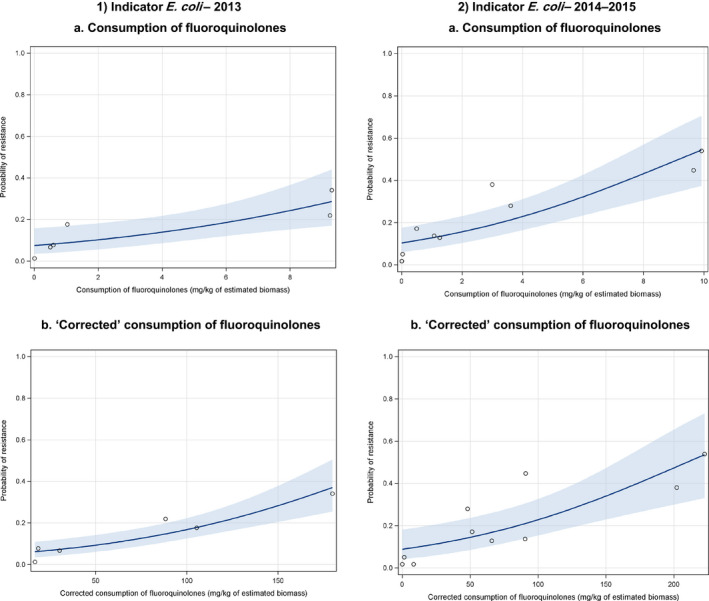
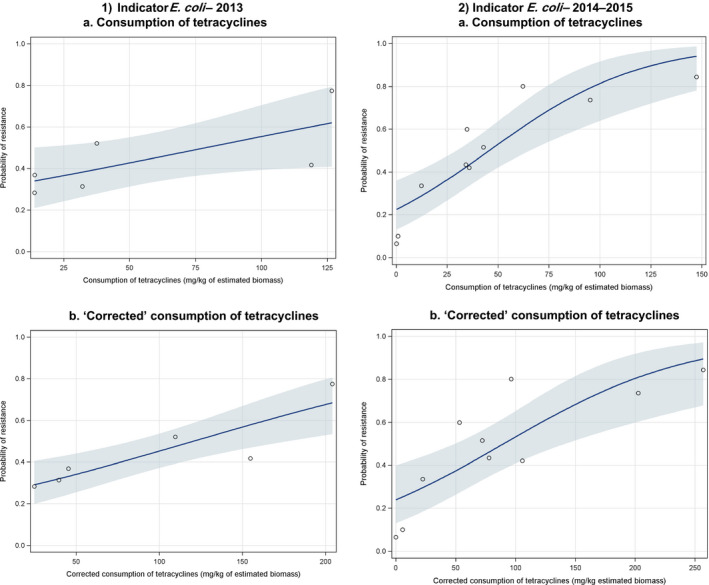
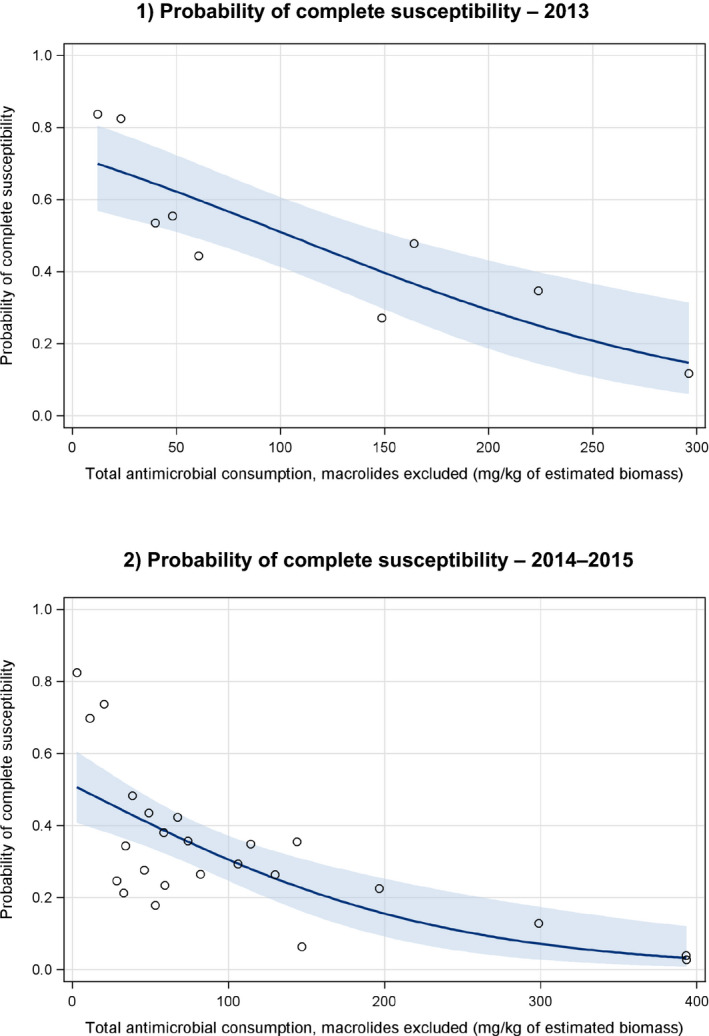
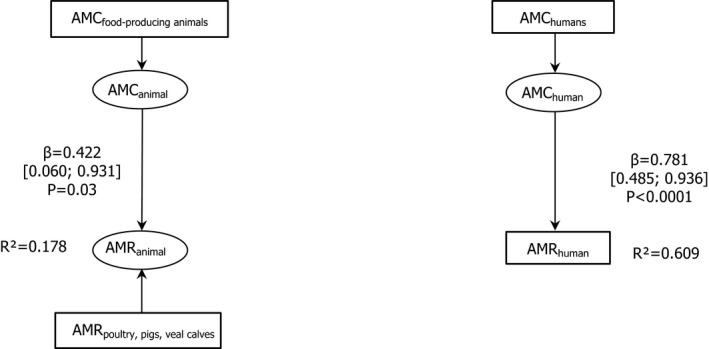
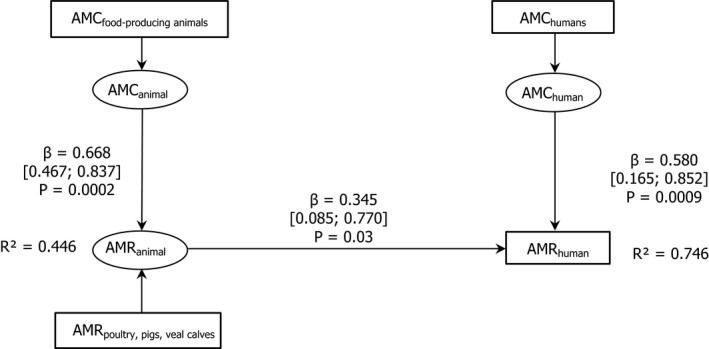
Dots represent the countries involved in the analysis. The category ‘food‐producing animals’ includes broilers, pigs and cattle for 2013, and broilers, turkeys, pigs and calves for 2014–2015. The scale used in these graphs is adapted according to the range of probabilities of resistance observed, in order to best show the distribution of data points.
Dots represent countries included in the analysis. Note: The figure displays a non‐significant correlation. When two countries (outliers) were excluded from the analysis, a significant correlation was found.
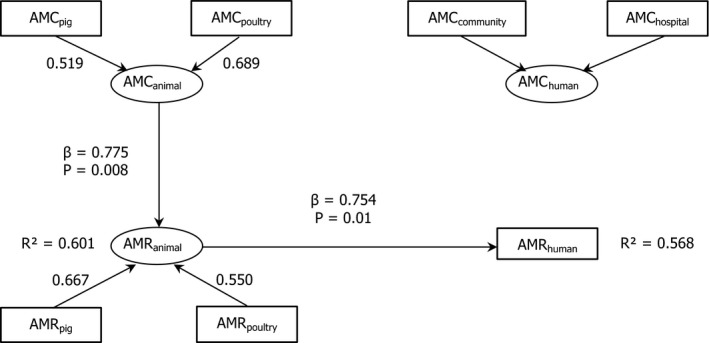
26 countries:
AT *,BE ,BG ,CY ,CZ *†,DE *,DK ,EE ,ES *†,FI ,FR ,HR ,HU ,IE ,IT ,LT †,LV ,NL ,NO ,PL ,PT ,RO ,SE ,SI ,SK †,UK (goodness‐of‐fit = 0.686).†For these countries, the AMC in pigs in 2014 was used as a surrogate of that for 2015 (missing data).
*For these countries, the AMC at the hospital was estimated.
Asterisk (*) denotes that only community consumption was provided for human medicine. The population‐weighted mean proportion (%) of the hospital sector from the 2014 total national consumption of antimicrobials for
EU /EEA MS s that provided data for both sectors was 14.0%.1) The estimates presented are crude and must be interpreted with caution. For limitations that hamper the comparison of consumption of antimicrobials in humans and animals, please see Section 14.
2) The average figure represents the population‐weighted mean of data from included countries.
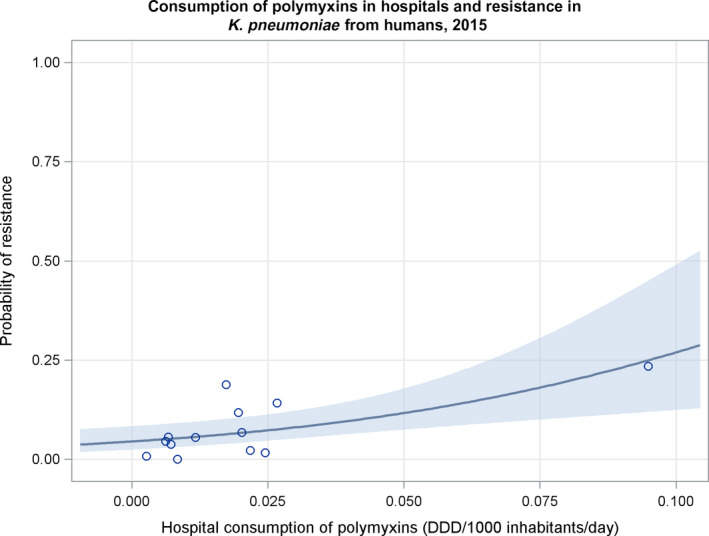
Dots represent countries included in the analysis.
Dots represent countries included in the analysis.
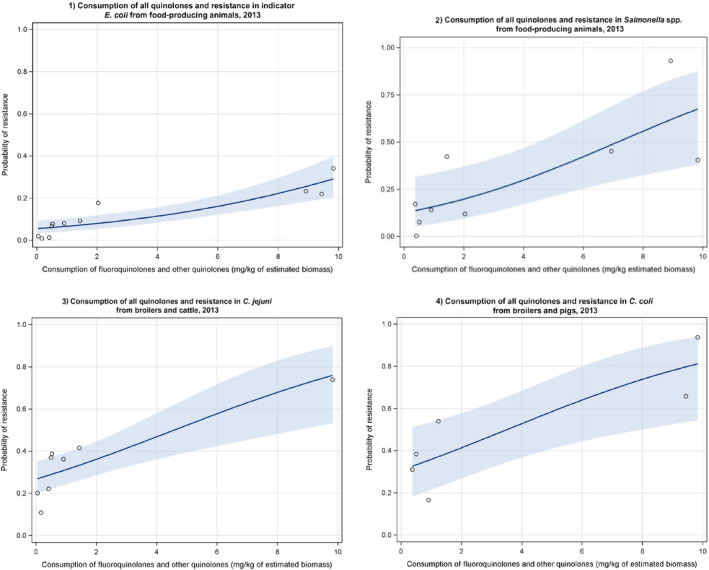
Dots represent the countries involved in the analysis. The category ‘food‐producing animals’ includes cattle, broilers and pigs in 2013.
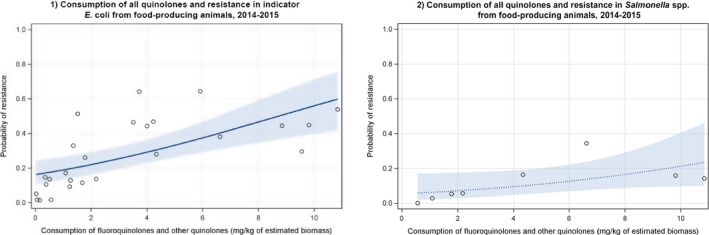
Dots represent the countries involved in the analysis. The category ‘food‐producing animals’ includes broilers, turkeys, pigs and calves for 2014–2015.
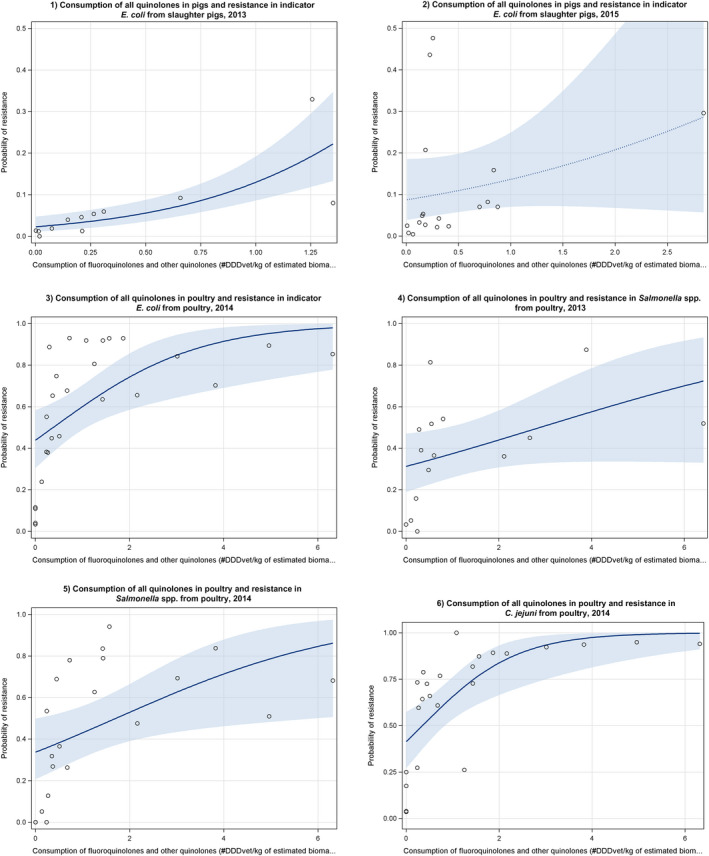
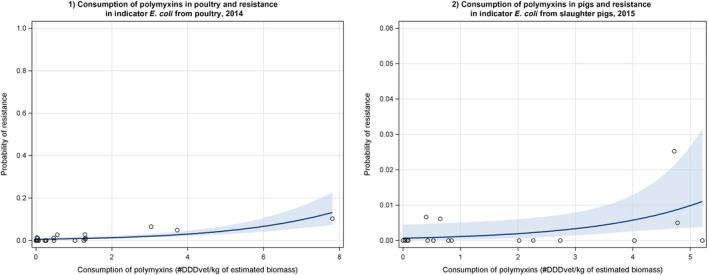
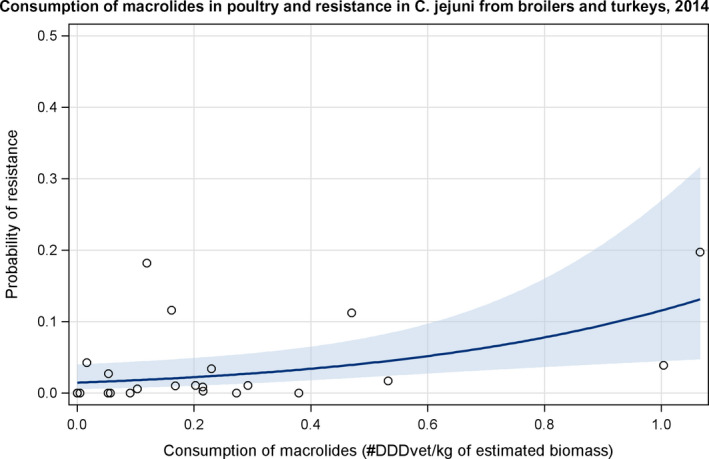
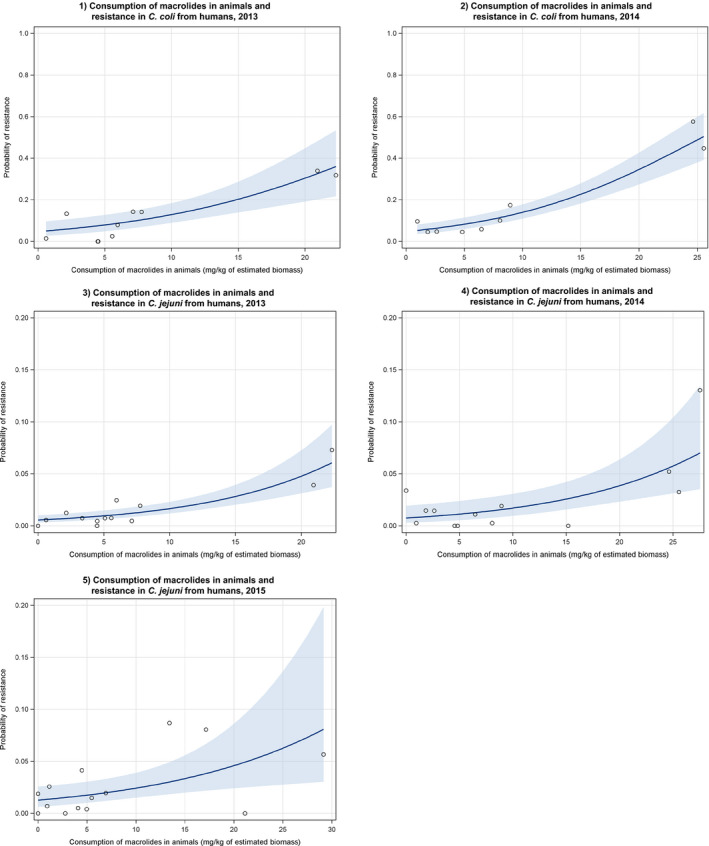
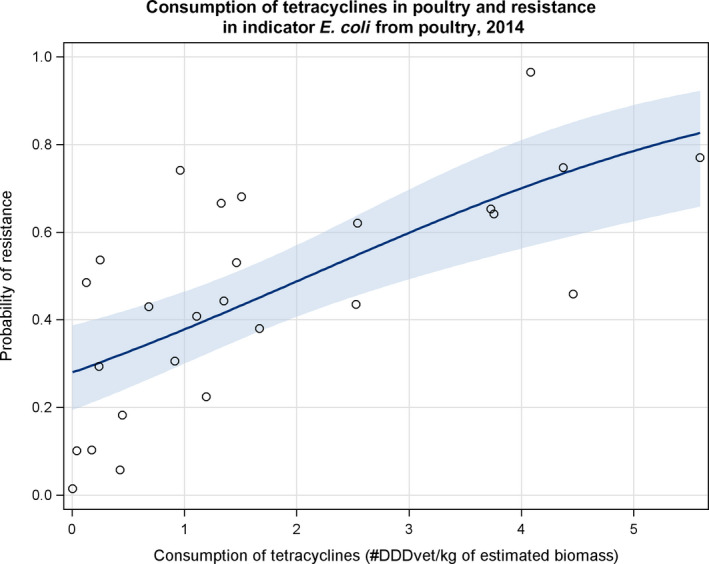
Dots represent the countries involved in the analysis. The category ‘poultry’ includes broilers for 2013 and broilers and turkeys for 2014. The scale used in graphs (5) and (6) is adapted according to the range of probabilities of resistance observed, in order to best show the distribution of data points. In graph (6), the dashed curve means that the corresponding association is not significant, although it becomes significant while disregarding the three outlying dots in the upper left hand corner of the graph.
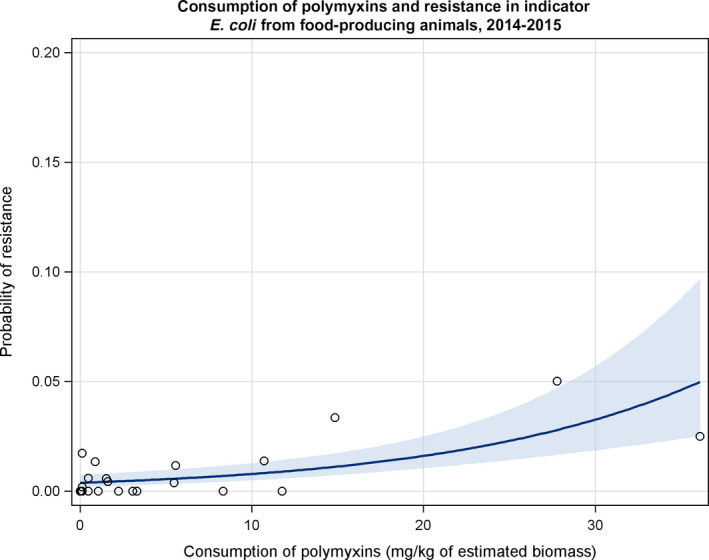
Dots represent countries included in the analysis.
Dots represent countries included in the analysis.
Dots represent countries included in the analysis.
Dots represent countries included in the analysis.
Dots represent countries included in the analysis.

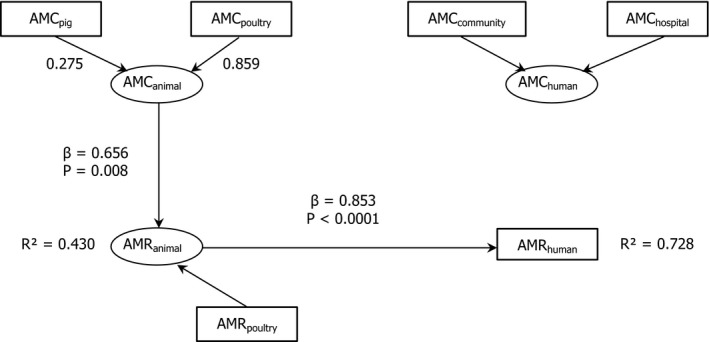
26 countries:
AT *,BE ,BG ,CY ,CZ *†,DE *,DK ,EE ,ES *†,FI ,FR ,HR ,HU ,IE ,IT ,LT †,LV ,NL ,NO ,PL ,PT ,RO ,SE ,SI ,SK †,UK (Goodness‐of‐fit = 0.668).†For these countries, the estimated consumption in pigs in 2014 was used as a proxy for 2015 missing data.
*For these countries, consumption in hospital was estimated.
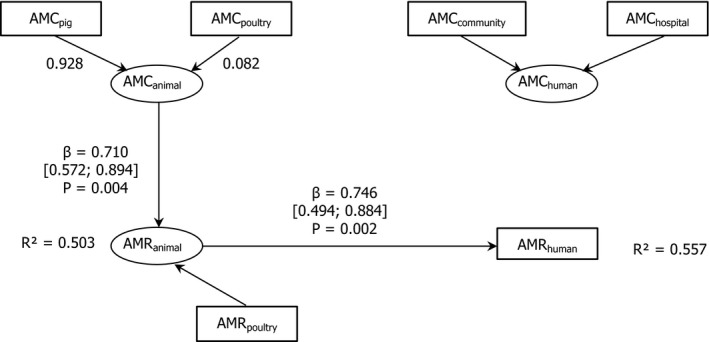
10 countries involved:
BE ,DE *,DK ,ES *†,FR ,HU ,PT ,RO ,SK †,UK (Goodness‐of‐fit = 0.627).†For these countries, the estimated consumption in pigs in 2014 was used as a proxy for 2015 missing data.
*For these countries, consumption in hospital was estimated.
15 countries:
AT *,CY ,DK ,ES *,FI ,FR ,IS ,IT ,LT ,NL ,PT ,RO ,SI ,SK ,UK (Goodness‐of‐fit = 0.617).*For these countries, consumption in hospital was estimated.
Asterisk (*) denotes that only community consumption was provided for human medicine. The population‐weighted mean proportion (%) of the hospital sector from the 2014 total national consumption of antimicrobials for
EU /EEA MS s that provided data for both sectors is 51.4%.1) The estimates presented are crude and must be interpreted with caution. For limitations that hamper the comparison of consumption of antimicrobials by humans and animals, please see Section 14.
2) The average figure represents the population‐weighted mean of data from included countries.
Dots represent countries included in the analysis.
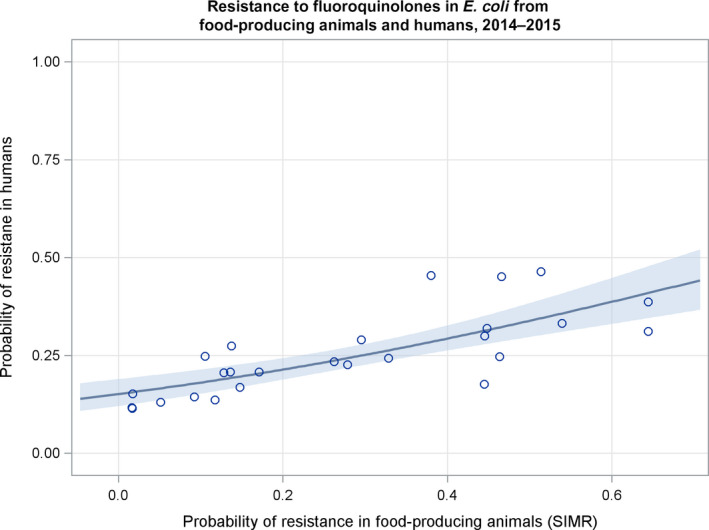
Dots represent the countries involved in the analysis. The category ‘food‐producing animals’ include broilers, turkeys, pigs and calves for 2014–2015.
The scale used in the graph is adapted according to the range of probabilities of resistance observed, in order to best show the distribution of data points.
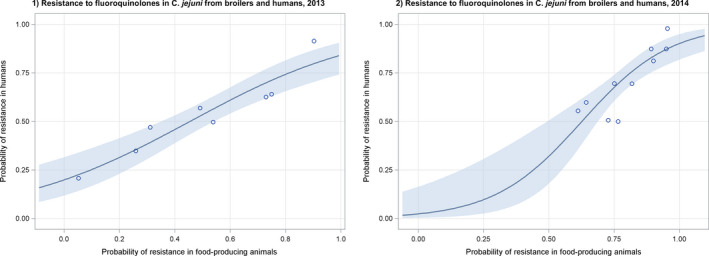
Dots represent the countries involved in the analysis. The poultry category includes broilers and turkeys. The scale used in graph (2) was adapted according to the range of probabilities of resistance observed, in order to best show the distribution of data points.
Asterisk (*) denotes that only community consumption was provided for human medicine. The population‐weighted mean proportion (%) of the hospital sector from the 2014 total national consumption of antimicrobials for
EU /EEA MS s that provided data for both sectors is 4.2%.1) The estimates presented are crude and must be interpreted with caution. For limitations that hamper the comparison of consumption of antimicrobials in humans and animals, please see Section 14.
2) The average figure represents the population‐weighted mean of data from included countries.
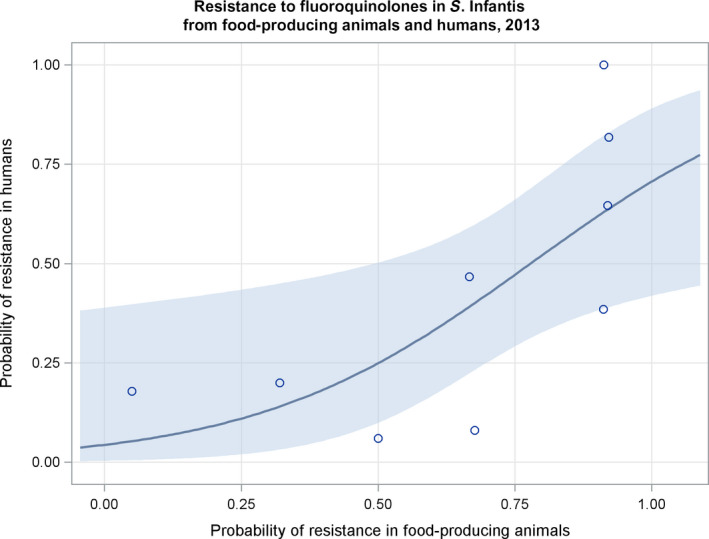
Dots represent the countries involved in the analysis.
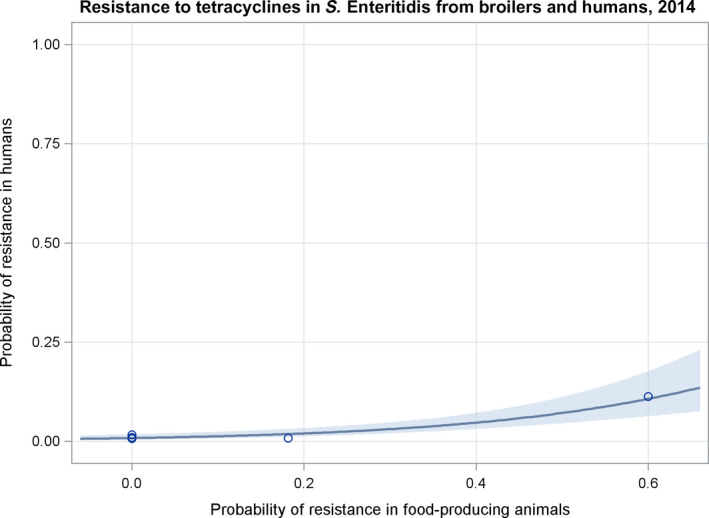
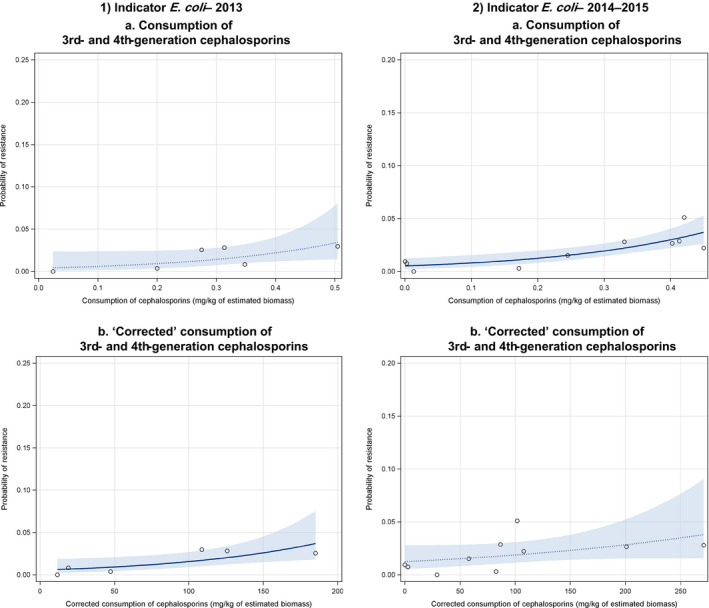
Note: 1) The scale used in graph (2) was adapted according to the range of probabilities of resistance observed, in order to best show the distribution of data points.
2) In graph (2), the dashed curve means that the association is not significant.
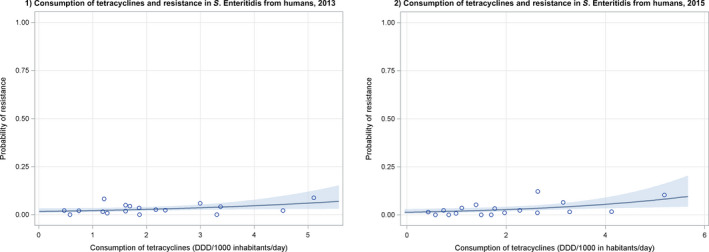
Dots represent the countries involved in the analysis.
Dots represent countries included in the analysis.
Dots represent the countries involved in the analysis.
The scale used in graphs (3), (4) and (5) is adapted according to the range of probabilities of resistance observed, in order to best show the distribution of data points.
Asterisk (*) denotes that only community consumption was provided for human medicine. The population‐weighted mean proportion (%) of the hospital sector from the 2014 total national consumption of antimicrobials for EU/EEA MSs that provided data for both sectors is 2.9%.
Notes: 1) The estimates presented are crude and must be interpreted with caution. For limitations that hamper the comparison of consumption of antimicrobials in humans and animals, please see Section 14.
2) The average figure represents the population‐weighted mean of data from included countries.
Dots represent countries included in the analysis.
Dots represent the countries included in the analysis.
Category ‘food‐producing animals’ includes broilers, cattle and pigs for 2013 and broilers, turkeys, pigs and calves for 2014–2015.
Dots represent the countries included in the analysis.
Dots represent the countries included in the analysis.
Dots represent countries included in the analysis.
Dots represent countries included in the analysis.
Dots represent countries included in the analysis.
Dots represent countries included in the analysis.
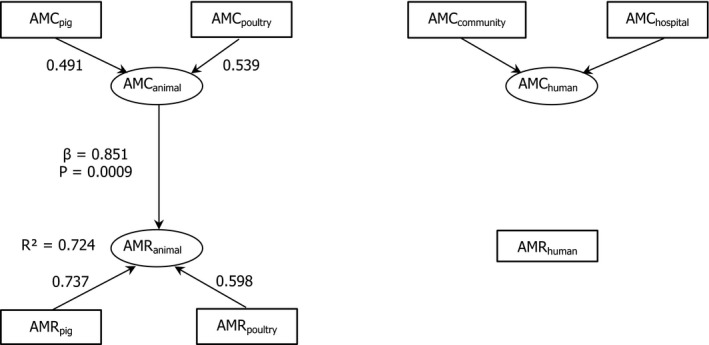
11 countries involved:
BE ,CY ,DE *,DK ,ES *†,FR ,HU ,PT ,RO ,SK †,UK (goodness‐of‐fit = 0.736).†For these countries, estimated consumption in pigs in 2014 was used as a proxy for 2015 missing data.
*For these countries, consumption in hospital was estimated.
14 countries:
AT *,CY ,DK ,ES *,FI ,FR ,IT ,LT ,NL ,PT ,RO ,SI ,SK ,UK .*For these countries consumption in hospital was estimated (goodness‐of‐fit = 0.689).
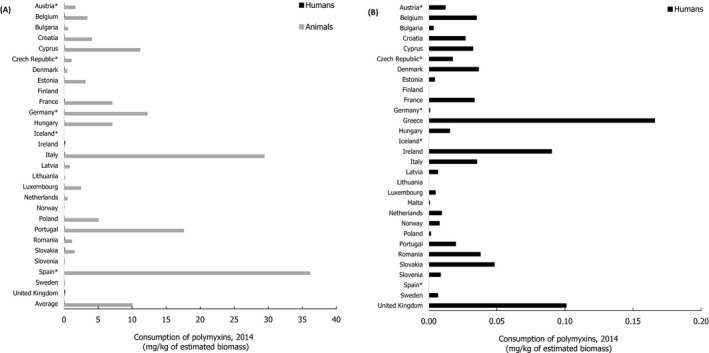
Asterisk (*) denotes that only community consumption was provided for human medicine. The population‐weighted mean proportion (%) of the hospital sector from the 2014 total national consumption of antimicrobials for
EU /EEA MS s that provided data for both sectors is 94.1%.
Dots represent countries involved in the analysis.
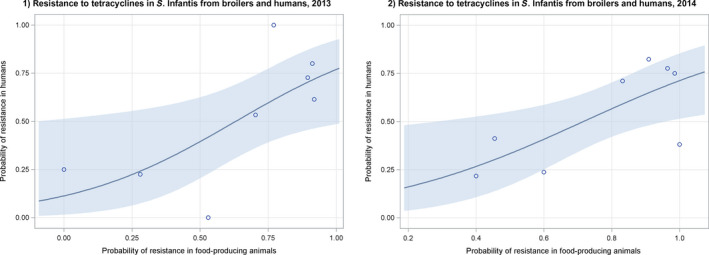
Dots represent the countries included in the analysis. Note: In the absence of 2013 resistance data, proxy data for years prior to 2013 may have been used. Regarding resistance data, food‐producing animals include broilers, pigs and cattle for 2013 and broilers, turkeys, pigs and veal calves for 2014–2015. In graphs (1.a). and (2.b.), the dashed curve means that the association is not significant.
Dots represent the countries included in the analysis.
Note: In the absence of 2013 resistance data, proxy data for years prior to 2013 may have been used. Regarding resistance data, food&–hyphen;producing animals include broilers, pigs and cattle for 2013 and broilers, turkeys, pigs and veal calves for 2014–2015.
Dots represent the countries included in the analysis.
Note: In the absence of 2013 resistance data, proxy data for years prior to 2013 may have been used. Regarding resistance data, food‐producing animals include broilers, pigs and cattle for 2013 and broilers, turkeys, pigs and veal calves for 2014–2015.
Dots represent the countries included in the analysis.
Regarding resistance data, the category ‘food‐producing animals’ includes broilers, pigs and cattle for 2013, and broilers, turkeys, pigs and veal calves for 2014–2015.


26 countries:
AT ,BE ,BG ,CY ,CZ ,DE ,DK ,EE ,ES ,FI ,FR ,HR ,HU ,IE ,IT ,LT ,LV ,NL ,NO ,PL ,PT ,RO ,SE ,SI ,SK ,UK .
26 countries:
AT ,BE ,BG ,CY ,CZ ,DE ,DK ,EE ,ES ,FI ,FR ,HR ,HU ,IE ,IT ,LT ,LV ,NL ,NO ,PL ,PT ,RO ,SE ,SI ,SK ,UK .
References
-
- Alsamarai AM, Abbas HM and Atia QM. 2015. Nasal carriage of methicillin resistant Staph aureus in food provider in restaurant at Samara city. World Journal of Pharmacy and Pharmaceutical Sciences 4, 50–58.
-
- Aviv G, Tsyba K, Steck N, Salmon‐Divon M, Cornelius A, Rahav G, Grassl GA and Gal‐Mor O, 2014. A unique megaplasmid contributes to stress tolerance and pathogenicity of an emergent Salmonella enterica serovar Infantis strain. Environmental Microbiology 16, 977–994. - PubMed
-
- Blix HS, Engeland A, Litleskare I and Rønning M, 2007. Age‐and gender‐specific antibacterial prescribing in Norway. Journal of Antimicrobial Chemotherapy 59, 971–976. - PubMed
-
- Brink AJ, Coetzee J, Corcoran C, Clay CG, Hari‐Makkan D, Jacobson RK, Richards GA, Feldman C, Nutt L, van Greune J, Deetlefs JD, Swart K, Devenish L, Poirel L and Nordmann P, 2013. Emergence of OXA‐48 and OXA‐181 carbapenemases among Enterobacteriaceae in South Africa and evidence of in vivo selection of colistin resistance as a consequence of selective decontamination of the gastrointestinal tract. Journal of Clinical Microbiology 51, 369–372. - PMC - PubMed
LinkOut - more resources
Full Text Sources
Research Materials
Miscellaneous