

Risks to human and animal health related to the presence of deoxynivalenol and its acetylated and modified forms in food and feed
- PMID: 32625635
- PMCID: PMC7010102
- DOI: 10.2903/j.efsa.2017.4718
Risks to human and animal health related to the presence of deoxynivalenol and its acetylated and modified forms in food and feed
Abstract
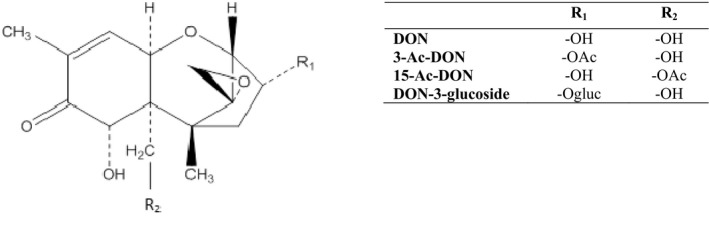
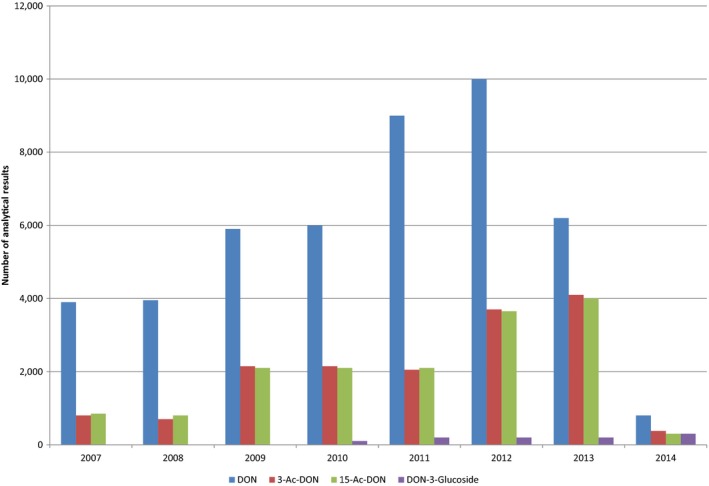
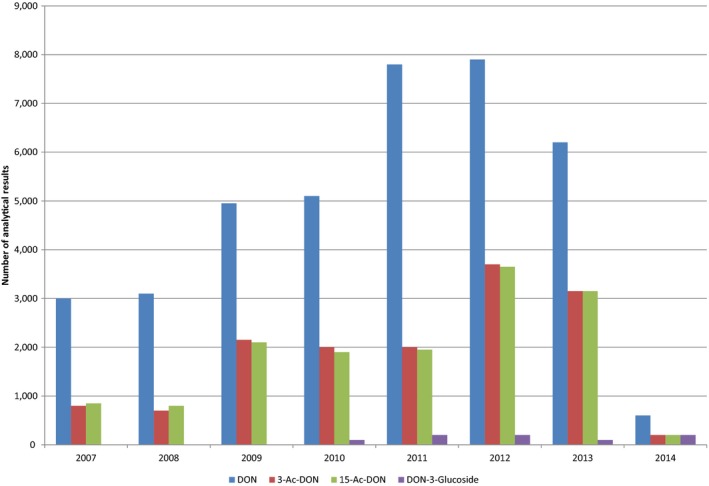
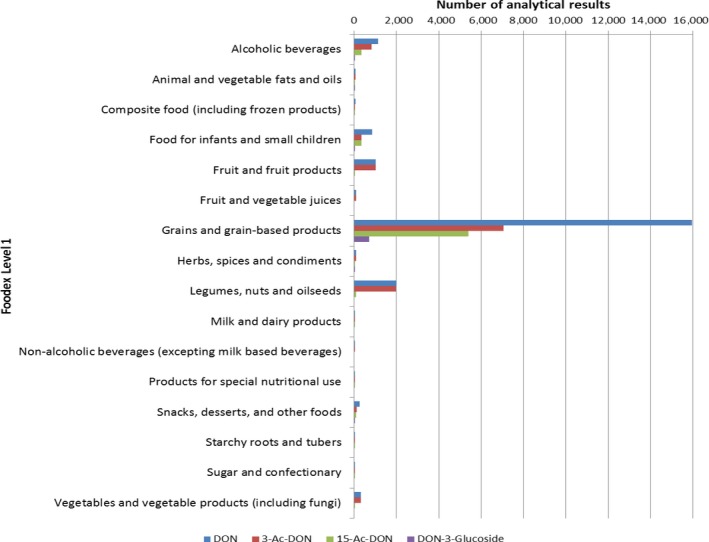
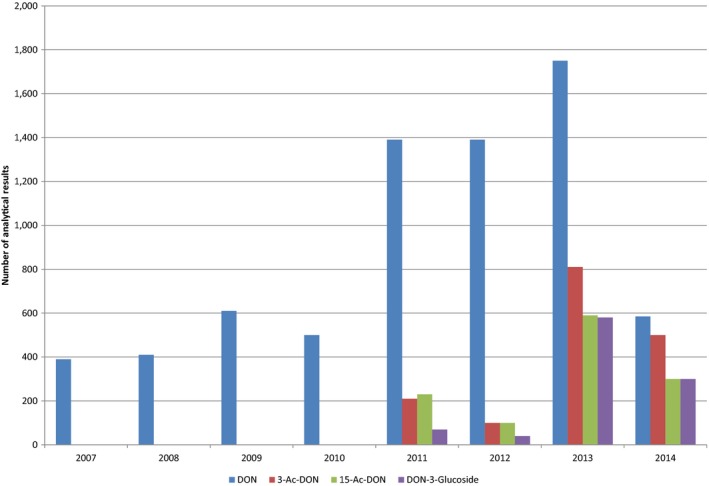
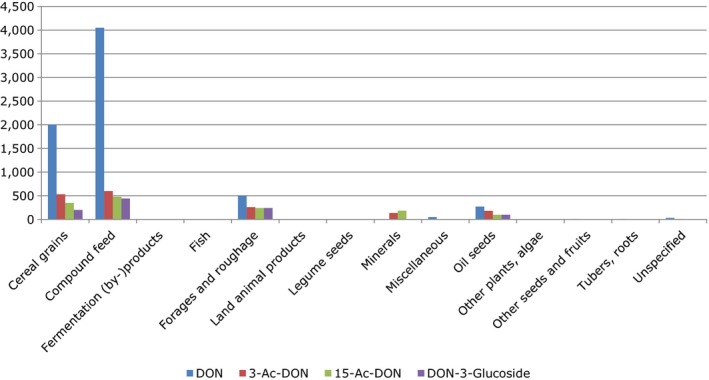
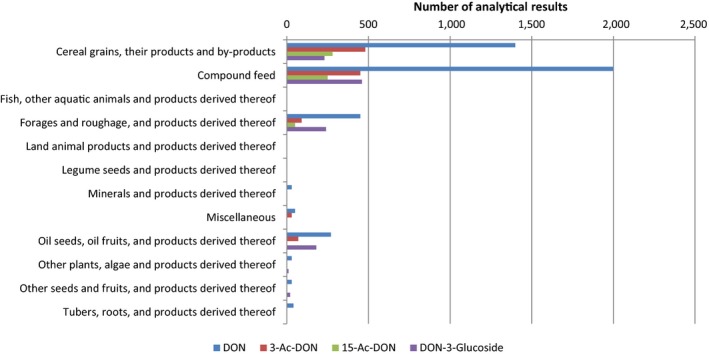
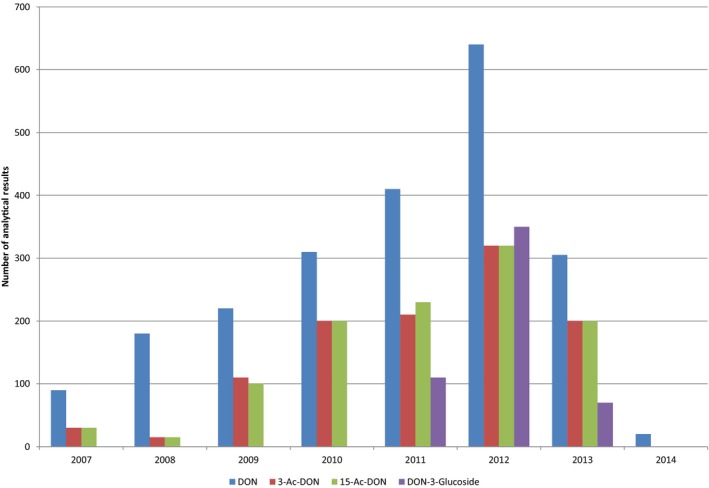
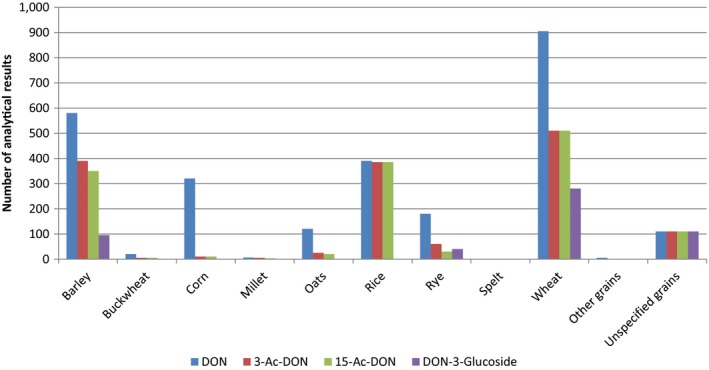
Deoxynivalenol (DON) is a mycotoxin primarily produced by Fusarium fungi, occurring predominantly in cereal grains. Following the request of the European Commission, the CONTAM Panel assessed the risk to animal and human health related to DON, 3-acetyl-DON (3-Ac-DON), 15-acetyl-DON (15-Ac-DON) and DON-3-glucoside in food and feed. A total of 27,537, 13,892, 7,270 and 2,266 analytical data for DON, 3-Ac-DON, 15-Ac-DON and DON-3-glucoside, respectively, in food, feed and unprocessed grains collected from 2007 to 2014 were used. For human exposure, grains and grain-based products were main sources, whereas in farm and companion animals, cereal grains, cereal by-products and forage maize contributed most. DON is rapidly absorbed, distributed, and excreted. Since 3-Ac-DON and 15-Ac-DON are largely deacetylated and DON-3-glucoside cleaved in the intestines the same toxic effects as DON can be expected. The TDI of 1 μg/kg bw per day, that was established for DON based on reduced body weight gain in mice, was therefore used as a group-TDI for the sum of DON, 3-Ac-DON, 15-Ac-DON and DON-3-glucoside. In order to assess acute human health risk, epidemiological data from mycotoxicoses were assessed and a group-ARfD of 8 μg/kg bw per eating occasion was calculated. Estimates of acute dietary exposures were below this dose and did not raise a health concern in humans. The estimated mean chronic dietary exposure was above the group-TDI in infants, toddlers and other children, and at high exposure also in adolescents and adults, indicating a potential health concern. Based on estimated mean dietary concentrations in ruminants, poultry, rabbits, dogs and cats, most farmed fish species and horses, adverse effects are not expected. At the high dietary concentrations, there is a potential risk for chronic adverse effects in pigs and fish and for acute adverse effects in cats and farmed mink.
Keywords: 15‐acetyl‐deoxynivalenol; 3‐acetyl‐deoxynivalenol; Deoxynivalenol; deoxynivalenol‐3‐glucoside; exposure; human and animal risk assessment; toxicity.
© 2017 European Food Safety Authority. EFSA Journal published by John Wiley and Sons Ltd on behalf of European Food Safety Authority.
Figures
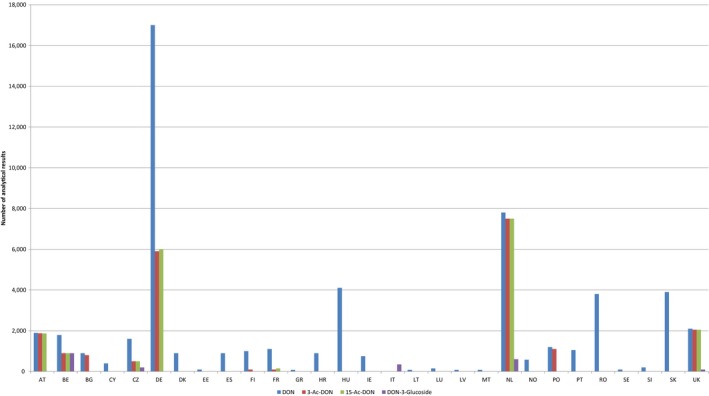
Results were reported for food, feed and unprocessed grains of undefined end use. AT, Austria; BE, Belgium; BG, Bulgaria; CY, Cyprus; CZ, the Czech Republic; DE, Germany; DK, Denmark; EE, Estonia; ES, Spain; FI, Finland; FR, France; GR, Greece; HU, Hungary; IE, Ireland; IT, Italy; LT, Lithuania; LU, Luxembourg; LV, Latvia; MT, Malta; NL, the Netherlands; NO, Norway; PO, Poland; PT, Portugal; RO, Romania; SE, Sweden; SI, Slovenia; SK, Slovakia; UK, the United Kingdom.
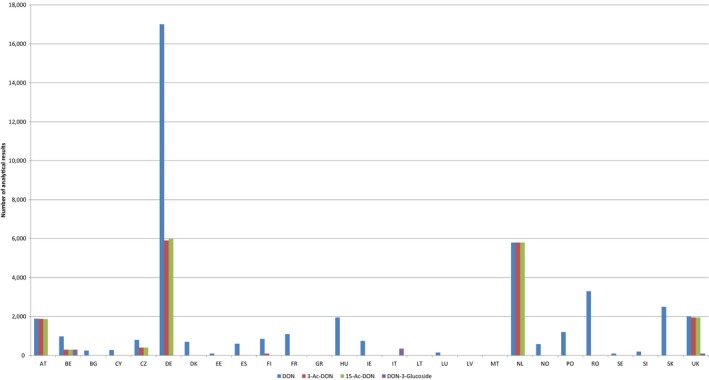
AT, Austria; BE, Belgium; BG, Bulgaria; CY, Cyprus; CZ, the Czech Republic; DE, Germany; DK, Denmark; EE, Estonia; ES, Spain; FI, Finland; FR, France; GR, Greece; HU, Hungary; IE, Ireland; IT, Italy; LT, Lithuania; LU, Luxembourg; LV, Latvia; MT, Malta; NL, the Netherlands; NO, Norway; PO, Poland; RO, Romania; SE, Sweden; SI, Slovenia; SK, Slovakia; UK, the United Kingdom.
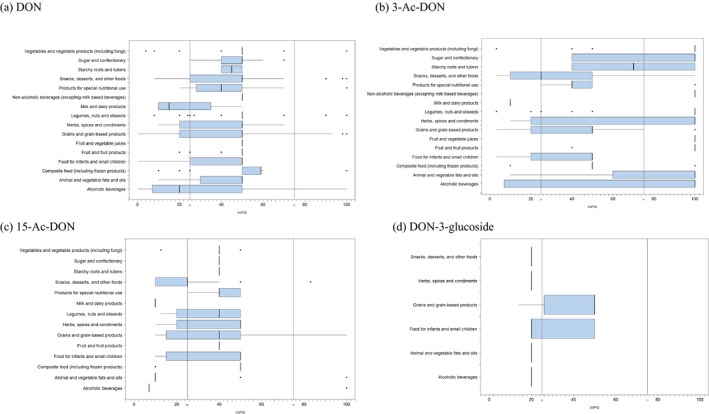
(Box‐plot: whiskers at minimum and maximum, box at 25th percentile and 75th percentile with line at 50th percentile). When the median is equal to the lower or upper quartile, the median and the quartile overlap and in the graph a bold single line is displayed. This may occur especially when the number of left‐censored data is high. Moreover, when the maximum (minimum) value is equal to the upper (lower) quartile, whiskers overlap with the box and a bold line is displayed.
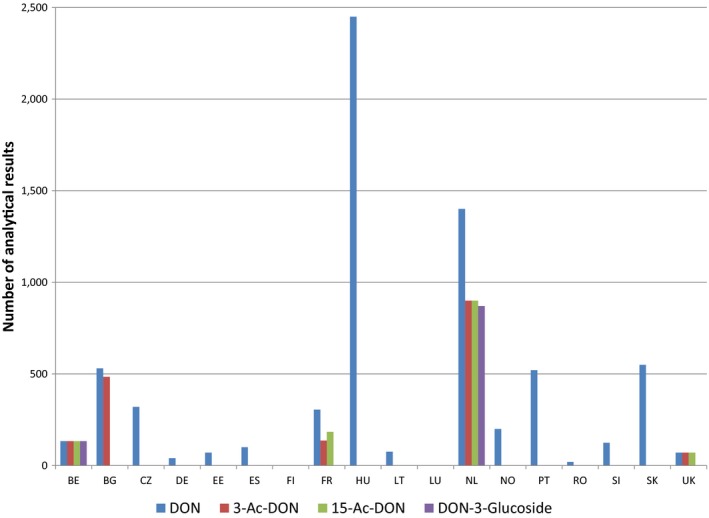
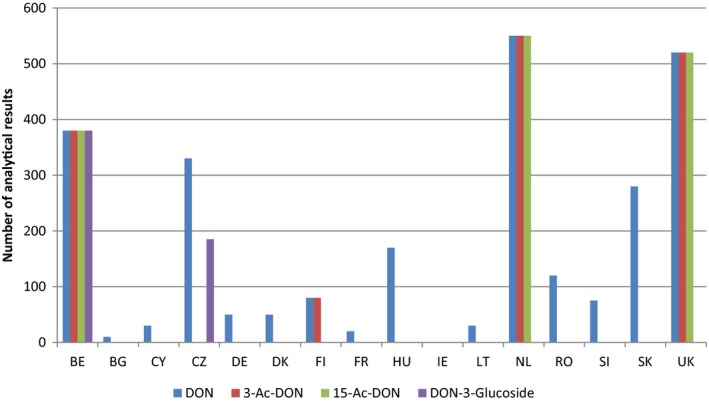
BE , Belgium;BG , Bulgaria;CZ , the Czech Republic;DE , Germany;EE , Estonia;ES , Spain;FI , Finland;FR , France;HU , Hungary;LT , Lithuania;LU , Luxembourg;NL , the Netherlands;NO , Norway;PT , Portugal;RO , Romania;SI , Slovenia;SK , Slovakia;UK , the United Kingdom.
BE , Belgium;BG , Bulgaria;CY , Cyprus;CZ , the Czech Republic;DE , Germany;DK , Denmark;FI , Finland;FR , France;HU , Hungary;IE , Ireland;LT , Lithuania;NL , the Netherlands;RO , Romania;SI , Slovenia;SK , Slovakia;UK , the United Kingdom.
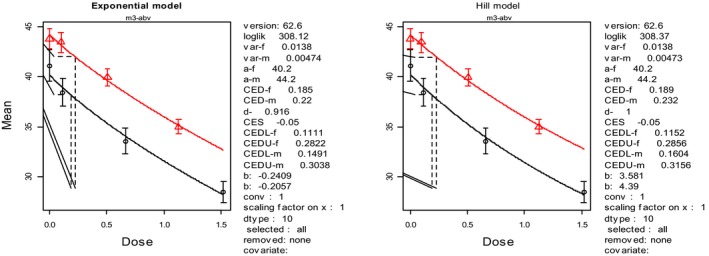
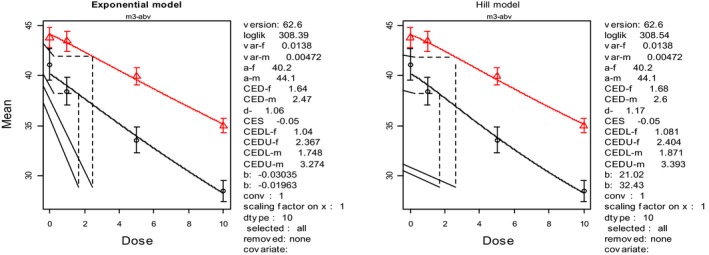
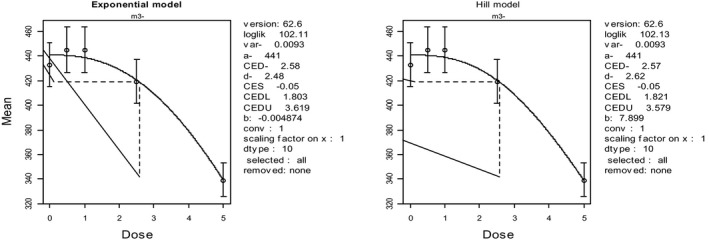
Mean body weight is expressed as g and dose as mg/kg bw per day. The red (upper) curve is for male and the black (lower) for female mice data.
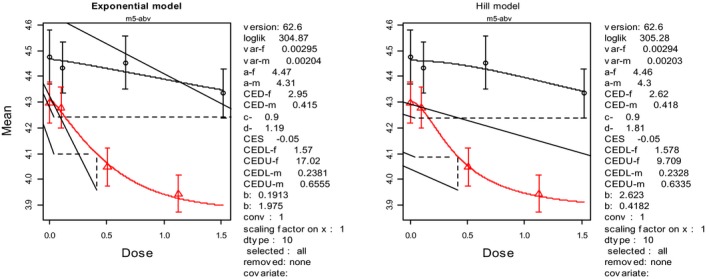
Mean feed intake is expressed as g feed per day and dose as mg/kg bw per day. The red curve is for female mice data and the black for male mice data.
Mean body weight is expressed as g and concentration as mg/kg feed per day. The red (upper) curve is for male and the black (lower) for female mice data.
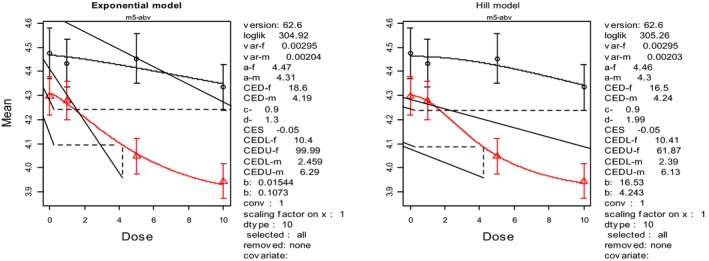
Mean feed intake is expressed as g feed per day and concentration as mg/kg feed per day. The red (upper) curve is for male and the black (lower) for female mice data.
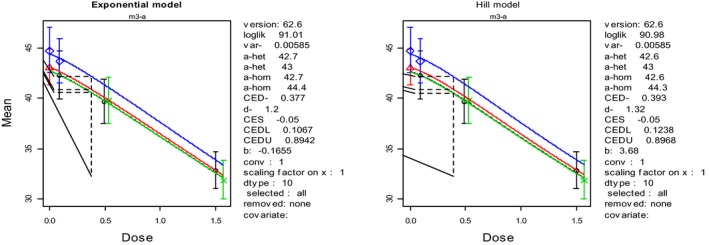
Means are expressed as body weight (g) and dose as mg/kg bw per day. The blue (upper) curve is for the p53+/+ male mice, the green (lower) for the p53+/− male mice and the red (middle) for the combined mice data.
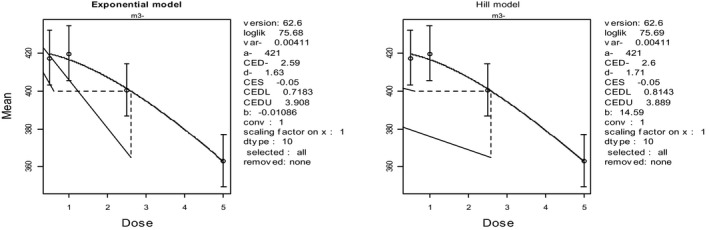
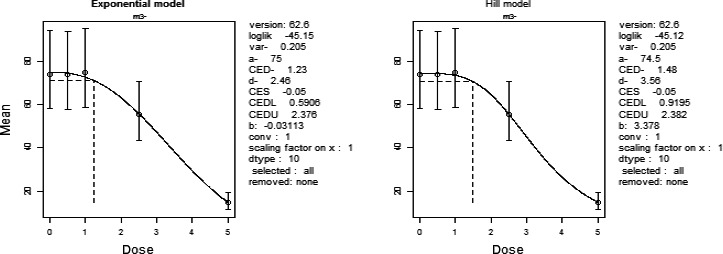
Mean is expressed as body weight (kg) and dose as mg/kg bw per day.
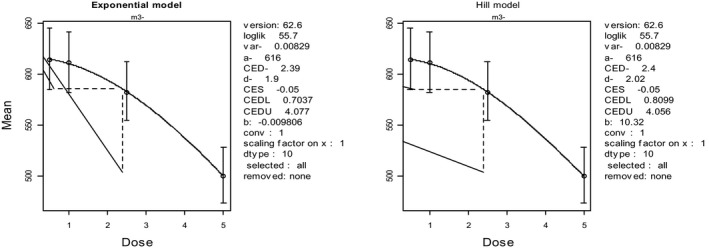
Mean is expressed as body weight (kg) and dose as mg/kg bw per day.
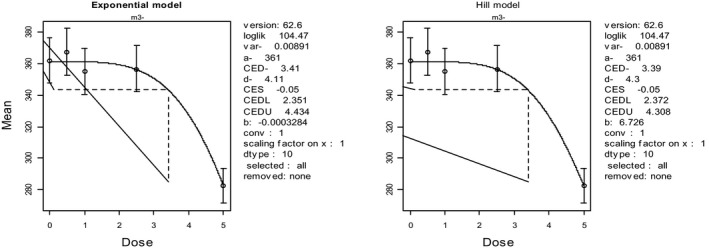
Mean is expressed as body weight (kg) and dose as mg/kg bw per day.
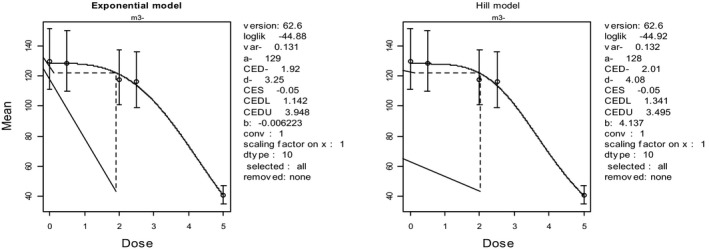
Mean is expressed as body weight (kg) and dose as mg/kg bw per day.
Mean is expressed as body weight (kg) and dose as mg/kg bw per day.
Mean is expressed as body weight (kg) and dose as mg/kg bw per day.
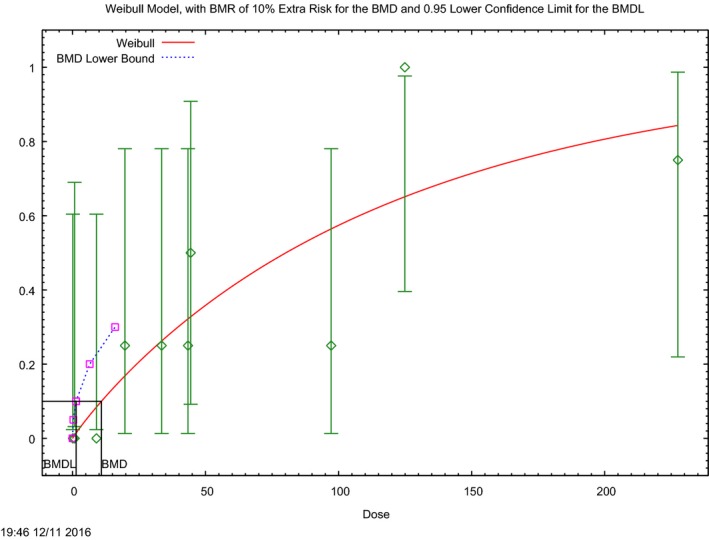
The (red) curve is the fitted dose–response curve from the Weibull model and the dotted line curve indicates the 95% lower confidence limit to the calculated BMCL.
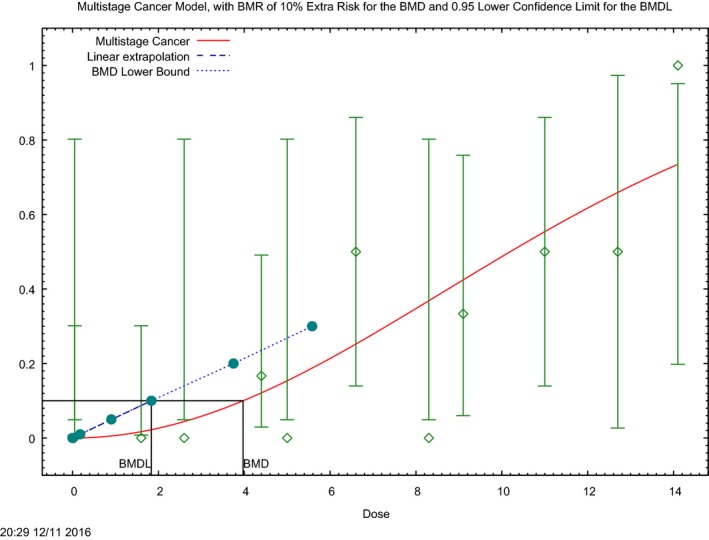
The (red) curve is the fitted dose–response curve and the dotted line curve indicates the 95% lower confidence limit to the calculated BMCL.
The (red) curve is the fitted dose–response curve and the dotted line curve indicates the 95% lower confidence limit to the calculated BMCL.
The (red) curve is the fitted dose–response curve and the dotted line curve indicates the 95% lower confidence limit to the calculated BMCL.
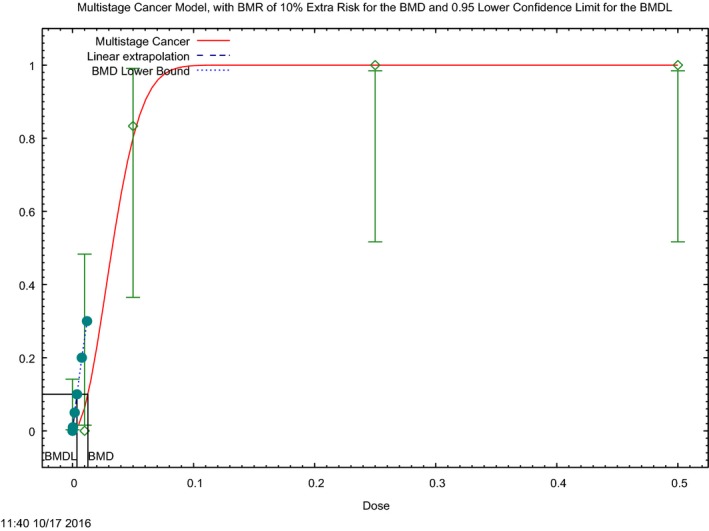
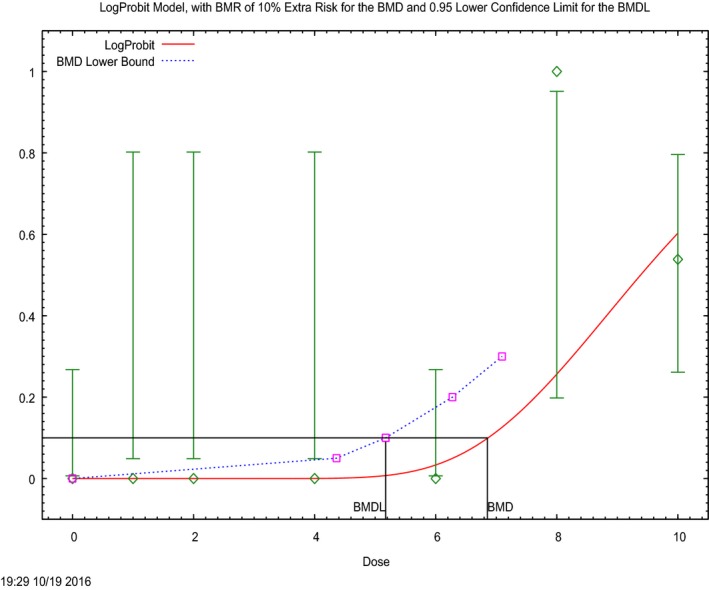
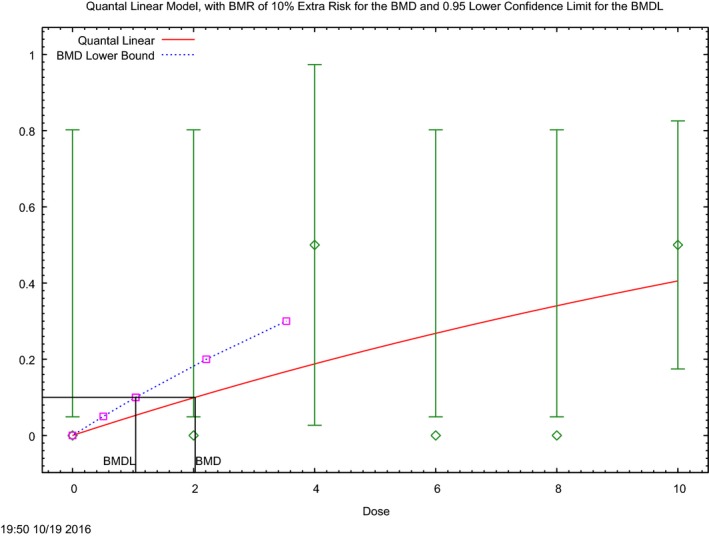
The (red) curve is the fitted dose–response curve and the dotted line curve indicates the 95% lower confidence limit to the calculated BMDL.
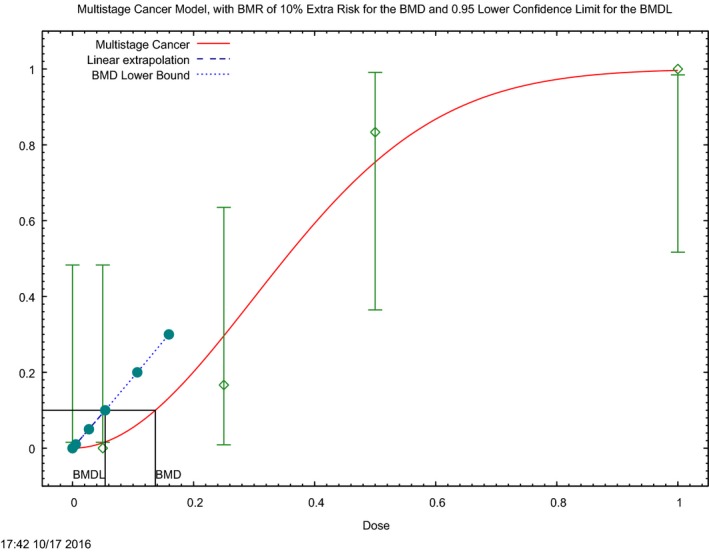
The (red) curve is the fitted dose–response curve and the dotted line curve indicates the 95% lower confidence limit to the calculated BMDL.
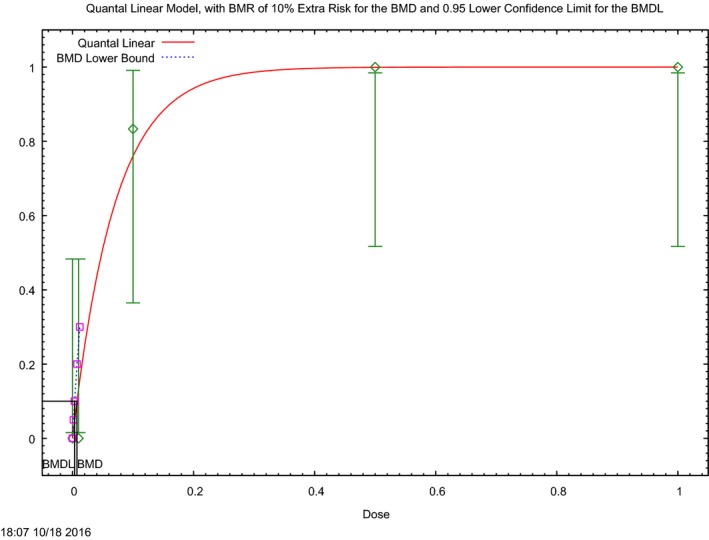
The (red) curve is the fitted dose–response curve and the dotted line curve indicates the 95% lower confidence limit to the calculated BMDL.
References
-
- Abia WA, Warth B, Sulyok M, Krska R, Tchana A, Njobeh PB, Turner PC, Kouanfack C, Eyongetah M, Dutton M and Moundipa PF, 2013. Bio‐monitoring of mycotoxin exposure in Cameroon using a urinary multi‐biomarker approach. Food and Chemical Toxicology, 62, 927–934. - PubMed
-
- Abramson D, House JD and Nyachoti CM, 2005. Reduction of deoxynivalenol in barley by treatment with aqueous sodium carbonate and heat. Mycopathologia, 160, 297–301. - PubMed
-
- Abdel‐Wahhab MS, El‐Kady AA, Hassan AM, Abd El‐Moneim OM and Abdel‐Aziem SH, 2015. Effectiveness of activated carbon and Egyptian montmorillonite in the protection against deoxynivalenol‐induced cytotoxicity and genotoxicity in rats. Food and Chemical Toxicology, 83, 174–182. - PubMed
-
- Accensi F, Pinton P, Callu P, Abella‐Bourges N, Guelfi JF, Grosjean F and Oswald IP, 2006. Ingestion of low doses of deoxynivalenol does not affect hematological, biochemical, or immune responses of piglets. Journal of Animal Science, 84, 1935–1942. - PubMed
LinkOut - more resources
Full Text Sources
Miscellaneous