

Risk to human health related to the presence of perfluorooctane sulfonic acid and perfluorooctanoic acid in food
- PMID: 32625773
- PMCID: PMC7009575
- DOI: 10.2903/j.efsa.2018.5194
Risk to human health related to the presence of perfluorooctane sulfonic acid and perfluorooctanoic acid in food
Abstract
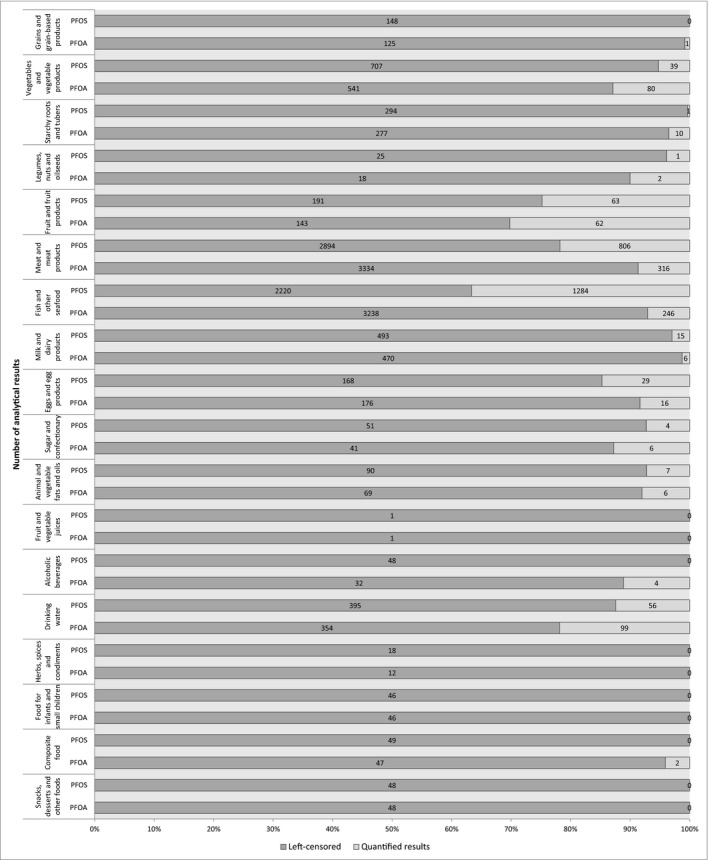
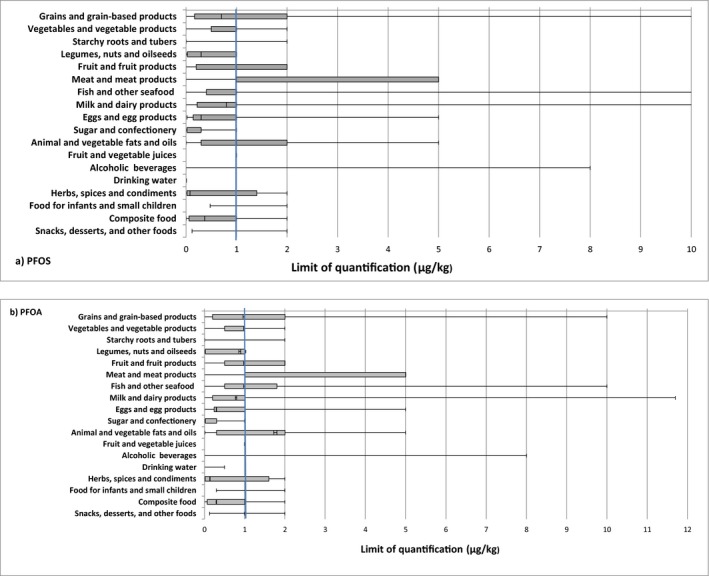
The European Commission asked EFSA for a scientific evaluation on the risks to human health related to the presence of perfluorooctane sulfonic acid (PFOS) and perfluorooctanoic acid (PFOA) in food. Regarding PFOS and PFOA occurrence, the final data set available for dietary exposure assessment contained a total of 20,019 analytical results (PFOS n = 10,191 and PFOA n = 9,828). There were large differences between upper and lower bound exposure due to analytical methods with insufficient sensitivity. The CONTAM Panel considered the lower bound estimates to be closer to true exposure levels. Important contributors to the lower bound mean chronic exposure were 'Fish and other seafood', 'Meat and meat products' and 'Eggs and egg products', for PFOS, and 'Milk and dairy products', 'Drinking water' and 'Fish and other seafood' for PFOA. PFOS and PFOA are readily absorbed in the gastrointestinal tract, excreted in urine and faeces, and do not undergo metabolism. Estimated human half-lives for PFOS and PFOA are about 5 years and 2-4 years, respectively. The derivation of a health-based guidance value was based on human epidemiological studies. For PFOS, the increase in serum total cholesterol in adults, and the decrease in antibody response at vaccination in children were identified as the critical effects. For PFOA, the increase in serum total cholesterol was the critical effect. Also reduced birth weight (for both compounds) and increased prevalence of high serum levels of the liver enzyme alanine aminotransferase (ALT) (for PFOA) were considered. After benchmark modelling of serum levels of PFOS and PFOA, and estimating the corresponding daily intakes, the CONTAM Panel established a tolerable weekly intake (TWI) of 13 ng/kg body weight (bw) per week for PFOS and 6 ng/kg bw per week for PFOA. For both compounds, exposure of a considerable proportion of the population exceeds the proposed TWIs.
Keywords: BMD; PBPK; PFOA; PFOS; exposure; food; risk assessment.
© 2018 European Food Safety Authority. EFSA Journal published by John Wiley and Sons Ltd on behalf of European Food Safety Authority.
Figures
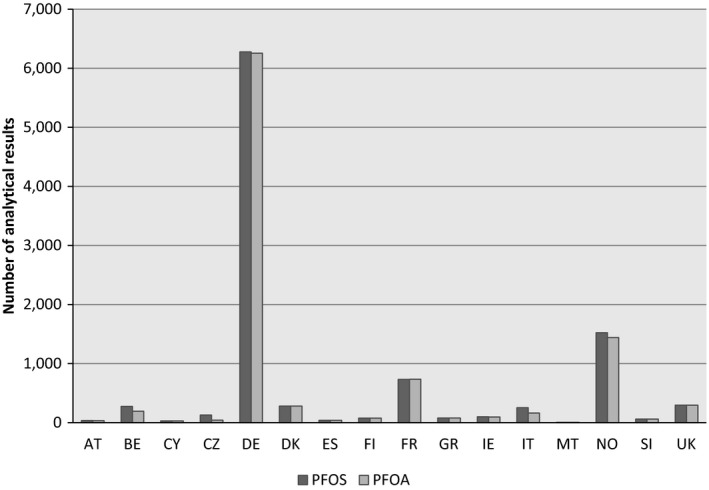
AT: Austria; BE: Belgium; CY: Cyprus; CZ: Czech Republic; DE: Germany; DK: Denmark; ES: Spain; FI: Finland; FR: France; GR: Greece; IE: Ireland; IT: Italy; MT: Malta; NO: Norway; SI: Slovenia; UK: United Kingdom; PFOA: perfluorooctanoic acid; PFOS: perfluorooctane sulfonic acid.
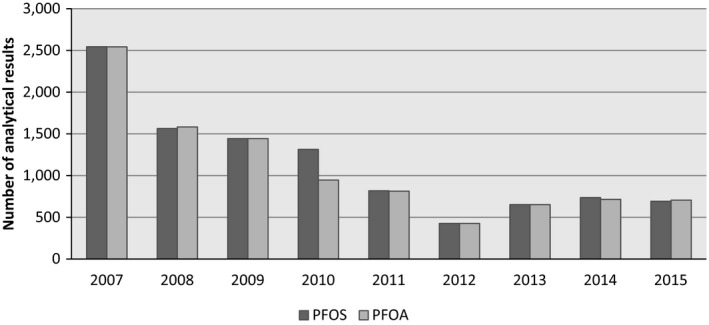
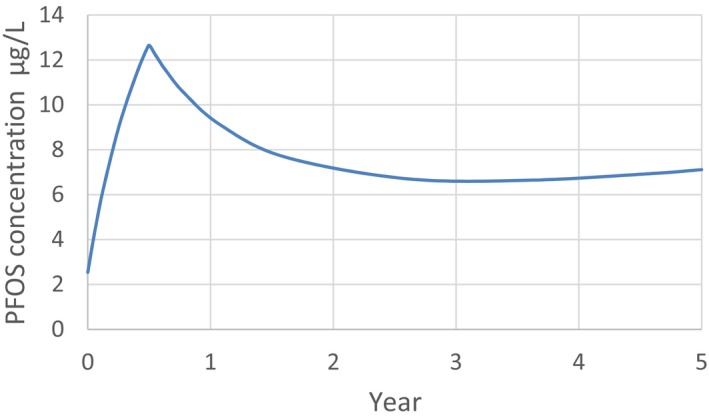
PFOA: perfluorooctanoic acid; PFOS: perfluorooctane sulfonic acid.
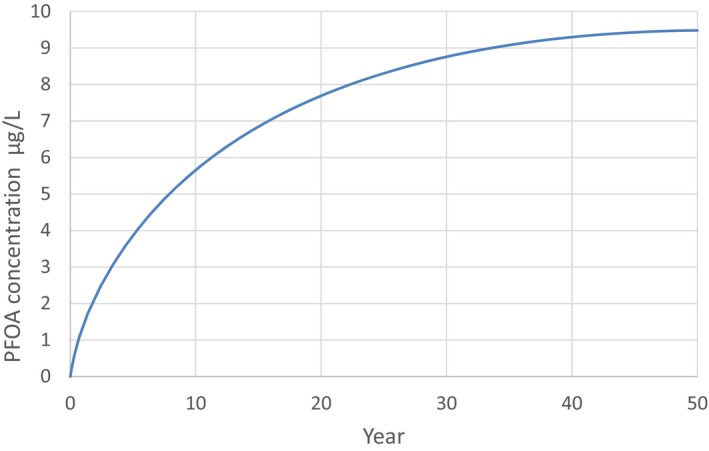
Estimations are from the PBPK model from Loccisano et al. (2011) (coded and simulated by Berkeley Madonna version 8.3.18).
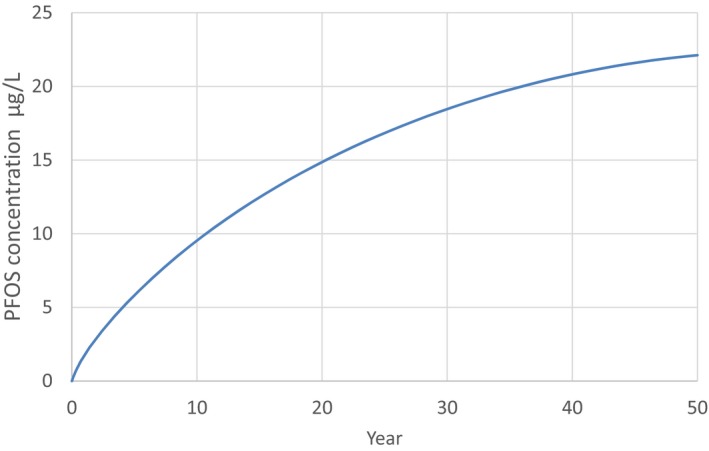
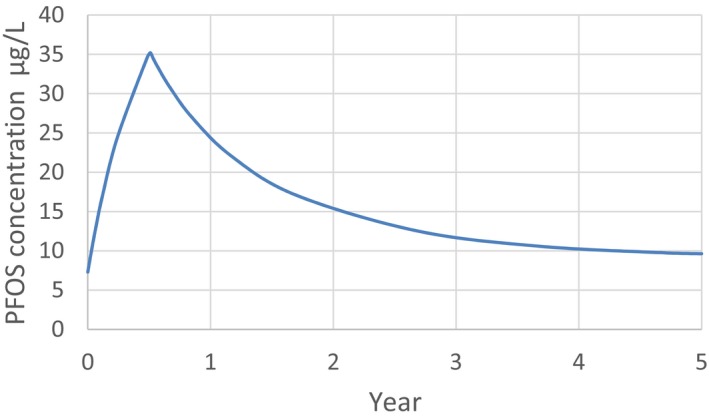
Estimations are from the PBPK model from Loccisano et al. (2011) (coded and simulated by Berkeley Madonna version 8.3.18).
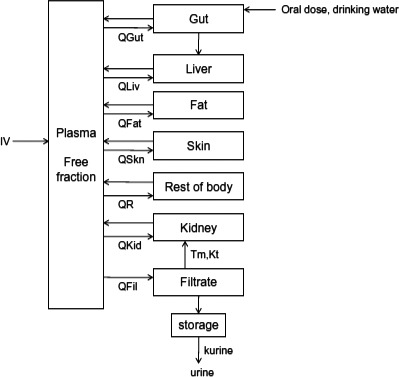
PBPK: physiologically based pharmacokinetic (model); Kt: affinity constant; PFOA: perfluorooctanoic acid; PFOS: perfluorooctane sulfonic acid; Qs: blood flows into and out of tissues – where Qfil is not a blood flow, but is a clearance (L/h) from the plasma to the filtrate compartment; Tm: Transporter maximum.
References
-
- 3M Company , 1999. Fluorochemical use, distribution and release overview. AR226‐0550.
-
- 3M Company , 2001. Analysis of PFOS, FOSA and PFOA From Various Food Matrices Using HPLC Electrospray Mass Spectrometry. Analytical Report, June 21, 2001.
-
- 3M Company , 2003. Environmental and Health Assessment of Perfuorooctane Sulfonic Acid and its Salts. Prepared by 3M in consultation with Moore, J., DABT, Hollyhouse, Inc. Rodricks, J., DABT, and Turnbull, D. DABT, Environ Corp. Warren‐Hicks, W. and colleagues, The Cadmus Group, Inc. August 20, 2003.
-
- Abbott BD, Wolf CJ, Schmid JE, Das KP, Zehr RD, Helfant L, Nakayama S, Lindstrom AB, Strynar MJ and Lau C, 2007. Perfluorooctanoic acid induced developmental toxicity in the mouse is dependent on expression of peroxisome proliferator activated receptor‐alpha. Toxicological Sciences, 98, 571–581. - PubMed
-
- Abbott BD, Wood CR, Watkins AM, Tatum‐Gibbs K, Das KP and Lau C, 2012. Effects of perfluorooctanoic acid (PFOA) on expression of peroxisome proliferator‐activated receptors (PPAR) and nuclear receptor‐regulated genes in fetal and postnatal CD‐1 mouse tissues. Reproductive Toxicology, 33, 491–505. 10.1016/j.reprotox.2011.11.005 - DOI - PubMed
LinkOut - more resources
Full Text Sources