

The European Union summary report on trends and sources of zoonoses, zoonotic agents and food-borne outbreaks in 2017
- PMID: 32625785
- PMCID: PMC7009540
- DOI: 10.2903/j.efsa.2018.5500
The European Union summary report on trends and sources of zoonoses, zoonotic agents and food-borne outbreaks in 2017
Abstract
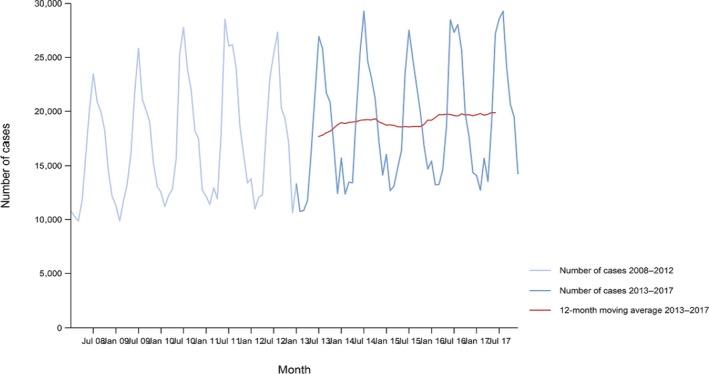
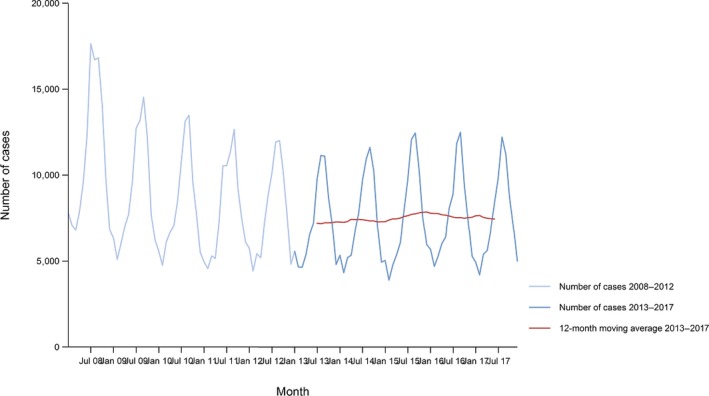
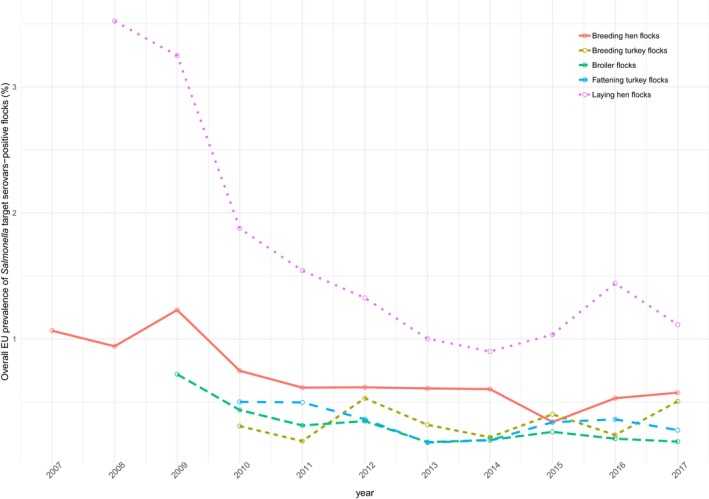
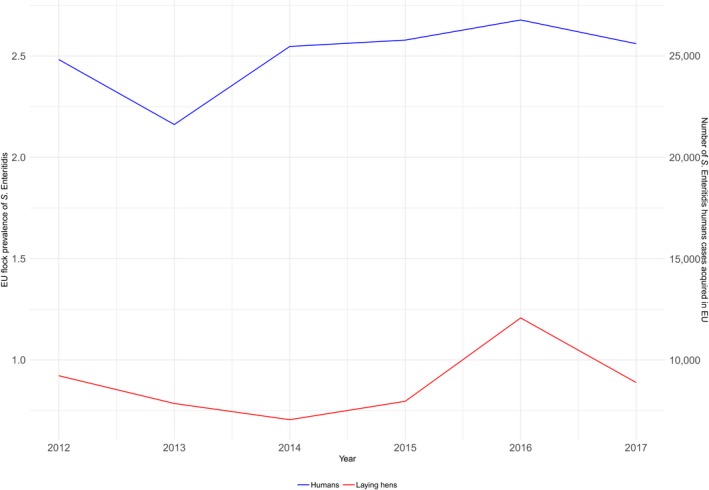
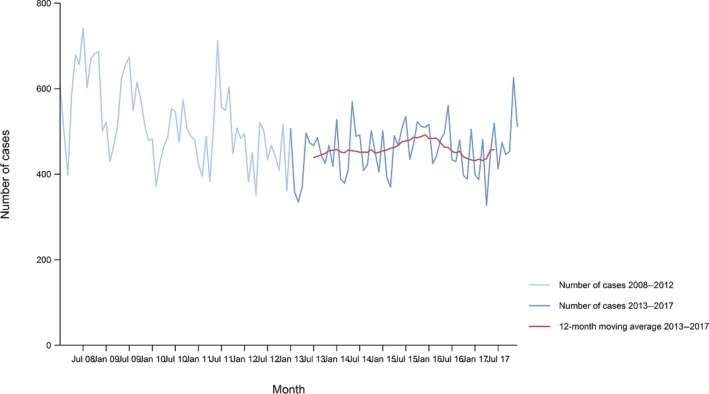
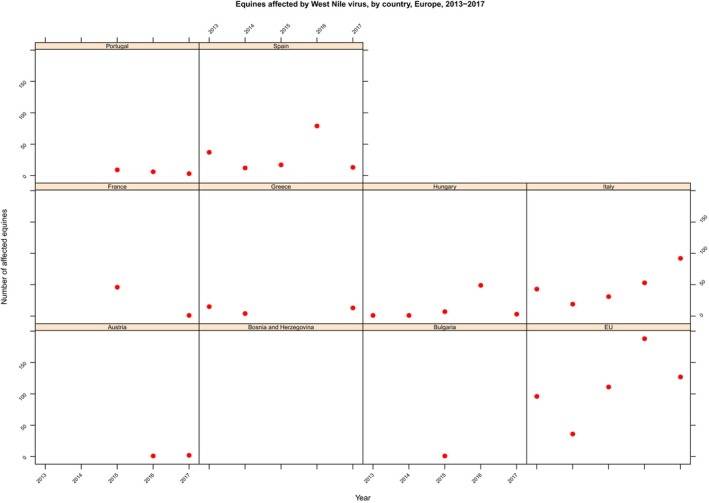
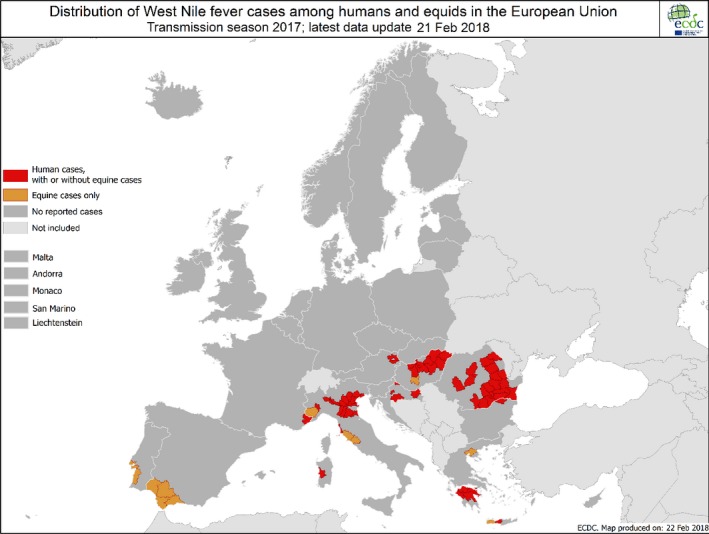
This report of the European Food Safety Authority and the European Centre for Disease Prevention and Control presents the results of zoonoses monitoring activities carried out in 2017 in 37 European countries (28 Member States (MS) and nine non-MS). Campylobacteriosis was the commonest reported zoonosis and its EU trend for confirmed human cases increasing since 2008 stabilised during 2013-2017. The decreasing EU trend for confirmed human salmonellosis cases since 2008 ended during 2013-2017, and the proportion of human Salmonella Enteritidis cases increased, mostly due to one MS starting to report serotype data. Sixteen MS met all Salmonella reduction targets for poultry, whereas 12 MS failed meeting at least one. The EU flock prevalence of target Salmonella serovars in breeding hens, laying hens, broilers and fattening turkeys decreased or remained stable compared to 2016, and slightly increased in breeding turkeys. Salmonella results on pig carcases and target Salmonella serovar results for poultry from competent authorities tended to be generally higher compared to those from food business operators. The notification rate of human listeriosis further increased in 2017, despite Listeria seldom exceeding the EU food safety limit in ready-to-eat food. The decreasing EU trend for confirmed yersiniosis cases since 2008 stabilised during 2013-2017. The number of confirmed shiga toxin-producing Escherichia coli (STEC) infections in humans was stable. A total of 5,079 food-borne (including waterborne) outbreaks were reported. Salmonella was the commonest detected agent with S. Enteritidis causing one out of seven outbreaks, followed by other bacteria, bacterial toxins and viruses. The agent was unknown in 37.6% of all outbreaks. Salmonella in eggs and Salmonella in meat and meat products were the highest risk agent/food pairs. The report further summarises trends and sources for bovine tuberculosis, Brucella, Trichinella, Echinococcus, Toxoplasma, rabies, Coxiella burnetii (Q fever), West Nile virus and tularaemia.
Keywords: Campylobacter; Listeria; Salmonella; food‐borne outbreaks; monitoring; parasites; zoonoses.
© 2018 European Food Safety Authority and European Centre for Disease Prevention and Control. EFSA Journal published by John Wiley and Sons Ltd on behalf of European Food Safety Authority.
Figures
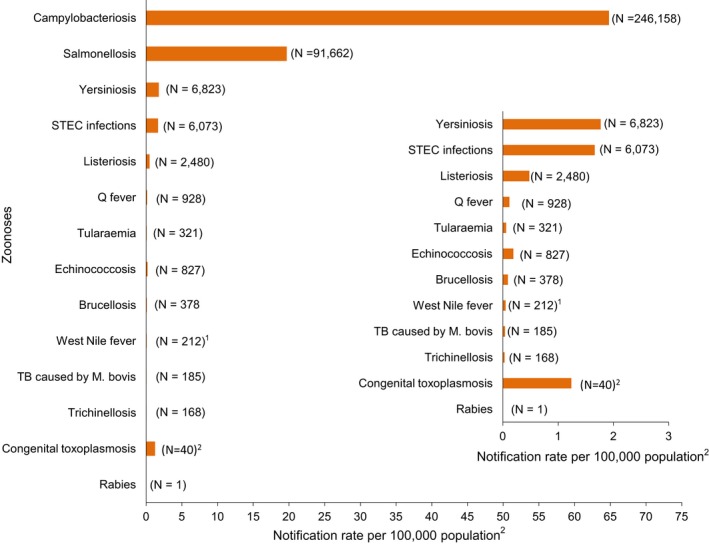
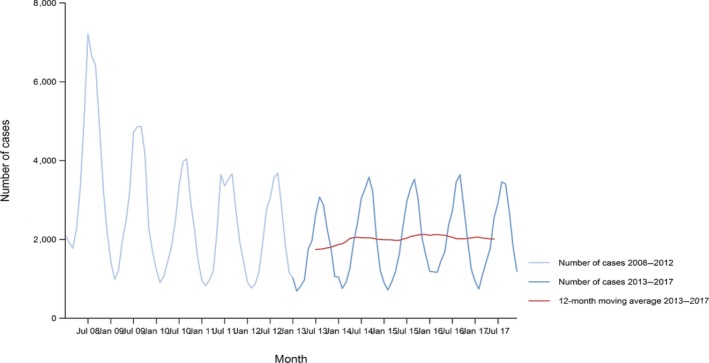
Note: Total number of confirmed cases is indicated in parenthesis at the end of each bar.
1Exception: West Nile fever where total number of cases were used.
2Exception: congenital toxoplasmosis notification rate per 100,000 live births.
Source(s): Austria, Cyprus, Czech Republic, Denmark, Estonia, Finland, France, Germany, Hungary, Iceland, Ireland, Italy, Latvia, Lithuania, Luxembourg, Malta, Netherlands, Norway, Poland, Romania, Slovakia, Slovenia, Spain, Sweden and United Kingdom. Belgium, Bulgaria, Croatia and Portugal did not report data to the level of detail required for the analysis. In Greece, campylobacteriosis is not under surveillance.
Source: Austria, Belgium, Cyprus, Czech Republic, Denmark, Estonia, Finland, France, Germany, Greece, Hungary, Iceland, Ireland, Italy, Lithuania, Luxembourg, Latvia, Malta, Netherlands, Norway, Poland, Portugal, Romania, Slovakia, Slovenia, Spain, Sweden and United Kingdom. Bulgaria and Croatia did not report data to the level of detail required for the analysis.
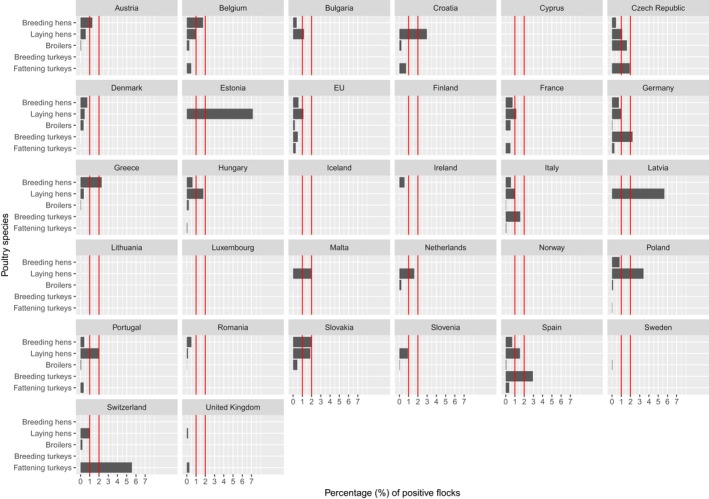
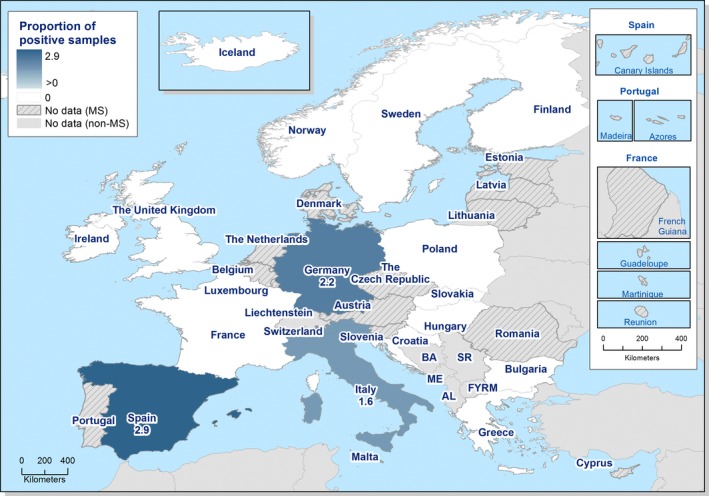
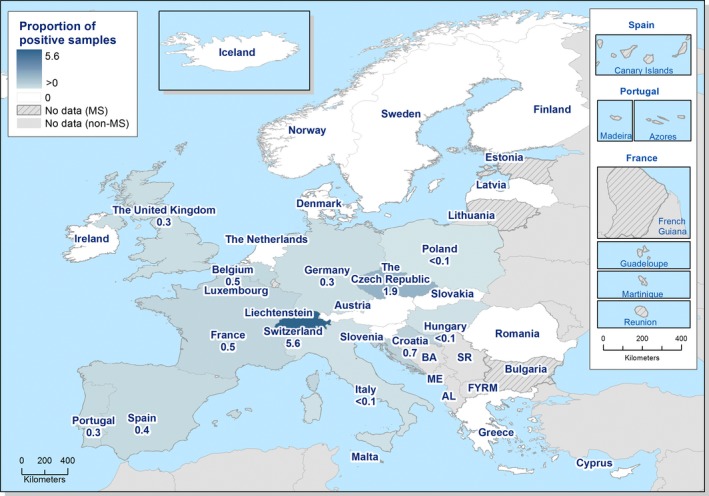
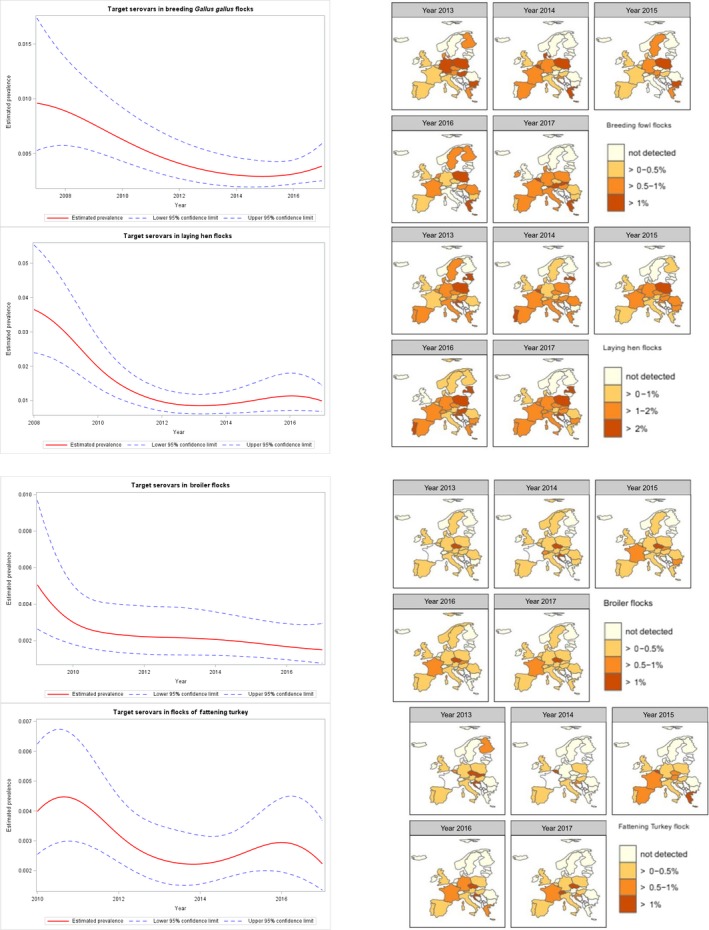
Red vertical bars indicate the target to be reached, which was fixed at 1% for all categories with the exception of laying hens where it was 2% for all MS with the exception of Poland, for which it was 2.5%.
AL: Albania; BA: Bosnia and Herzegovina; FYRM: the Former Yugoslav Republic of Macedonia; ME: Montenegro; SR: Serbia.
AL: Albania; BA: Bosnia and Herzegovina; FYRM: the Former Yugoslav Republic of Macedonia; ME: Montenegro; SR: Serbia.
AL: Albania; BA: Bosnia and Herzegovina; FYRM: the Former Yugoslav Republic of Macedonia; ME: Montenegro; SR: Serbia.
AL: Albania; BA: Bosnia and Herzegovina; FYRM: the Former Yugoslav Republic of Macedonia; ME: Montenegro; SR: Serbia.
AL: Albania; BA: Bosnia and Herzegovina; FYRM: the Former Yugoslav Republic of Macedonia; ME: Montenegro; SR: Serbia.
AL: Albania; BA: Bosnia and Herzegovina; FYRM: the Former Yugoslav Republic of Macedonia; ME: Montenegro; SR: Serbia.
AL: Albania; BA: Bosnia and Herzegovina; FYRM: the Former Yugoslav Republic of Macedonia; ME: Montenegro; SR: Serbia.
AL: Albania; BA: Bosnia and Herzegovina; FYRM: the Former Yugoslav Republic of Macedonia; ME: Montenegro; SR: Serbia.
AL: Albania; BA: Bosnia and Herzegovina; FYRM: the Former Yugoslav Republic of Macedonia; ME: Montenegro; SR: Serbia.
Source(s): Czech Republic, Denmark, Estonia, Finland, France, Germany, Greece, Hungary, Iceland, Ireland, Italy, Latvia, Malta, Netherlands, Norway, Portugal, Slovakia, Spain, Sweden and United Kingdom. Austria, Belgium, Bulgaria, Cyprus, Croatia, Lithuania, Luxembourg, Poland, Romania and Slovenia did not report data to the level of detail required for the analysis.
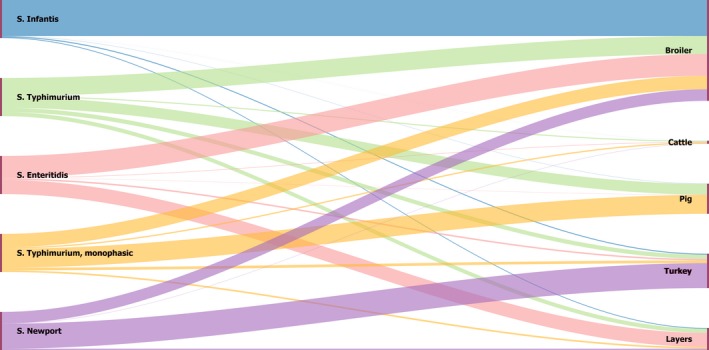
The left side of the diagram shows the five commonest reported Salmonella serovars from human salmonellosis cases acquired in the EU: S. Infantis (blue), S. Typhimurium (green), S. Enteritidis (pink), monophasic S. Typhimurium (yellow) and S. Newport (violet). Animal and food data from the same source were merged: ‘broiler’ includes isolates from broiler flocks and broiler meat, ‘cattle’ includes isolates from bovines for meat production and bovine meat, ‘pig’ includes isolates from fattening pigs and pig meat, ‘turkey’ includes isolates from fattening turkey flocks and turkey meat and ‘layers’ includes laying hen flocks and eggs. The right side shows the five sources considered (broiler, cattle, pig, turkey and layers). The width of the coloured bands linking sources and serovars is proportional to the percentage of isolation of each serovar from each source.
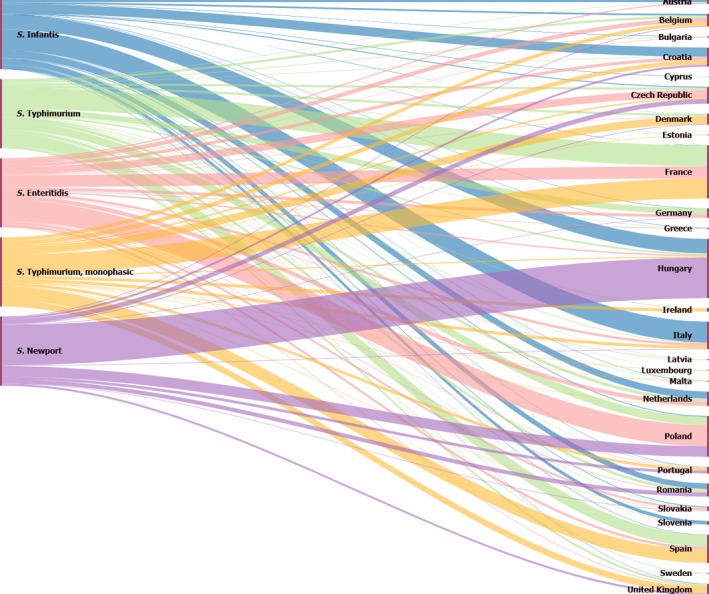
The left side of the diagram shows the five commonest reported Salmonella serovars from human salmonellosis cases acquired in the EU: S. Infantis (blue), S. Typhimurium (green), S. Enteritidis (pink), monophasic S. Typhimurium (yellow) and S. Newport (violet). The right side shows the reporting Member States. The width of the coloured bands linking Member States and serovars is proportional to the percentage of isolation of each serovar reported from each MS.
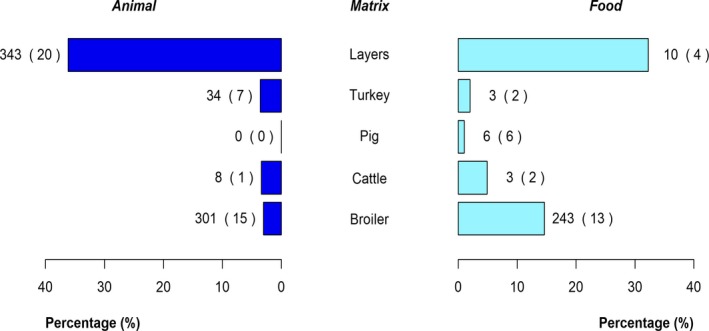
The percentages were calculated on the total number of isolates serotyped for each animal and food category. The values at the side of each bar are the number of S. Enteritidis isolates and the number in parentheses indicates the number of reporting Member States.

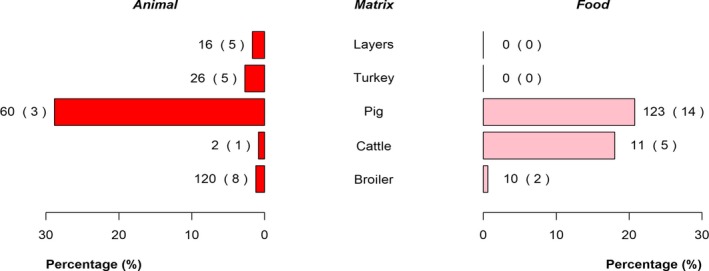
The percentages were calculated on the total number of isolates serotyped for each animal and food category. The values at the side of each bar are the number of S. Typhimurium isolates and the number in parentheses indicates the number of reporting Member States.
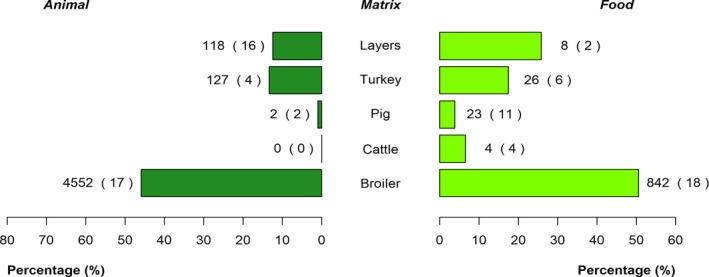
The percentages were calculated on the total number of isolates serotyped for each animal and food category. The values at the side of each bar are the number of isolates of monophasic variants of S. Typhimurium and the number in parentheses indicates the number of reporting Member States.
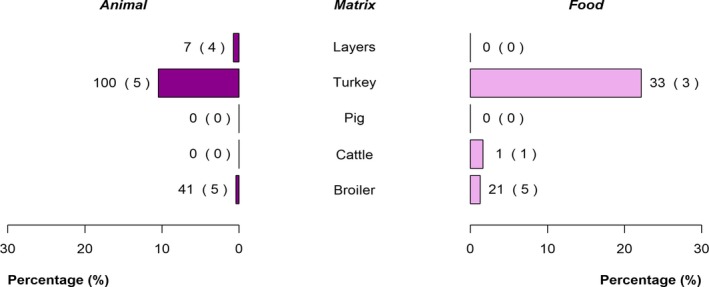
The percentages were calculated on the total number of isolates serotyped for each animal and food category. The values at the side of each bar are the number of S. Infantis isolates and the number in parentheses indicates the number of reporting Member States.
The percentages were calculated on the total number of isolates serotyped for each animal and food category. The values at the side of each bar are the number of S. Newport isolates and the number in parentheses indicates the number of reporting Member States.
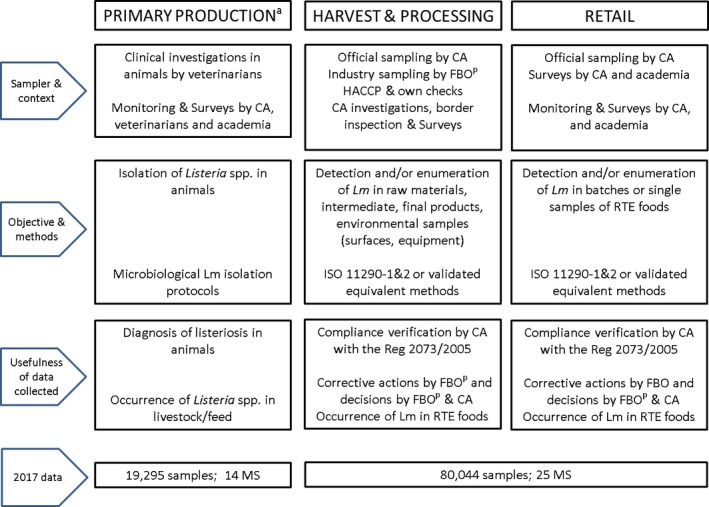
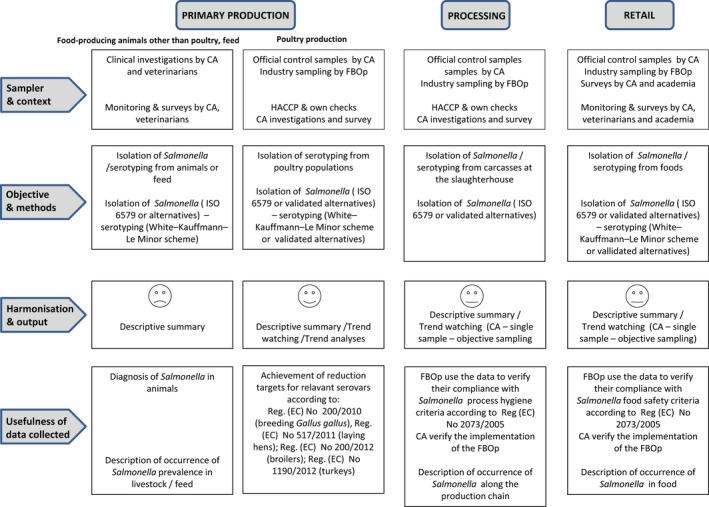
CA: competent authorities; FBOp: food business operator; RTE: ready‐to‐eat; Lm: Listeria monocytogenes.
(a): Primary production sector: samples from animals and feed.
(b): Less than 0.3% of samples correspond to sampling carried out by industry.
Source: Austria, Belgium, Cyprus, Czech Republic, Denmark, Estonia, Finland, France, Germany, Greece, Hungary, Iceland, Ireland, Italy, Latvia, Lithuania, Malta, Netherlands, Norway, Poland, Romania, Slovakia, Slovenia, Spain, Sweden and United Kingdom. Bulgaria, Croatia, Luxembourg and Portugal did not report data to the level of detail required for the analysis.
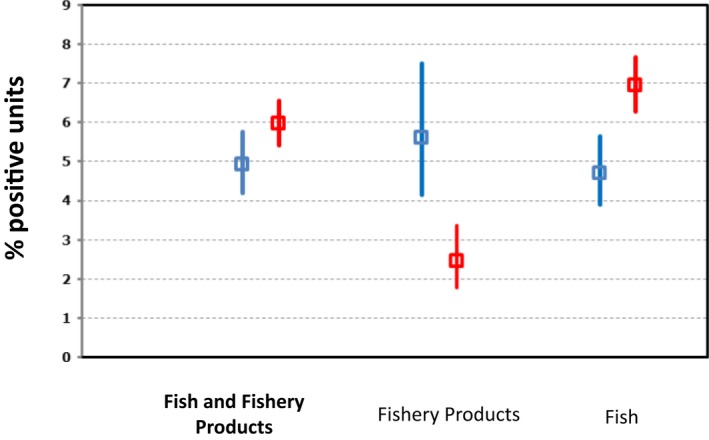
Only data obtained from detection method are included.
‘Fish, RTE’ includes data on ‘Fish’ of the following types: ‘chilled’, ‘cooked’, ‘gravad/slightly salted’, ‘marinated’ and ‘smoked (hot‐ and cold‐smoked)’.
‘Fishery products, RTE’ includes the following types: ‘prawns, cooked’, ‘prawns‐shelled, shucked and cooked’, ‘shrimps, cooked’, ‘shrimps, shelled, shucked and cooked’, ‘crustaceans, unspecified, cooked’, ‘crustaceans, unspecified, shelled, shucked and cooked’, ‘molluscan shellfish, cooked’, ‘unspecified’ (cooked, ready‐to‐eat, smoked) and ‘Surimi’.
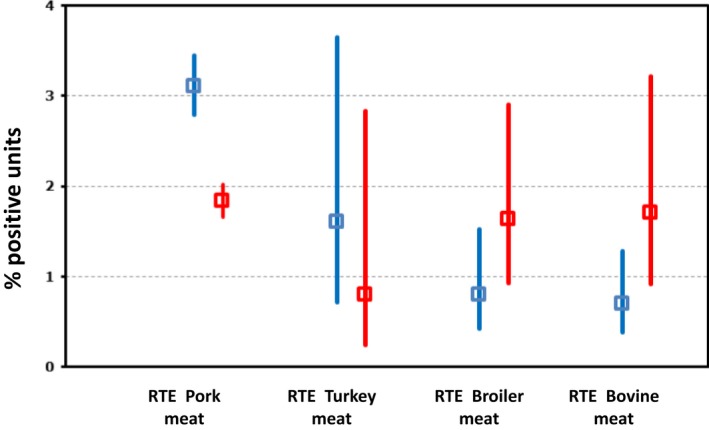
Only data obtained from detection method are included.
RTE pig meat products include ‘Meat from pig, meat products’ of the following types: ‘cooked ham (sliced or non‐sliced)’, ‘cooked, RTE’, ‘fermented sausages’, ‘fresh raw sausages’, ‘meat specialities’, ‘pâté’, ‘raw and intended to be eaten raw’, ‘raw ham’, ‘unspecified, ready‐to‐eat’. ‘RTE turkey meat’ includes turkey ‘meat products’ of the following types: ‘cooked, RTE’, ‘preserved’ and ‘raw and intended to be eaten raw’. ‘RTE broiler meat’ broiler ‘meat products’ of the following types: ‘cooked, RTE’ and ‘cooked, RTE, chilled’. ‘RTE bovine meat’ includes ‘Meat from bovine animals, meat products’ of the following types: ‘cooked, RTE’, ‘cooked, RTE, chilled’, ‘fermented sausages’, ‘raw and intended to be eaten raw’, ‘unspecified, RTE’.
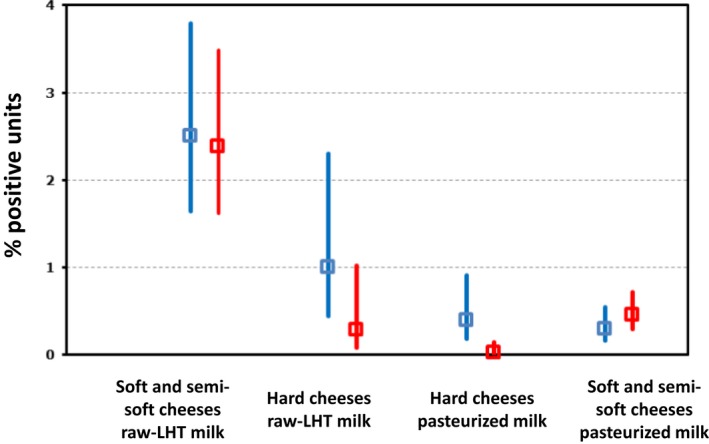
LHT: low‐heat‐treated. ‘Overall’ and the number of MS correspond to data across all sampling stages (‘retail’ and ‘processing’ + ‘farm’ + ‘border inspection activities’ + ‘unspecified’).For each sampling stage (‘overall’, ‘retail’ and ‘processing’), data are pooled across both types of sampling units (‘single’ and ‘batch’). Soft and semi‐soft cheeses as well as hard cheeses include all cheeses for which Level 2 at matrix level was specified (‘fresh’ or ‘soft’ or ‘semi‐soft’ or ‘hard’).
Source: Austria, Cyprus, Denmark, Estonia, Finland, France, Germany, Greece, Hungary, Iceland, Ireland, Italy, Latvia, Lithuania, Luxembourg, Malta, Netherlands, Norway, Poland, Romania, Slovakia, Slovenia, Spain, Sweden and United Kingdom. Belgium, Bulgaria, Czech Republic, Croatia and Portugal did not report data to the level of detail required for the analysis.
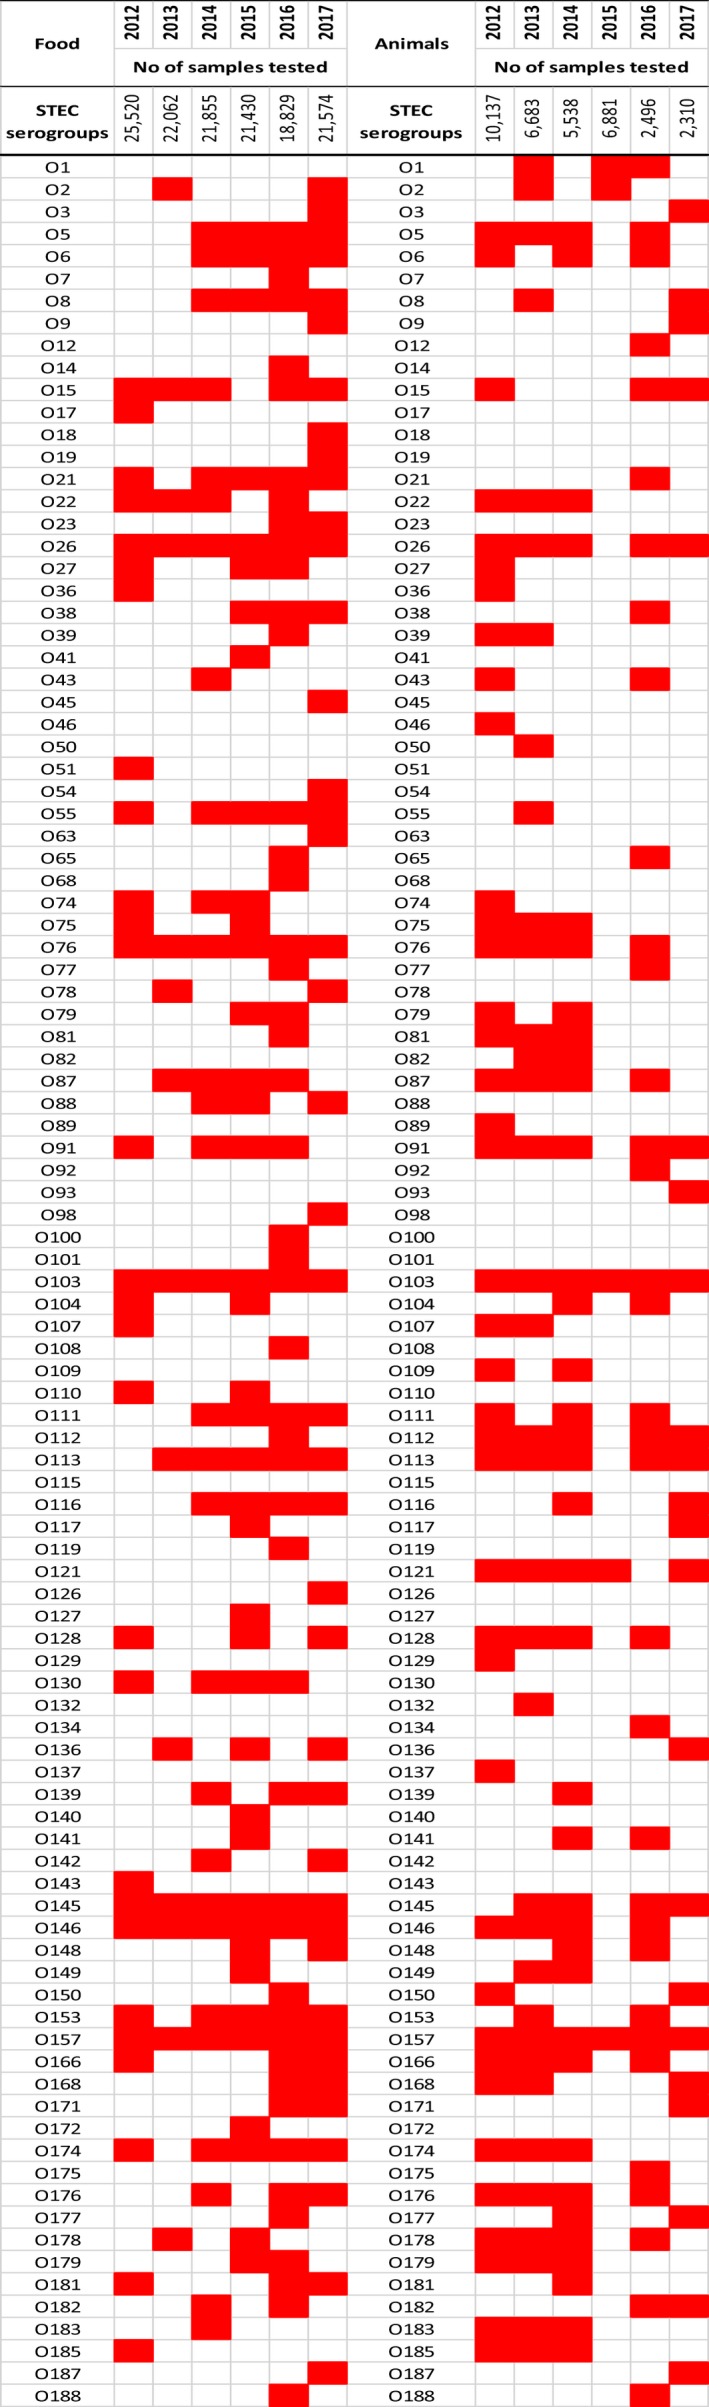
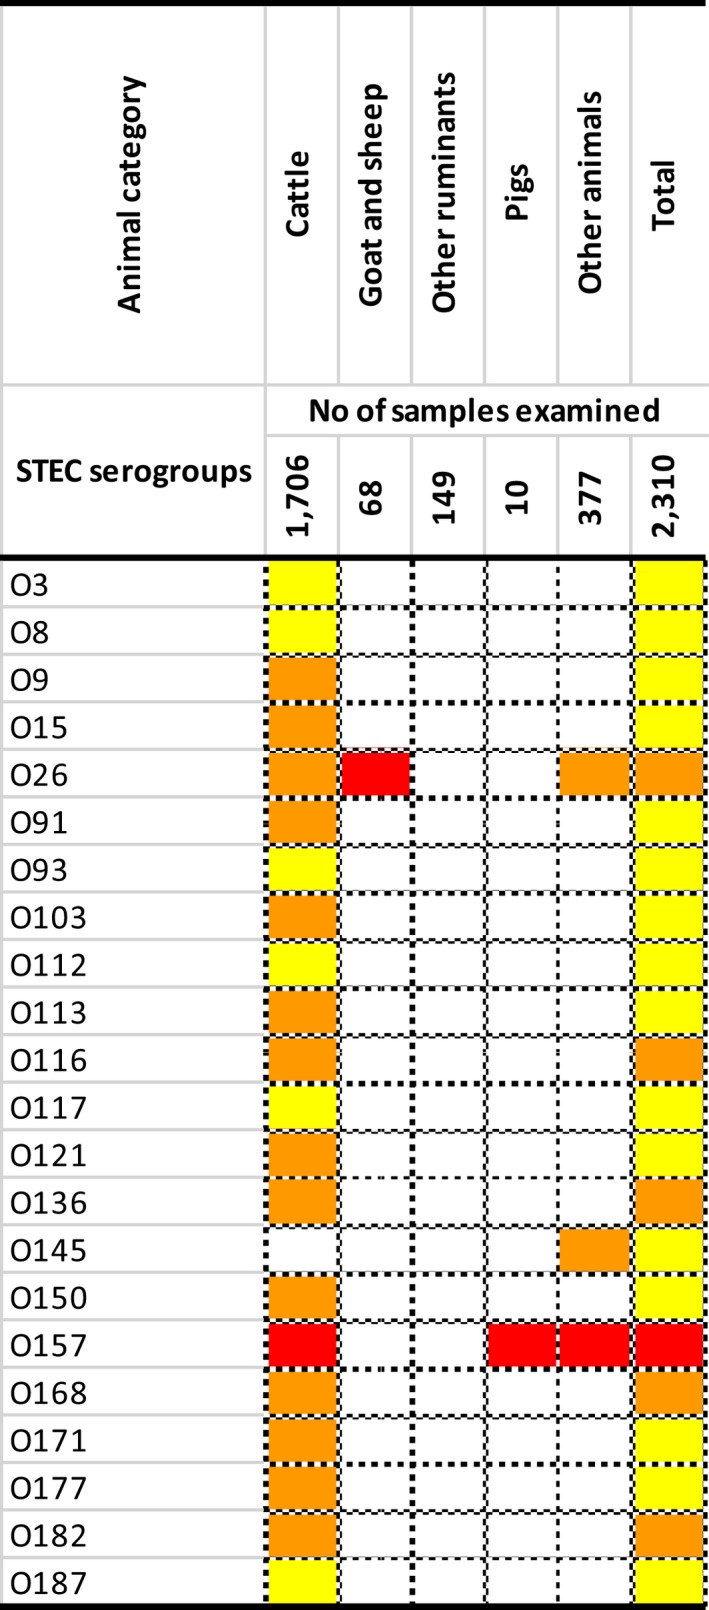
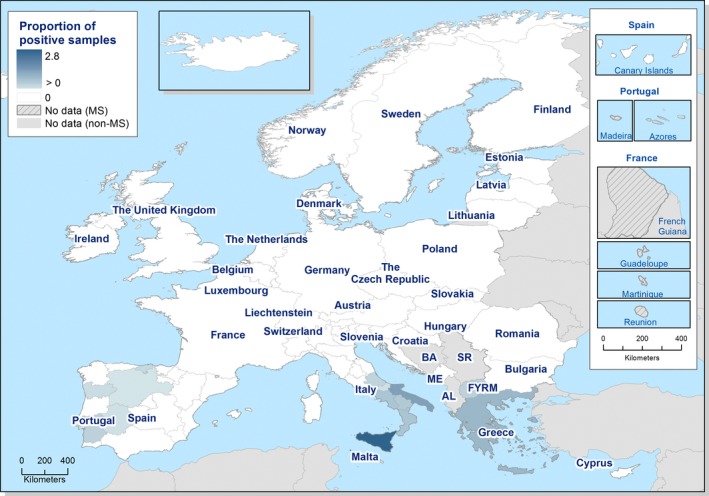
Note: The presence (red boxes) and absence (white boxes) of STEC serogroups in food (left) and animals (right). The E. coli O104:H4 stx2+ eae‐ was isolated from sprouted seeds in 2015. No information was provided on the H type and genotype of the E. coli O104 strains isolated from food in 2012.
Proportions of STEC serogroups: red boxes > 1%, orange boxes > 0.1% and ≤ 1%, yellow boxes > 0.0001% and ≤ 0.1% of positive samples. White boxes indicate absence of the serogroup.
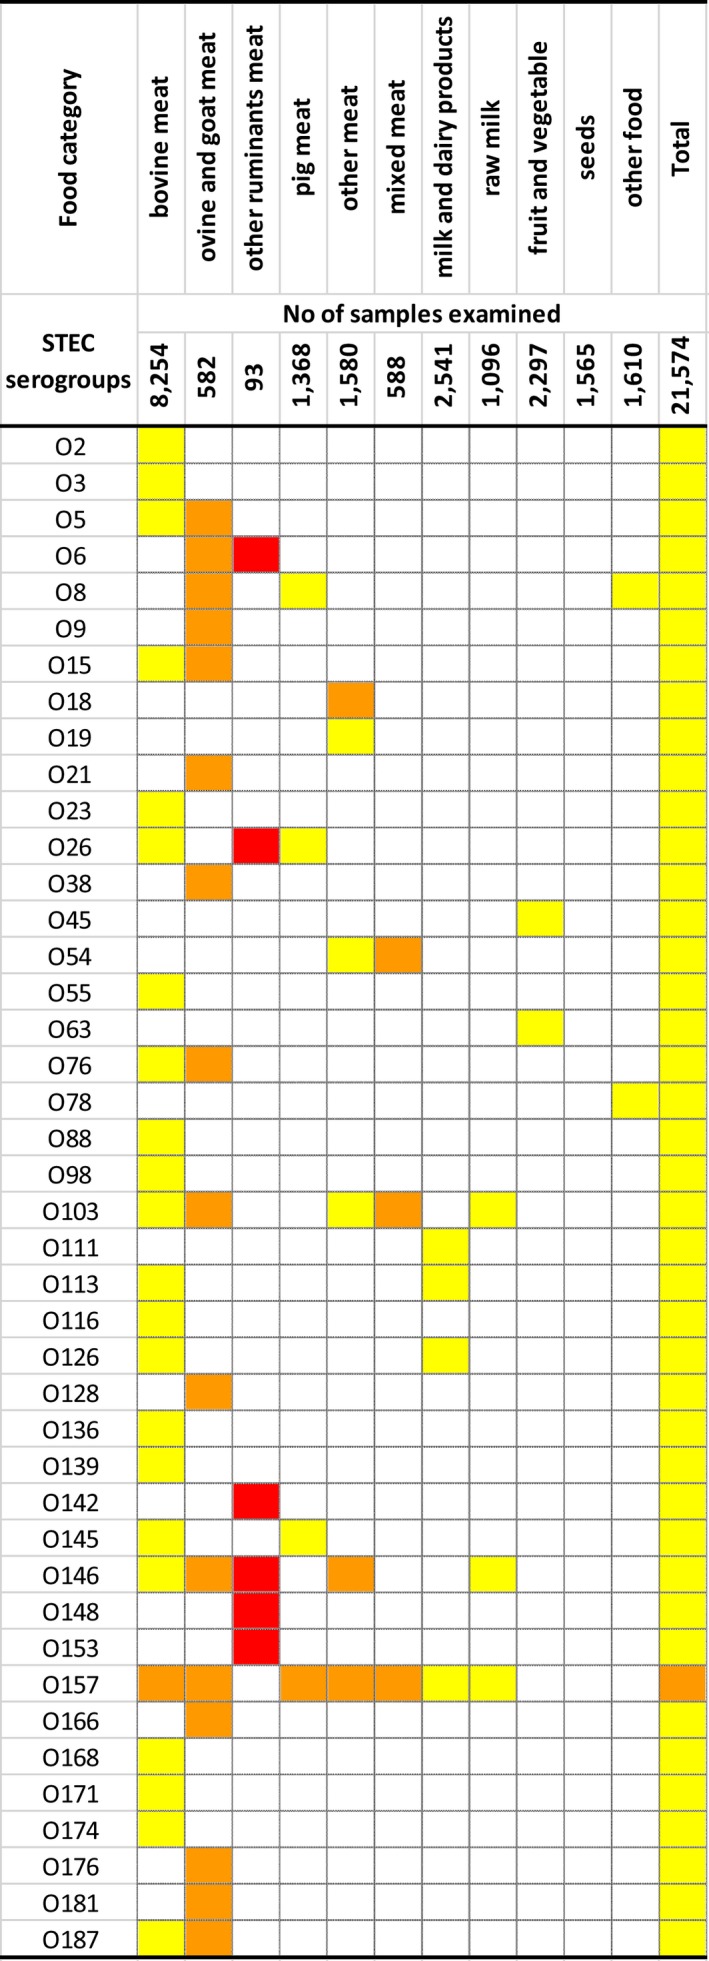
Other ruminants’ meat includes meat from deer.
Other meat includes meat from animals other than ruminants.
Milk and dairy products include any type of dairy product, cheese and milk other than raw milk.
Raw milk includes raw milk from different species, but most of the tested and all the positive samples were from cows.
Seeds category includes mostly sprouted seeds, but dry seeds are also included.
Sources: 25 Member States.
Proportions of STEC serogroups: red boxes > 1%, orange boxes > 0.1% and ≤ 1%, yellow boxes > 0.0001% and ≤ 0.1% of positive samples. White boxes indicate absence of the serogroup.
The animal category ‘other ruminants’ includes deer. The ‘other animal’ category comprises birds, Cantabrian chamois, cats, chinchillas, dogs, ferrets, gallus, gerbils, hedgehogs, monkeys, rabbits, solipeds, water buffalos, wild boar and wolves.
Sources: Eight Member States.
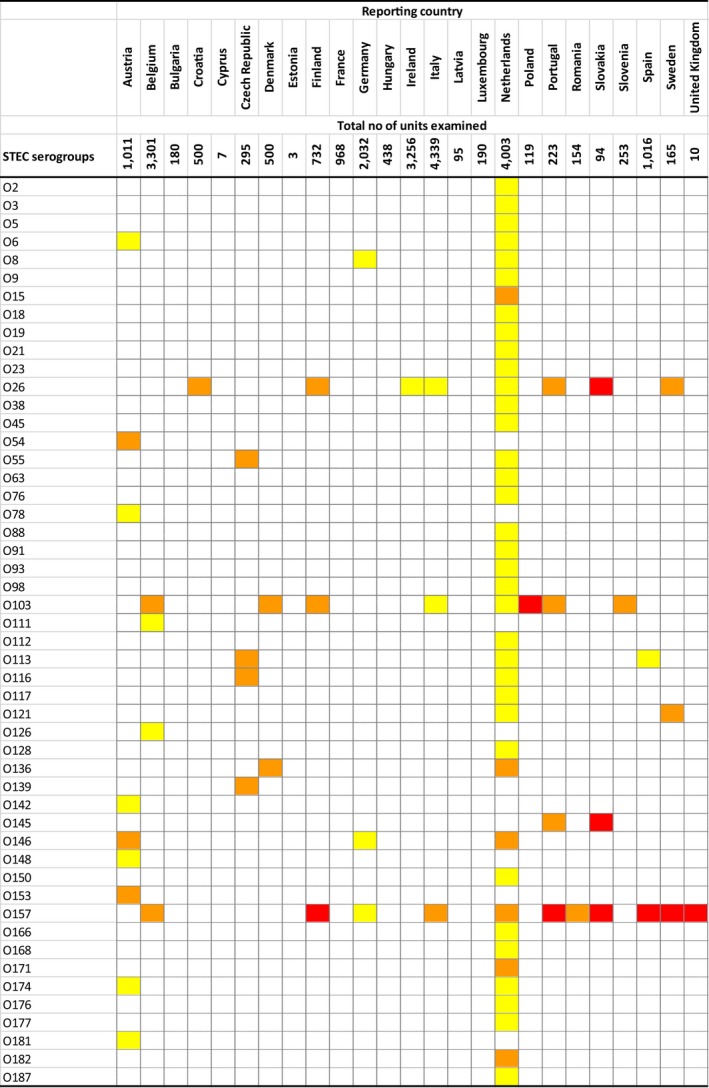
Proportions of STEC serogroups: red boxes > 1%, orange boxes > 0.1% and ≤ 1%, yellow boxes > 0.0001% and ≤ 0.1% of positive samples. White boxes indicate absence of the serogroup.
Includes data from both animals and food samples.
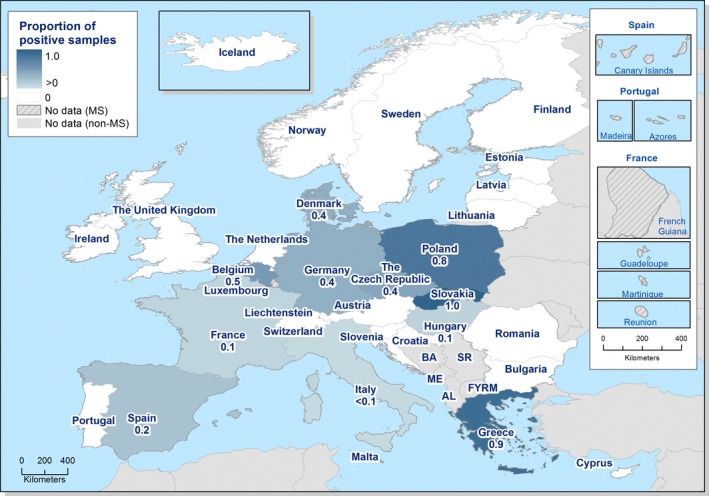
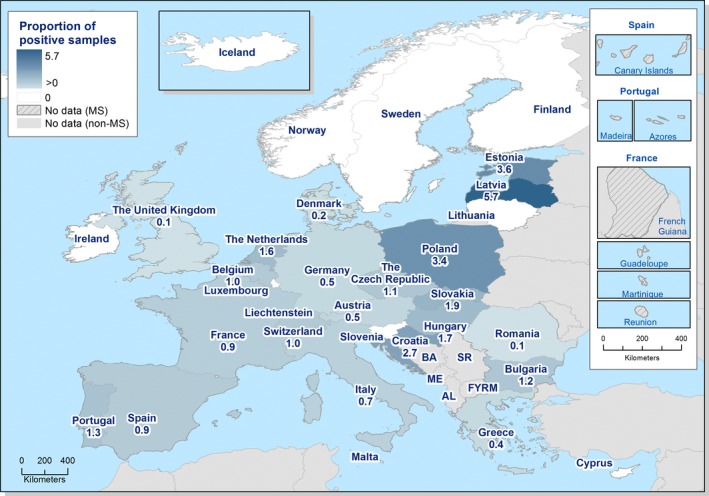
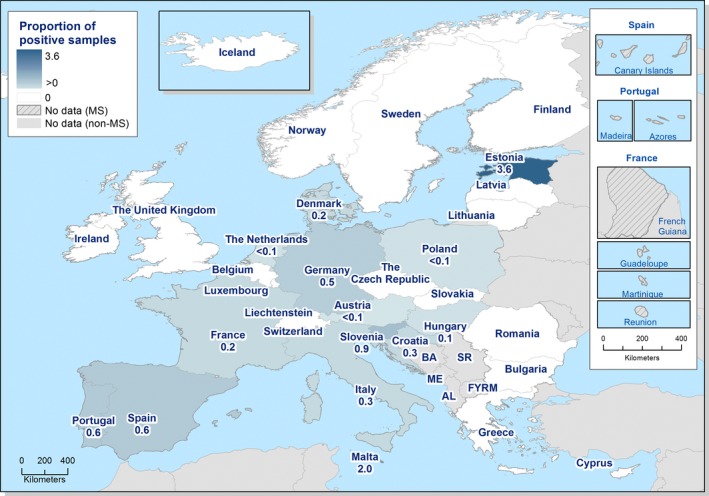
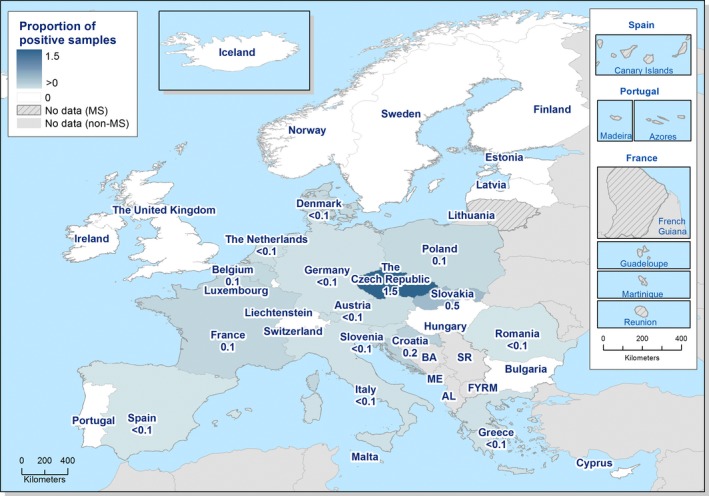
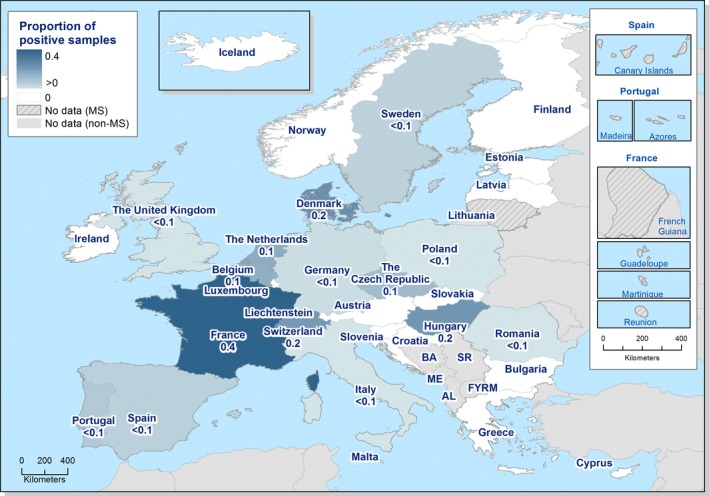
Source(s): Austria, Cyprus, Czech Republic, Denmark, Estonia, Finland, Germany, Hungary, Iceland, Ireland, Latvia, Lithuania, Luxembourg, Malta, Norway, Poland, Romania Slovakia, Slovenia, Spain, Sweden and United Kingdom. Belgium, Bulgaria, Croatia, France, Italy and Portugal did not report data to the level of detail required for the analysis. Greece and the Netherlands do not have any formal surveillance system for the disease.
No human data were obtained from France, Albania, Bosnia and Herzegovina, Former Yugoslav Republic of Macedonia, Montenegro and Serbia.
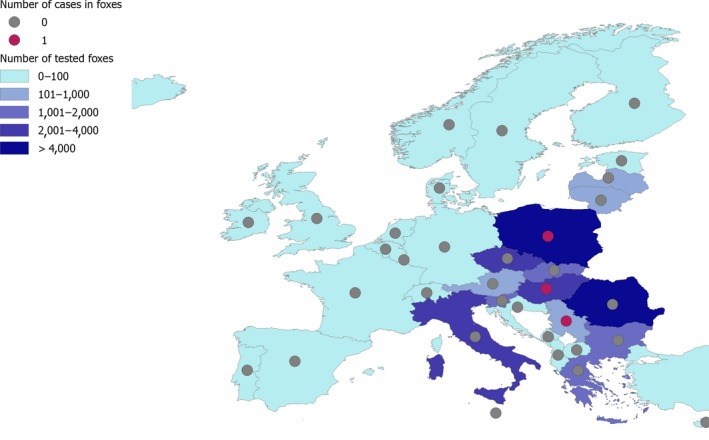
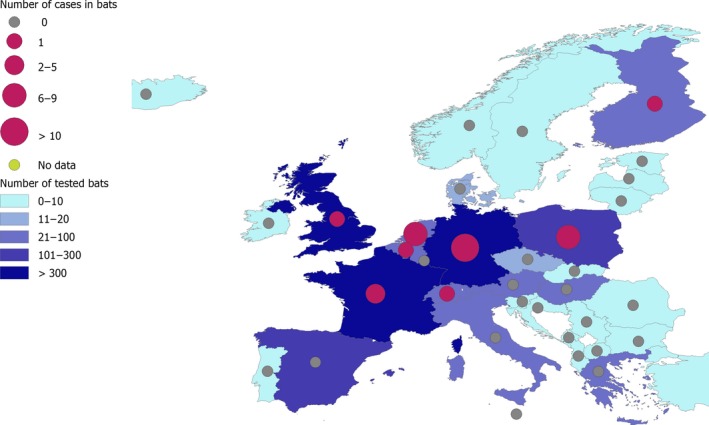
AL: Albania; BA: Bosnia and Herzegovina; FYRM: Former Yugoslav Republic of Macedonia; ME: Montenegro; SR, Serbia.
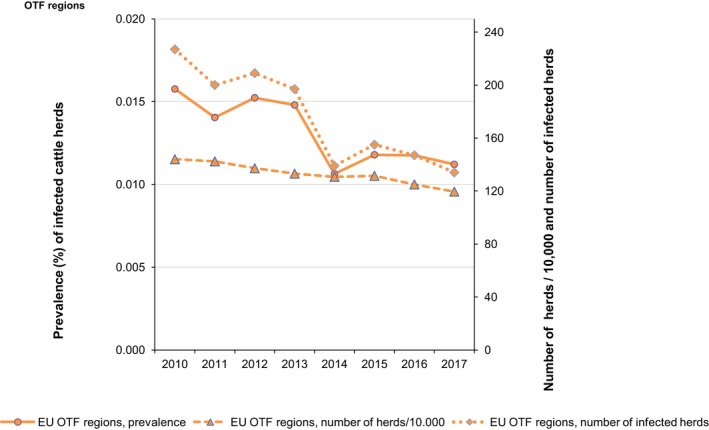
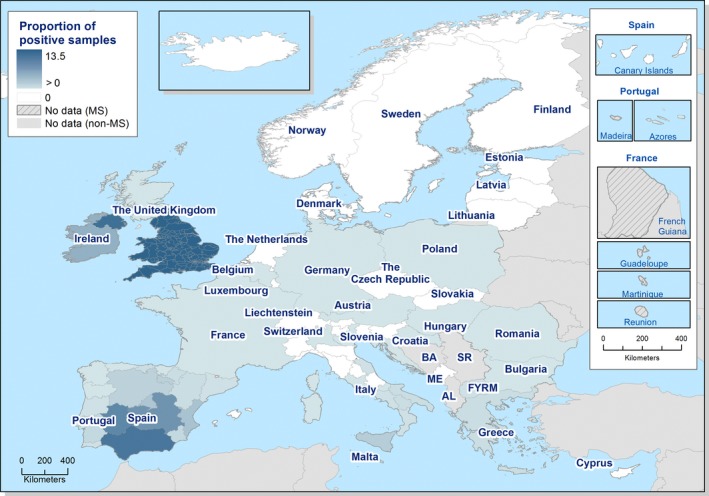
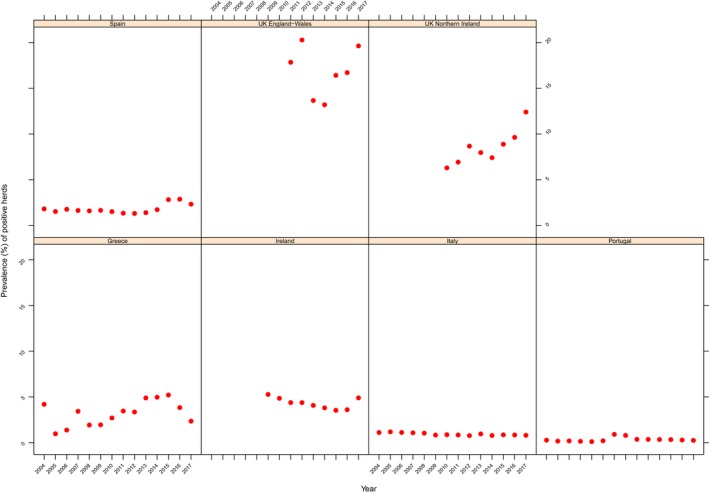
OTF: Officially bovine tuberculosis free in cattle.
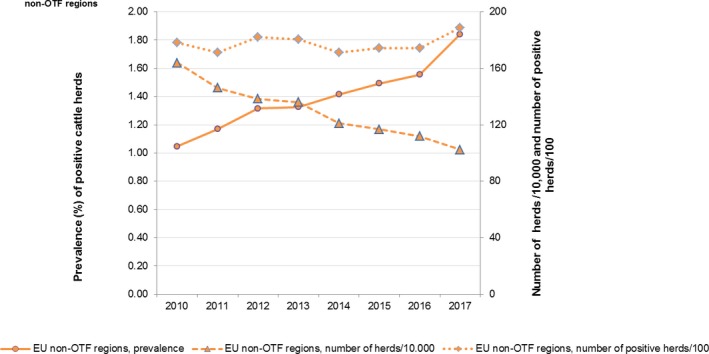
OTF: Officially bovine tuberculosis free in cattle.
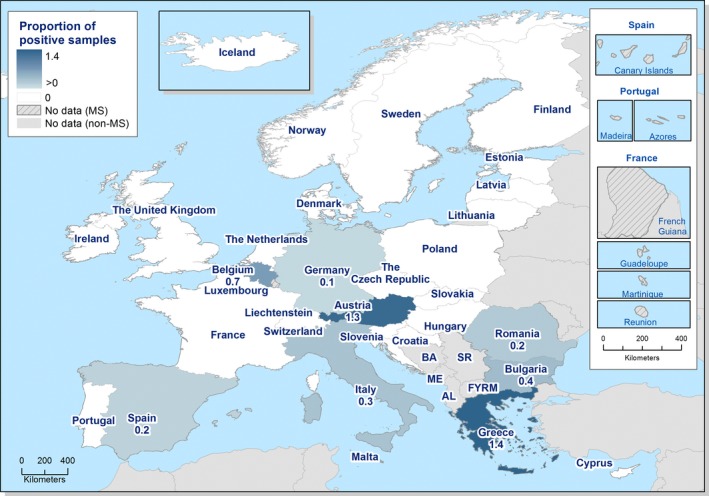
Source: Austria, Cyprus, Czech Republic, Estonia, Finland, France, Germany, Greece, Hungary, Iceland, Ireland, Italy, Latvia, Lithuania, Malta, Netherlands, Norway, Poland, Portugal, Romania, Slovakia, Slovenia, Spain and Sweden. Belgium, Bulgaria, Croatia, Luxembourg and the United Kingdom did not report data to the level of detail required for the analysis. Denmark does not have a surveillance system for this disease.
AL: Albania; BA: Bosnia and Herzegovina; FYRM: Former Yugoslav Republic of Macedonia; ME: Montenegro; SR, Serbia.
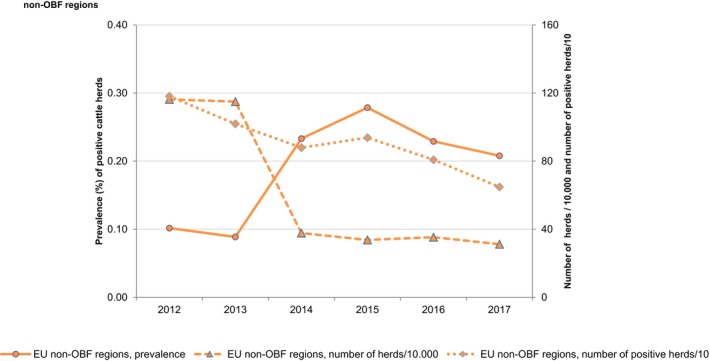
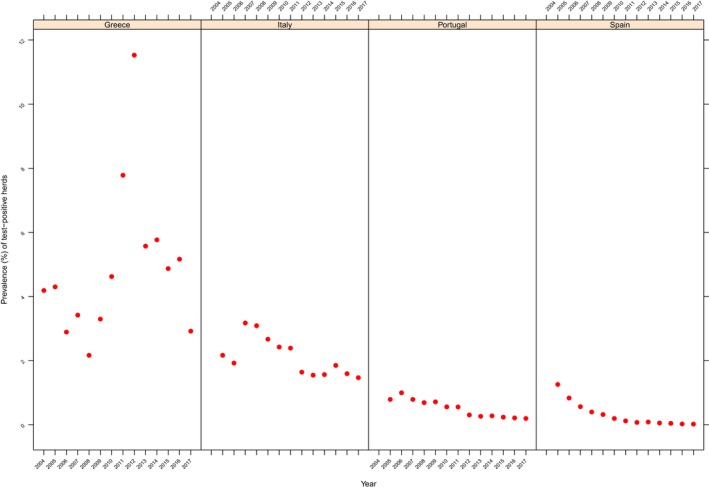
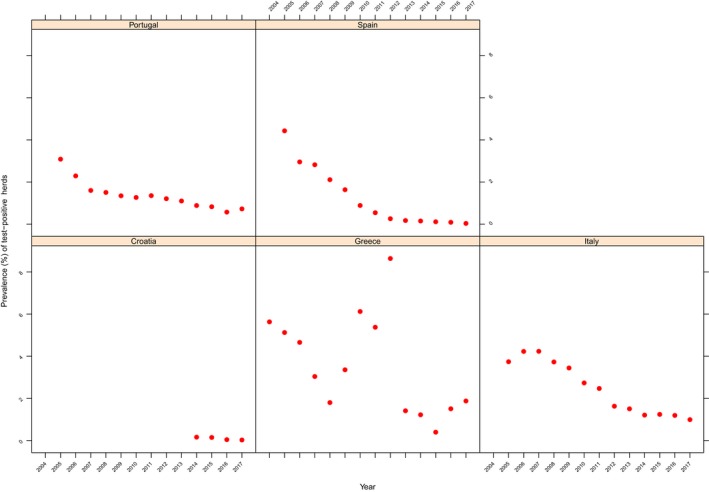
Non‐OBF: Non‐officially brucellosis free in cattle.
AL: Albania; BA: Bosnia and Herzegovina; FYRM: Former Yugoslav Republic of Macedonia; ME: Montenegro; SR, Serbia.
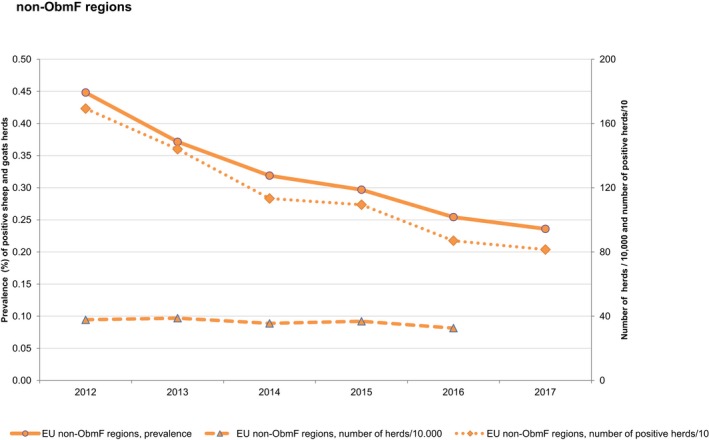
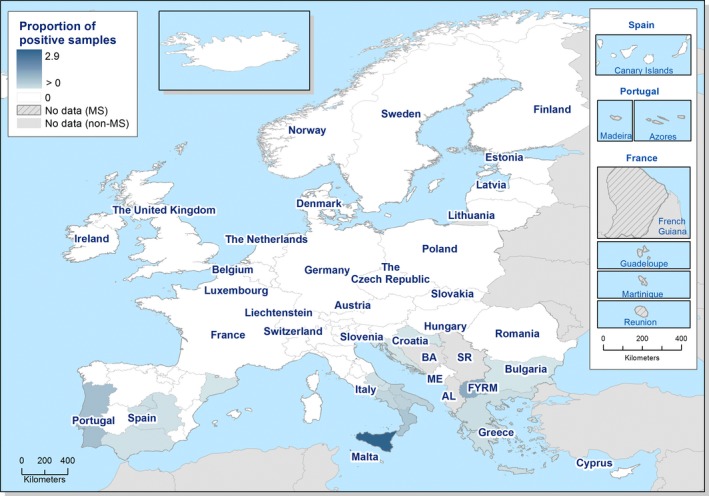
Non‐ObmF: Non‐officially B. melitensis free in sheep and goats.
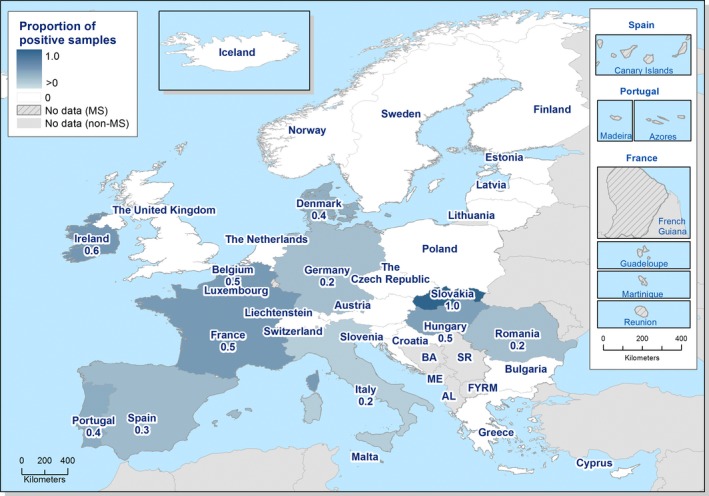
Source: Austria, Cyprus, Czech Republic, Estonia, Finland, Germany, France, Greece, Hungary, Ireland, Italy, Latvia, Lithuania, Luxembourg, Malta, Netherlands, Norway, Poland, Portugal, Romania, Slovakia, Slovenia, Spain, Sweden and United Kingdom. Belgium, Bulgaria, Croatia and Iceland did not report data to the level of detail required for the analysis. Denmark does not have any formal surveillance system for the disease.
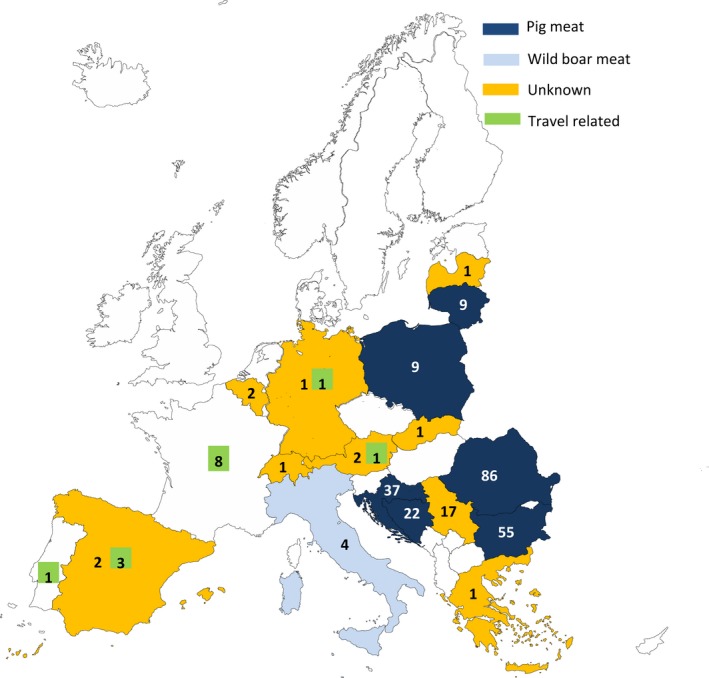
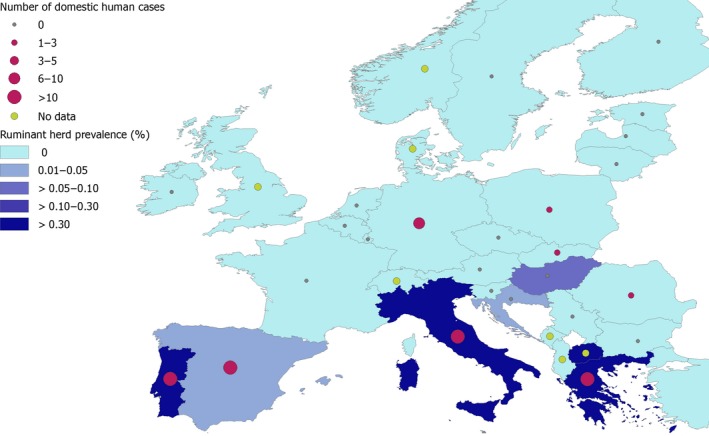
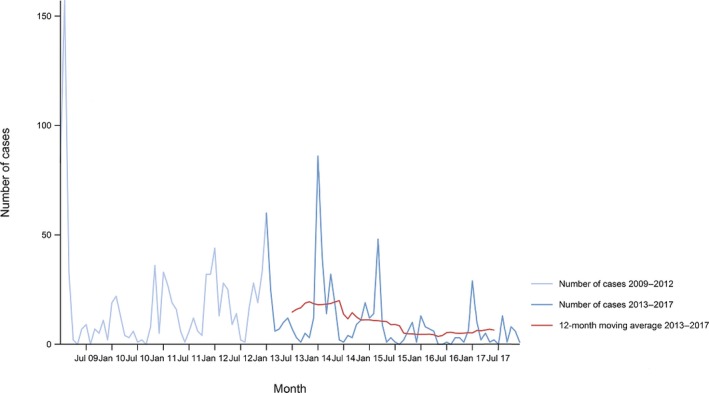
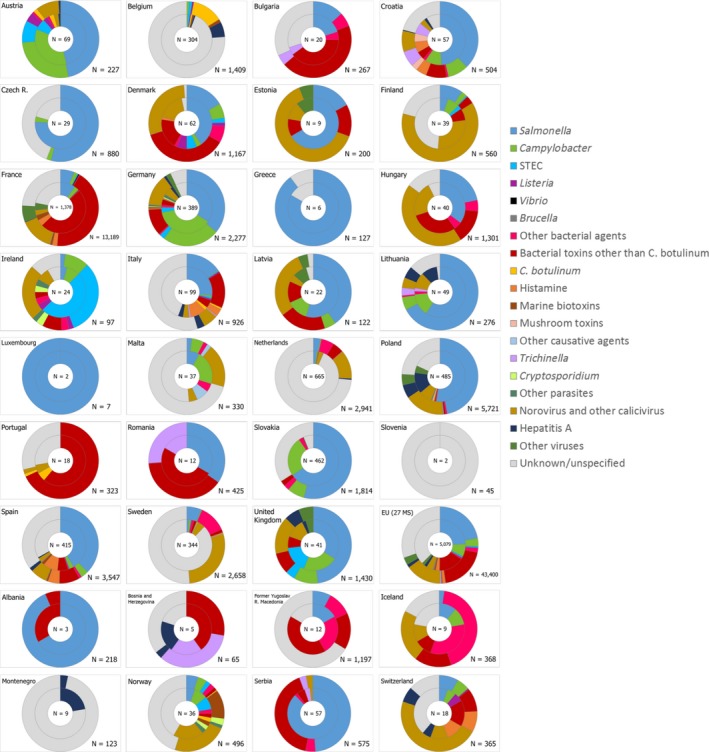
Countries in which human cases were reported due to food‐borne outbreaks (EFSA data) are in colour according the food vehicle causing the outbreaks (‘pigmeat’, ‘wild‐boar meat’ or ‘unknown’ food vehicle). The number of cases in each country indicates domestic trichinellosis cases (ECDC data); numbers in green box indicate the travel‐related trichinellosis human cases.
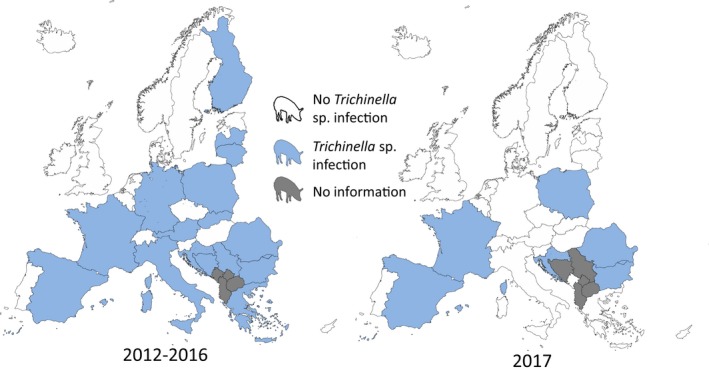
This distribution maps have been built based on data from reports (EFSA and ECDC, 2015a,b, 2016b, 2017b).
Source: Austria, Estonia, France, Germany, Hungary, Latvia, Lithuania, Poland, Sweden, Slovakia and Slovenia. Belgium, Bulgaria, Croatia, Cyprus, Czech Republic, Denmark, Finland, Greece, Iceland, Italy, Ireland, Luxembourg, Malta, Netherlands, Norway, Portugal, Romania, Spain and the United Kingdom did not report data to the level of detail required for the analysis.
Source: Austria, Estonia, Finland, Germany, Greece, Hungary, Ireland, Latvia, Lithuania, Malta, Netherlands, Norway, Malta, Poland, Portugal, Romania, Slovakia, Slovenia, Spain, Sweden and United Kingdom. Belgium, Bulgaria, Croatia, Cyprus, the Czech Republic, Denmark, France, Iceland, Italy and Luxembourg did not report data to the level of detail required for the analysis.
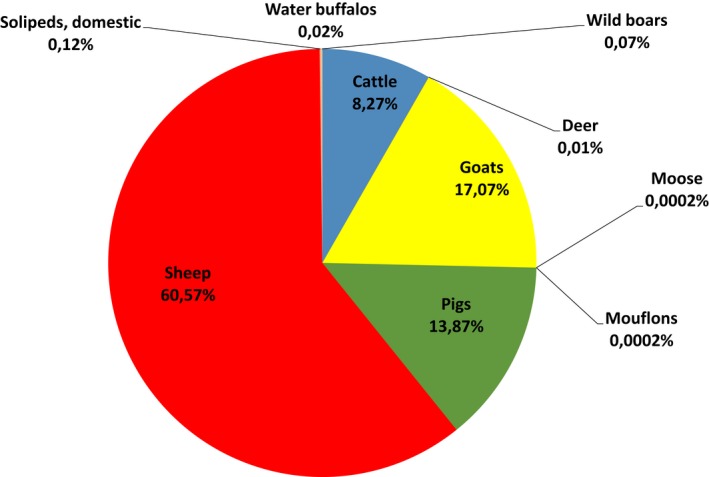
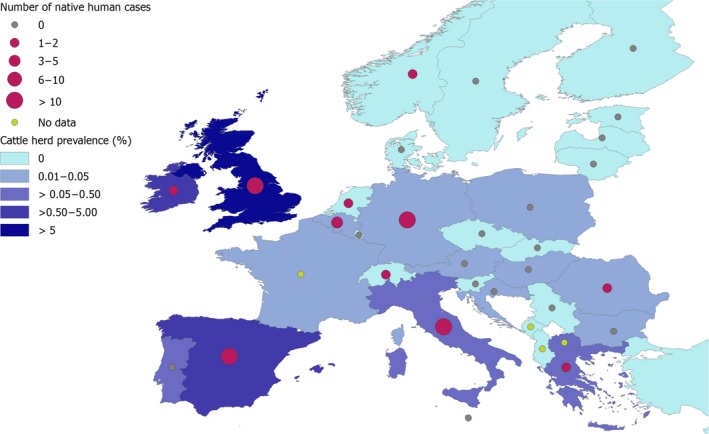
Number of positive animals: cattle (n = 77,722), deer (n = 126), goats (n = 160,398), moose (n = 2), mouflons (n = 2), pigs (n = 130,359), sheep (n = 569,179), domestic solipeds (n = 1,108), water buffalos (n = 157), wild boars (n = 666). The total number of positive animals for E. granulosus s.l. reported in this reported period was 939,719. Positive pigs could be overestimated in co‐endemic countries with E. multilocularis.
Intermediate hosts included in map are: cattle, deer, goats, moose, mouflons, sheep, horses, water buffalos and wild boars. Pigs were excluded from Poland and Germany because of the co‐endemicity with E. multilocularis.
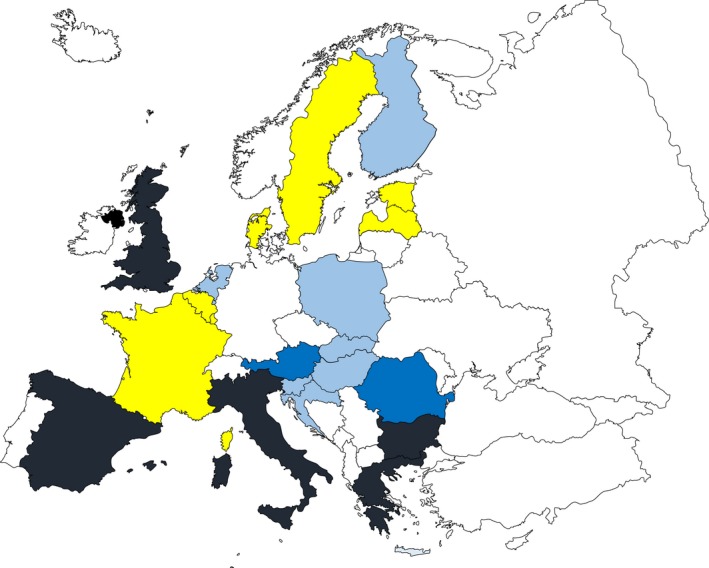
Colours legend: black > 10,000 positive cases; dark blue < 1,000 positive cases; light blue < 100 cases; yellow: 0 cases reported; white: data not reported.
Source(s): Cyprus, Czech Republic, Estonia, Finland, France, Germany, Greece, Hungary, Iceland, Ireland, Latvia, Lithuania, Luxembourg, Malta, Netherlands, Norway, Poland, Portugal, Romania, Slovakia, Slovenia, Sweden.
Austria, Belgium, Bulgaria, Croatia, Denmark, Italy, Spain, Switzerland and the United Kingdom did not report data to the level of detail required for the analysis.
Source: Austria, Cyprus, Czech Republic, Estonia, Finland, France, Greece, Hungary, Ireland, Italy, Latvia, Lithuania, Luxembourg, Malta, Netherlands, Norway, Poland, Romania, Slovakia, Slovenia, Spain, Sweden and United Kingdom.
Belgium, Bulgaria, Croatia, Denmark, Germany, Iceland and Portugal did not report data to the level of detail required for the analysis.

Source: Cyprus, Czech Republic, Estonia, Finland, France, Germany, Greece, Hungary, Iceland, Ireland, Latvia, Luxembourg, Malta, Norway, Poland, Romania, Slovakia, Slovenia, Spain, Sweden and United Kingdom.
Austria, Belgium, Bulgaria, Croatia, Denmark, Italy, Lithuania, Netherlands and Portugal did not report data to the level of detail required for the analysis.
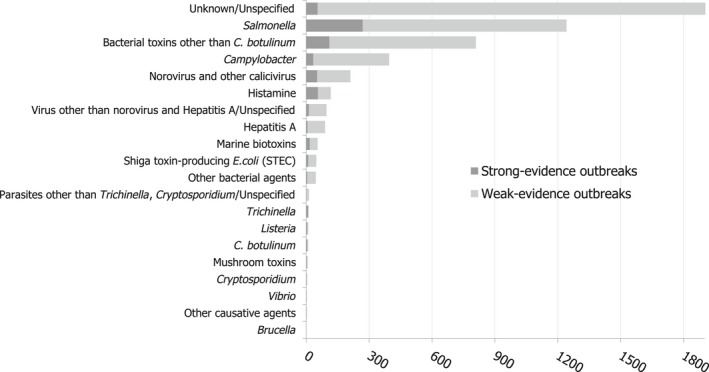
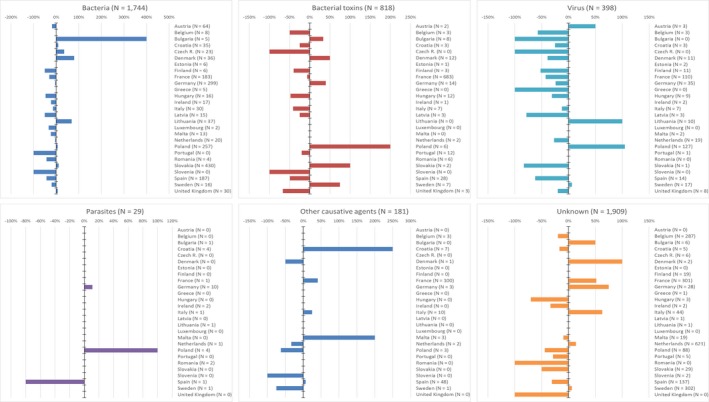
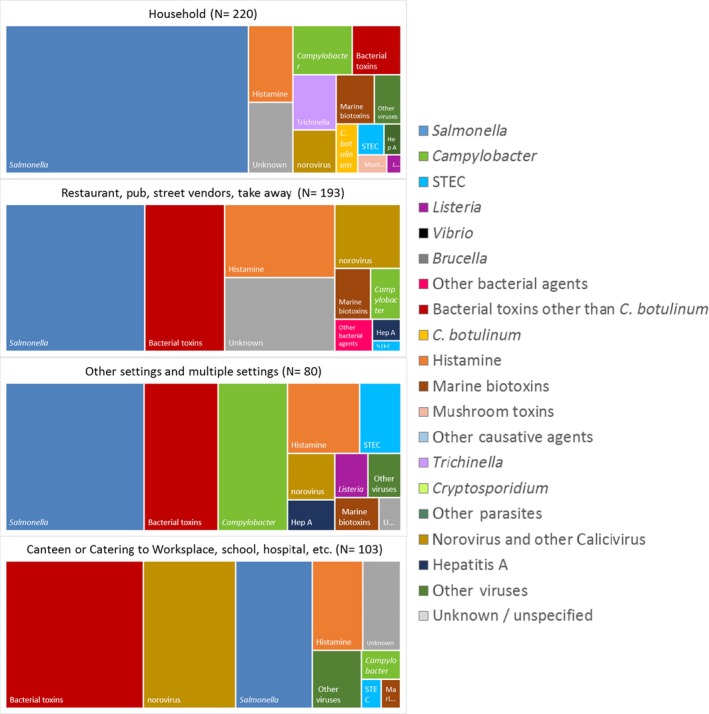
Other bacterial agents include Aeromonas hydrophila, enteroaggregative E. coli (EAEC), enterotoxigenic E. coli (ETEC), enteroinvasive E. coli (EIEC), enteropathogenic E. coli (EPEC), Shigella flexneri, Shigella sonnei, Yersinia enterocolitica other unspecified bacteria. Bacterial toxins other than C. botulinum include toxins produced by Bacillus, Clostridium other than C. botulinum and Staphylococcus and other unspecified bacterial toxins. Virus other than norovirus and hepatitis A include adenovirus, flavivirus, hepatitis E, rotavirus and other unspecified viruses. Marine biotoxins include ciguatoxin and other unspecified toxins. Other causative agents include scombrotoxin. Parasites other than Trichinella, Cryptosporidium include Giardia and other unspecified parasites.
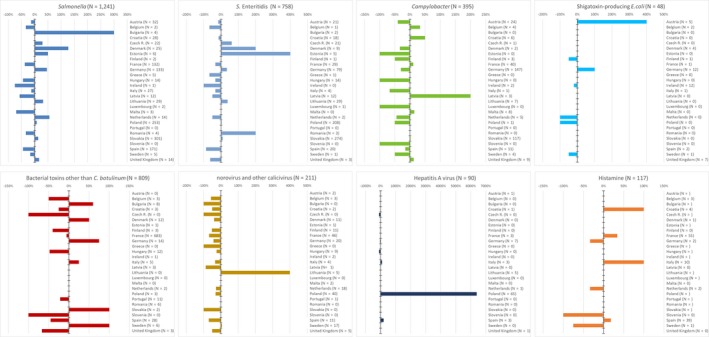
Bacterial toxins other than Clostridium botulinum include toxins produced by Bacillus, Clostridium other than Clostridium botulinum and Staphylococcus and other unspecified bacterial toxins.
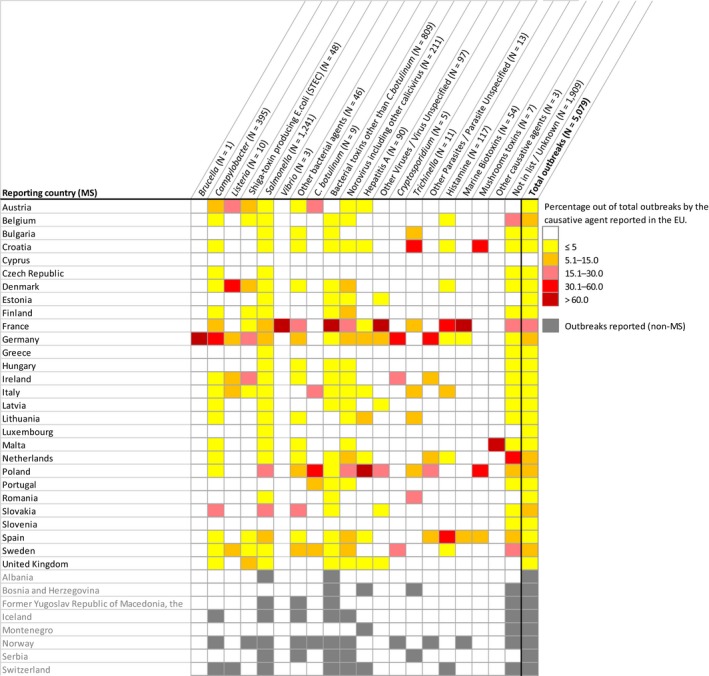
Only causative agents with more than 100 outbreaks reported in the EU, are shown.
Other bacterial agents include Aeromonas hydrophila, enteroaggregative E. coli (EAEC), Enterotoxigenic E. coli (ETEC), Enteroinvasive E. coli (EIEC), Enteropathogenic E. coli (EPEC), Shigella flexneri, Shigella sonnei, Yersinia enterocolitica, Yersinia pseudotuberculosis and other unspecified bacteria. Bacterial toxins other than Clostridium botulinum include toxins produced by Bacillus, Clostridium other than Clostridium botulinum and Staphylococcus and other unspecified bacterial toxins. Other viruses include adenovirus, flavivirus, hepatitis E virus, rotavirus and other unspecified viruses. Marine biotoxins include ciguatoxin and other unspecified toxins. Other toxins include scombrotoxin. Other parasites include Giardia and other unspecified parasites.
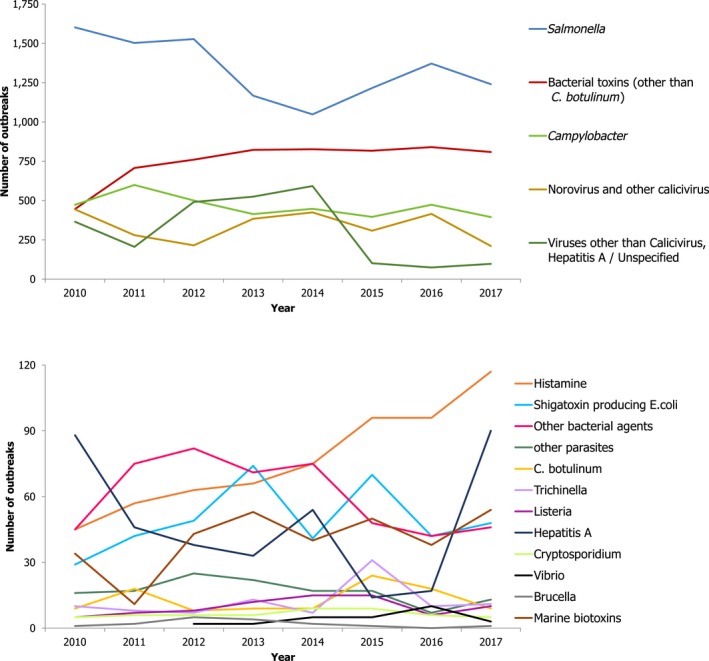
Other bacterial agents include Aeromonas hydrophila, enteroaggregative E. coli (EAEC), enterotoxigenic E. coli (ETEC), enteroinvasive E. coli (EIEC), enteropathogenic E. coli (EPEC), Shigella flexneri, Shigella sonnei, Yersinia enterocolitica and other unspecified bacteria. Bacterial toxins other than Clostridium botulinum include toxins produced by Bacillus, Clostridium other than Clostridium botulinum and Staphylococcus and other unspecified bacterial toxins. Other viruses include adenovirus, flavivirus, hepatitis E, rotavirus and other unspecified viruses. Marine biotoxins include ciguatoxin and other unspecified toxins. Other toxins include scombrotoxin and other unspecified toxins. Other parasites include Giardia and other unspecified parasites.
Bacterial toxins other than Clostridium botulinum include toxins produced by Bacillus, Clostridium other than Clostridium botulinum and Staphylococcus and other unspecified bacterial toxins.
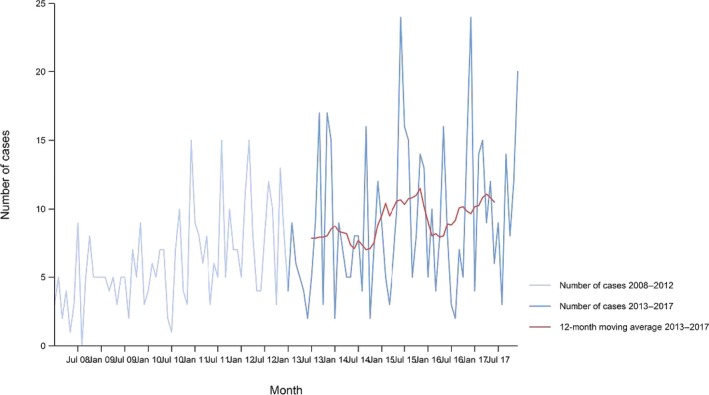
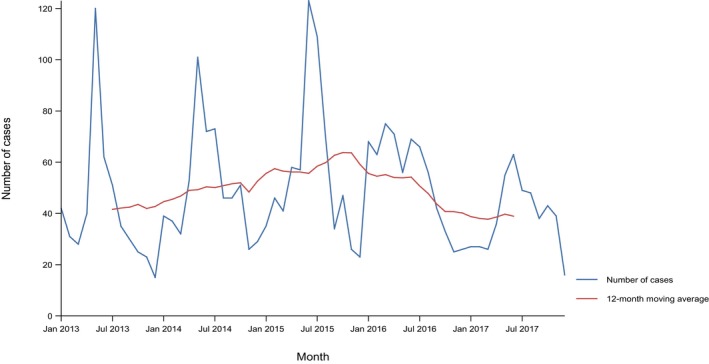
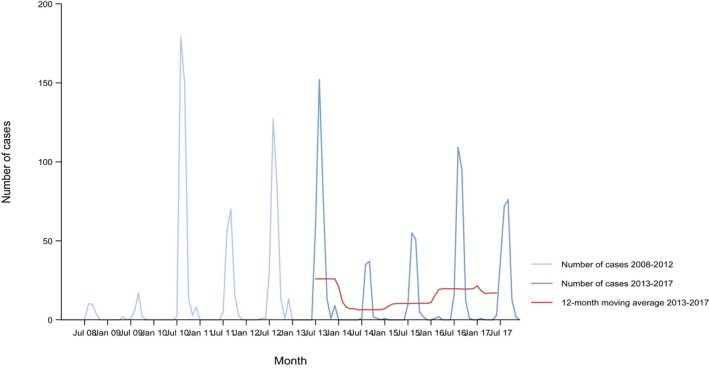
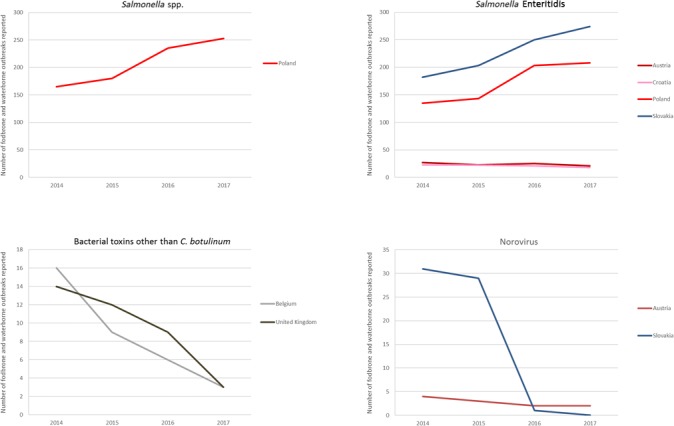
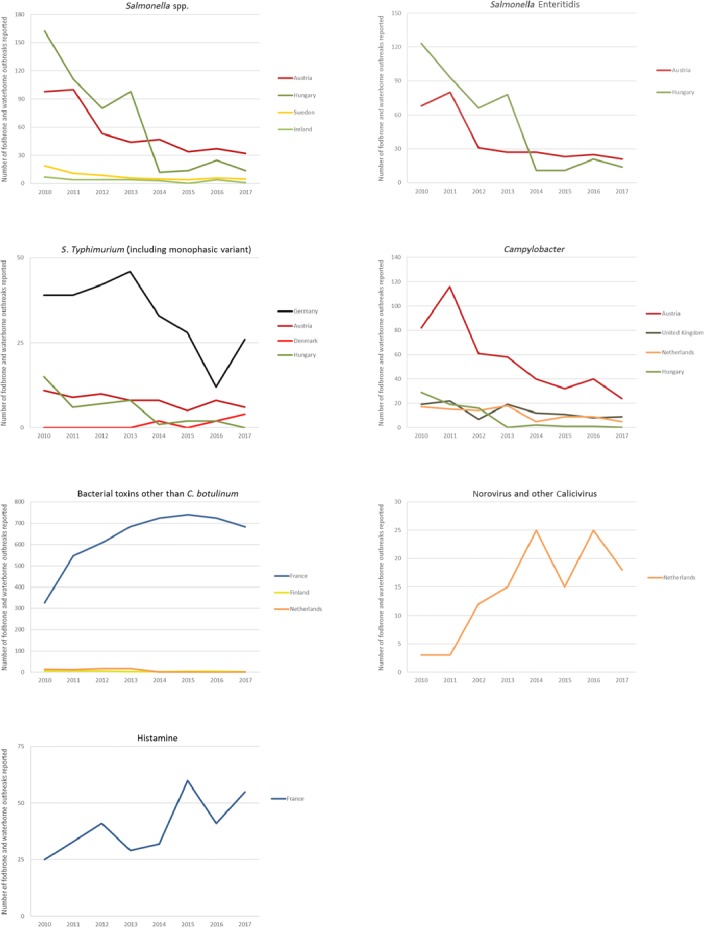
Only Member States with statistically significant trends (either increasing or decreasing) over years are shown.
Bacterial toxins other than Clostridium botulinum include toxins produced by Bacillus, Clostridium other than Clostridium botulinum and Staphylococcus and other unspecified bacterial toxins.
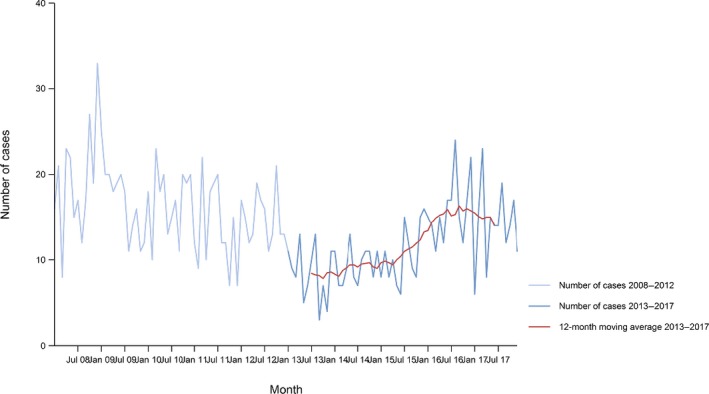
Only Member States with statistically significant trends (either increasing or decreasing) over years are shown.
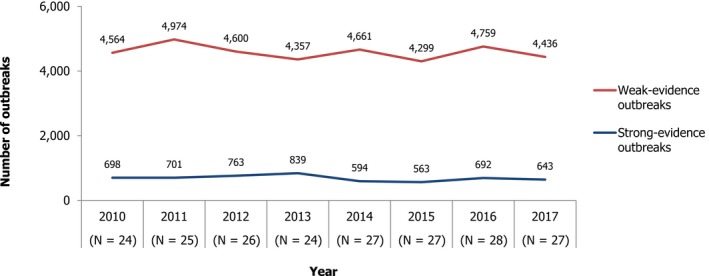
Five strong‐evidence outbreaks with food vehicle ‘unknown’ are not shown in the figure.
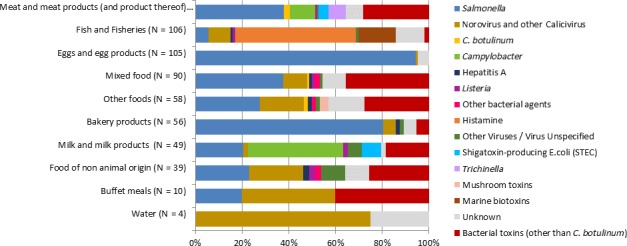
Meat and meat products include ‘Bovine meat’, ‘Pigmeat’, ‘Poultry meat’, ‘Sheep meat’, ‘Other or mixed red meat and their products’, ‘Meat and Meat products unspecified’. Fish and fishery products include: ‘Fish’, ‘Crustaceans, shellfish, molluscs and their products’. Food of non‐animal origin includes ‘Confections, ‘Fruits (and juices)’, ‘Herbs and spices’, ‘Vegetables (and juices)’. Milk and milk products include ‘Cheese’, ‘Dairy products (other than cheeses)’ and ‘Milk’. Other foods include ‘Canned food products’, ‘Cereal products and legumes’, ‘Other foods (Unspecified)’.
Other bacterial agents include enteroaggregative E. coli (EAEC), enteroinvasive E. coli (EIEC), Shigella flexneri, Yersinia enterocolitica. Bacterial toxins other than Clostridium botulinum include toxins produced by Bacillus, Clostridium other than Clostridium botulinum and Staphylococcus and other unspecified bacterial toxins. Other viruses include adenovirus, flavivirus (TBE virus), rotavirus and other unspecified viruses. Marine biotoxins include ciguatoxin and other unspecified toxins. Strong‐evidence FBO by ‘other causative agents have been detailed in the graph into the three classes: histamine, mushroom and marine toxins.
Forty‐seven food‐borne‐outbreaks with setting ‘unknown’ are not shown in the figure.
Other bacterial agents include enteroaggregative E. coli (EAEC), Enteroinvasive E. coli (EIEC), Shigella flexneri, Yersinia enterocolitica. Bacterial toxins other than Clostridium botulinum include toxins produced by Bacillus, Clostridium other than Clostridium botulinum and Staphylococcus and other unspecified bacterial toxins. Other viruses include adenovirus, flavivirus (TBE virus), rotavirus and other unspecified viruses. Marine biotoxins include ciguatoxin and other unspecified toxins.
Restaurant, pub, street vendors, take away, etc. include ‘Mobile retailer or market/street vendor’, ‘Restaurant or Cafe or Pub or Bar or Hotel or Catering service’, ‘Take‐away or fast‐food outlet’.
Other settings and multiple settings include ‘Camp or picnic’, ‘Disseminated cases’, ‘Farm’, ‘Multiple places of exposure in more than one country’, ‘Multiple places of exposure in one country’, ‘Others’, ‘Temporary mass catering (fairs or festivals)’.
Canteen or Catering to Workplace, school, hospital include ‘School or kindergarten’, ‘Residential institution (nursing home or prison or boarding school)’, ‘Canteen or workplace catering’, ‘Hospital or medical care facility’.
Canteen or Catering to Workplace, school, hospital, etc., include ‘Canteen or workplace catering’, ‘Catering on aircraft or ship or train’, ‘Hospital or medical care facility’, ‘Residential institution (nursing home or prison or boarding school)’, ‘School or kindergarten’.
Other settings and multiple settings include ‘Camp or picnic’, ‘Disseminated cases’, ‘Farm’, ‘Multiple places of exposure in more than one country’, ‘Multiple places of exposure in one country’, ‘Others’, ‘Temporary mass catering (fairs or festivals)’. Restaurant, pub, street vendors, take away, etc., include ‘Mobile retailer or market/street vendor’, ‘Restaurant or Cafe or Pub or Bar or Hotel or Catering service’, ‘Take‐away or fast‐food outlet’.
Bacterial toxins other than Clostridium botulinum include toxins produced by Bacillus, Clostridium other than Clostridium botulinum and Staphylococcus and other unspecified bacterial toxins.
Meat and meat products include ‘Bovine meat’, ‘Pigmeat’, ‘Poultry meat’, ‘Sheep meat’, ‘Other or mixed red meat and their products’, ‘Meat and Meat products unspecified’. Milk and milk products include ‘Dairy products (other than cheeses)’, ‘Milk’.
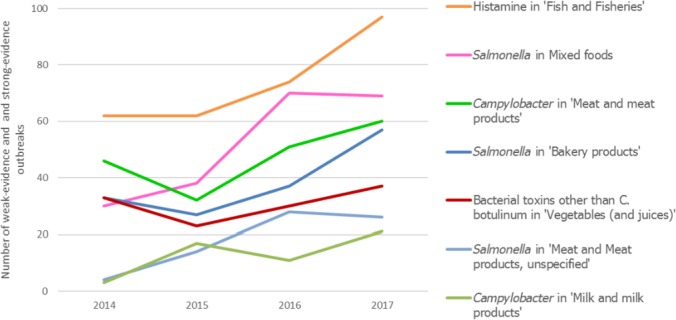
Only food/agent combinations that progressively increased over years among those most frequently reported are shown.
References
-
- Alban L, Pozio E, Boes J, Boireau P, Boue F, Claes M, Cook AJC, Dorny P, Enemark HL, van der Giessen J, Hunt KR, Howell M, Kirjusina M, Noeckler K, Rossi P, Smith GC, Snow L, Taylor MA, Theodoropoulos G, Vallee I, Viera‐Pinto MM and Zimmer IA, 2011. Towards a standardised surveillance for Trichinella in the European Union. Preventive Veterinary Medicine, 99, 148–160. 10.1016/j.prevetmed.2011.02.008 - DOI - PubMed
LinkOut - more resources
Full Text Sources
Other Literature Sources
Miscellaneous