

The European Union summary report on antimicrobial resistance in zoonotic and indicator bacteria from humans, animals and food in 2016
- PMID: 32625816
- PMCID: PMC7009656
- DOI: 10.2903/j.efsa.2018.5182
The European Union summary report on antimicrobial resistance in zoonotic and indicator bacteria from humans, animals and food in 2016
Abstract
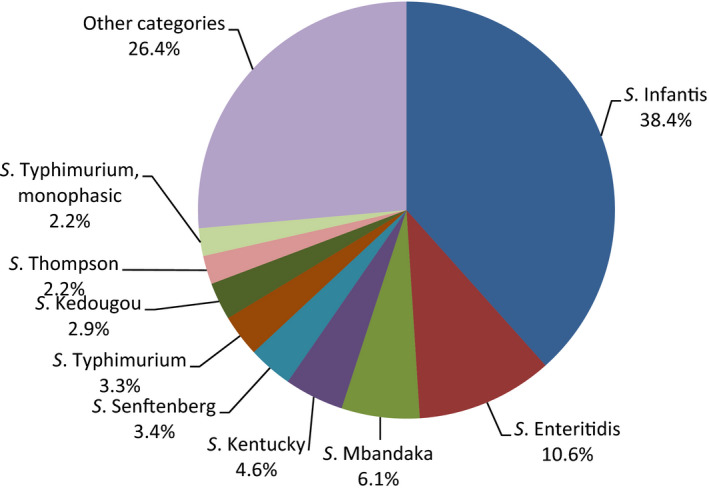
The data on antimicrobial resistance in zoonotic and indicator bacteria in 2016, submitted by 28 EU Member States (MSs), were jointly analysed by the EFSA and ECDC. Resistance in bacterial isolates of zoonotic Salmonella and Campylobacter from humans, animals and food, and resistance in indicator Escherichia coli as well as in meticillin-resistant Staphylococcus aureus from animals and food were addressed. 'Microbiological' resistance was assessed using epidemiological cut-off (ECOFF) values; for some countries, qualitative data on isolates from humans were interpreted in a way that corresponds closely to ECOFF-defined 'microbiological' resistance. In Salmonella from humans, the occurrence of resistance to ampicillin, sulfonamides and tetracyclines was high, whereas resistance to third-generation cephalosporins was low. In Salmonella and E. coli isolates from broilers, fattening turkeys and their meat, resistance to ampicillin, (fluoro)quinolones, tetracyclines and sulfonamides was frequently high, whereas resistance to third-generation cephalosporins was rare. The occurrence of ESBL-/AmpC producers was low in Salmonella and E. coli from poultry and in Salmonella from humans. The prevalence of ESBL-/AmpC-producing E. coli, assessed in poultry and its meat for the first time, showed marked variations among MSs. Fourteen presumptive carbapenemase-producing E. coli were detected from broilers and its meat in two MSs. Resistance to colistin was observed at low levels in Salmonella and E. coli from poultry and meat thereof and in Salmonella from humans. In Campylobacter from humans, broilers and broiler meat, resistance to ciprofloxacin and tetracyclines was high to extremely high, whereas resistance to erythromycin was low to moderate. Combined resistance to critically important antimicrobials in isolates from both humans and animals was generally uncommon, but very high to extremely high multidrug resistance levels were observed in certain Salmonella serovars. Specific serovars of Salmonella (notably Kentucky) from both humans and animals exhibited high-level resistance to ciprofloxacin, in addition to findings of ESBL.
Keywords: ESBL; antimicrobial resistance; indicator bacteria; zoonotic bacteria.
© European Food Safety Authority and European Centre for Disease Prevention and Control, 2018.
Figures
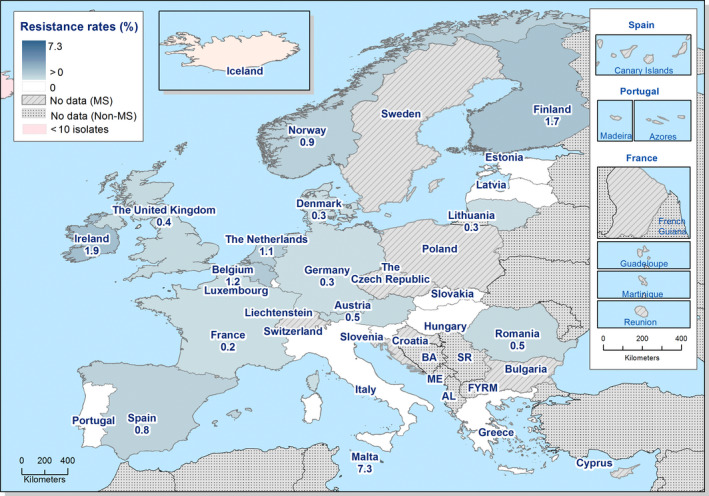
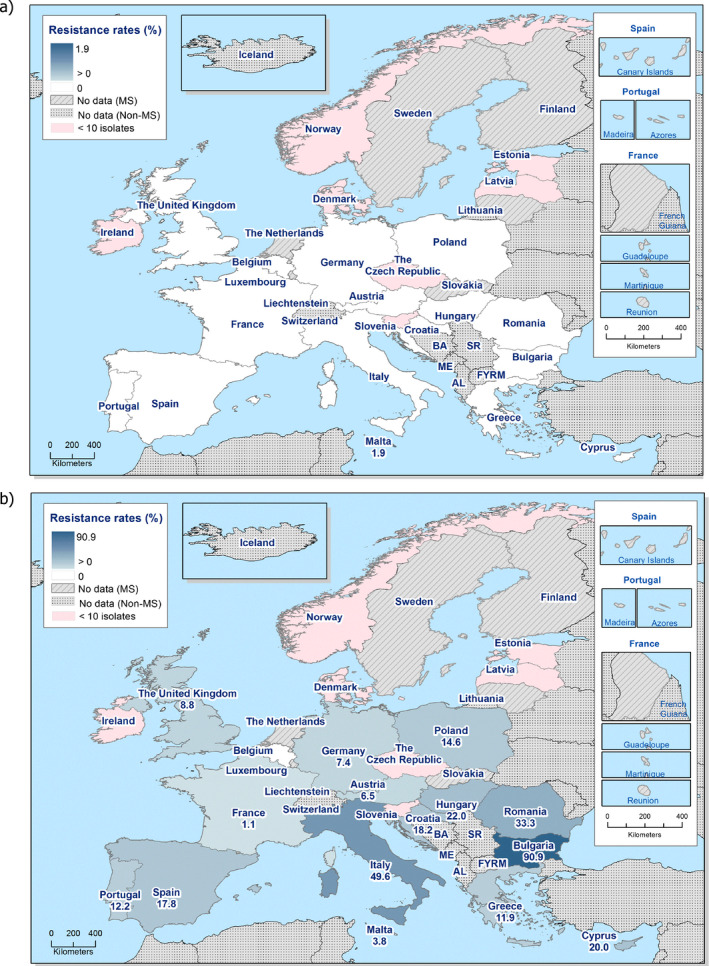
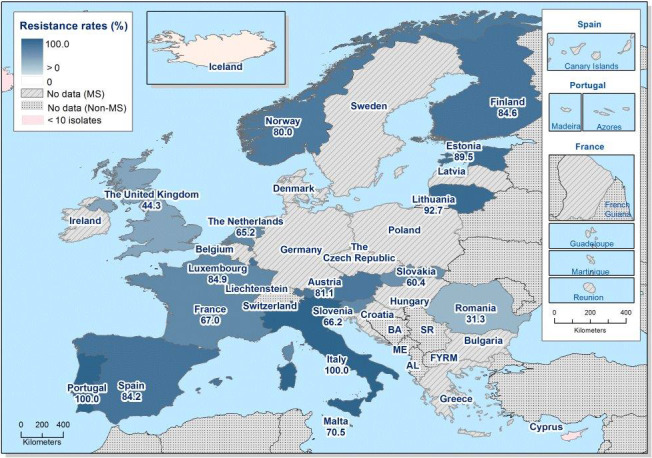
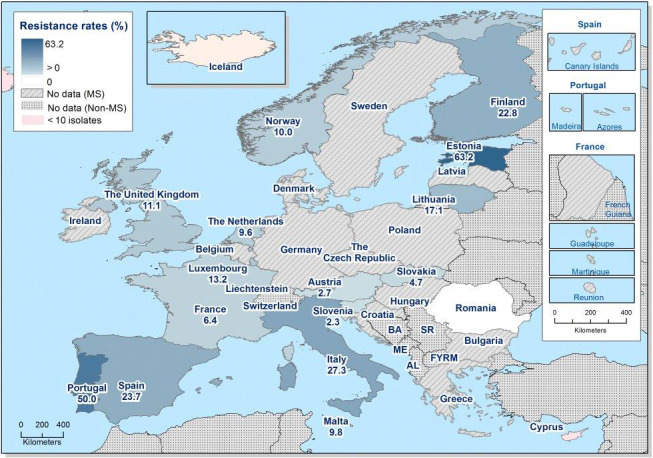
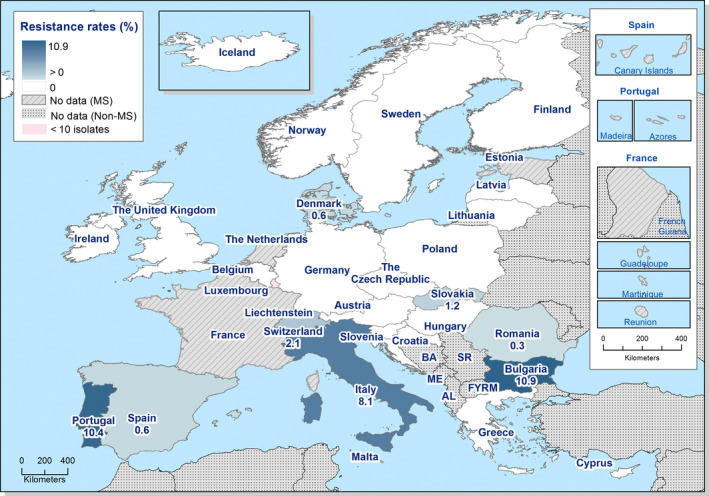
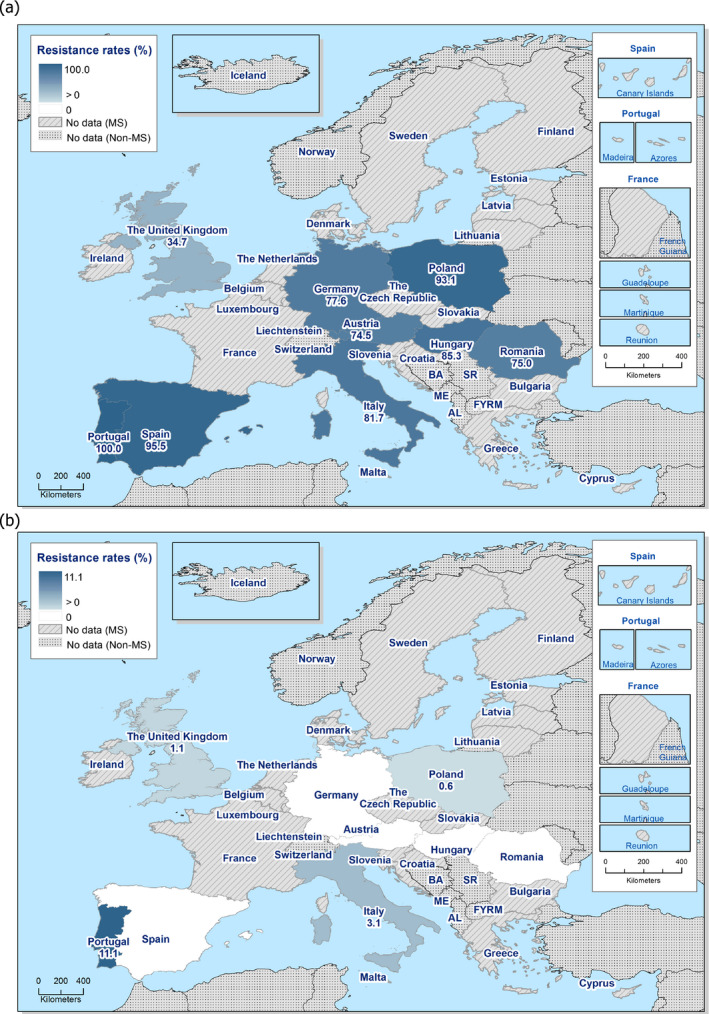
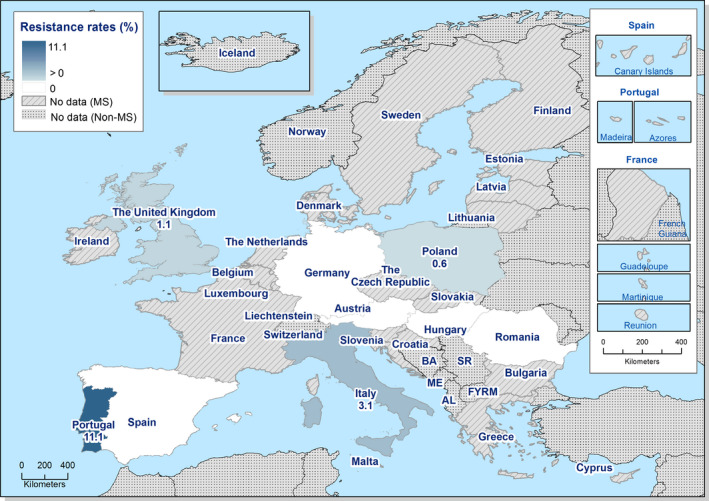
Dots represent reporting MSs.
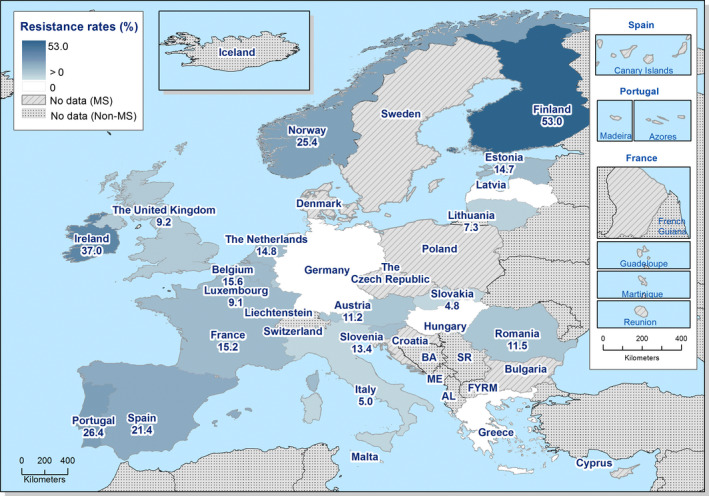
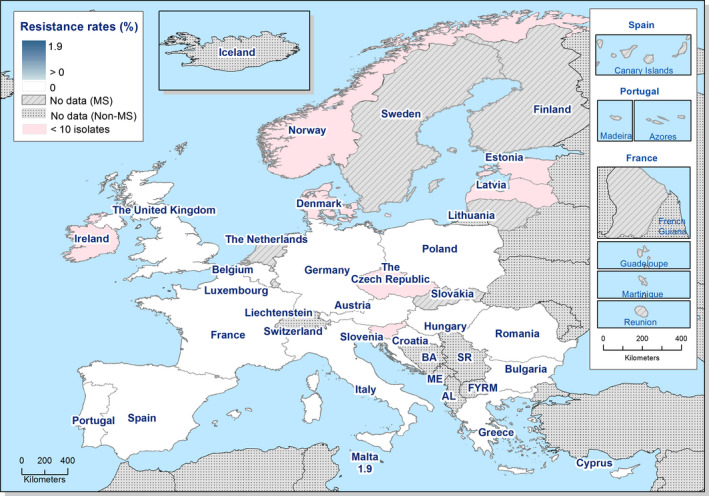
Dots represent reporting MSs.
Dots represent reporting MSs.
Dots represent reporting MSs.
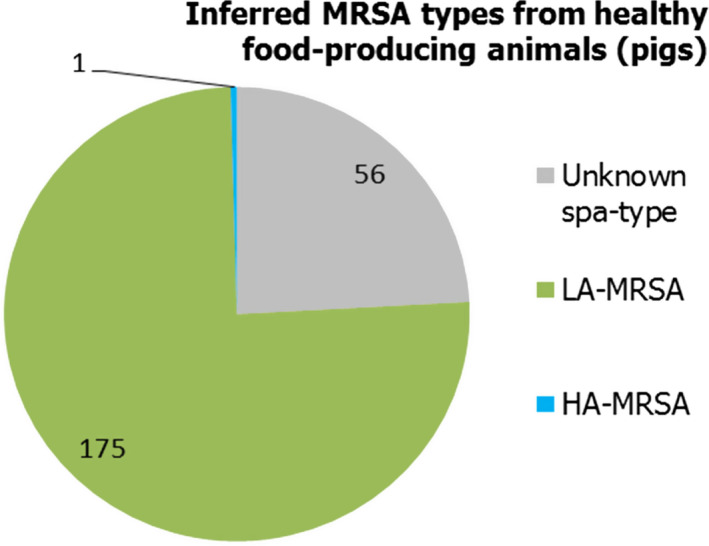
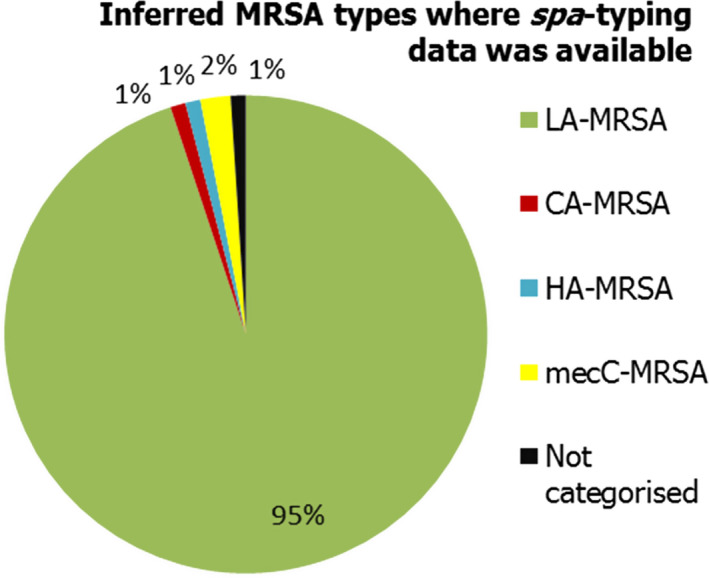
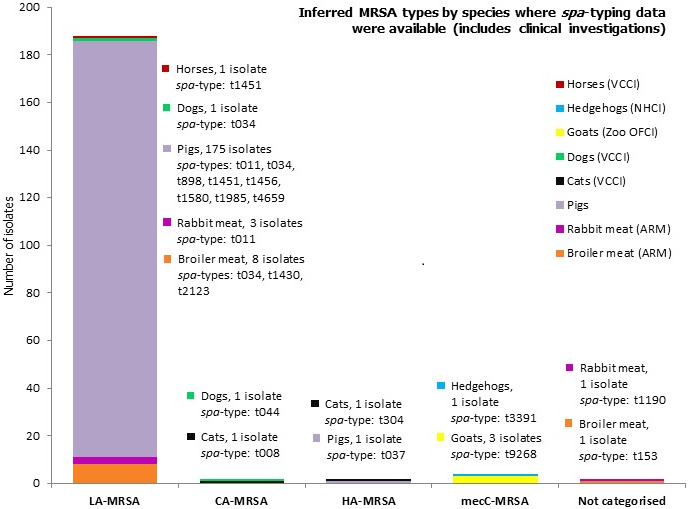
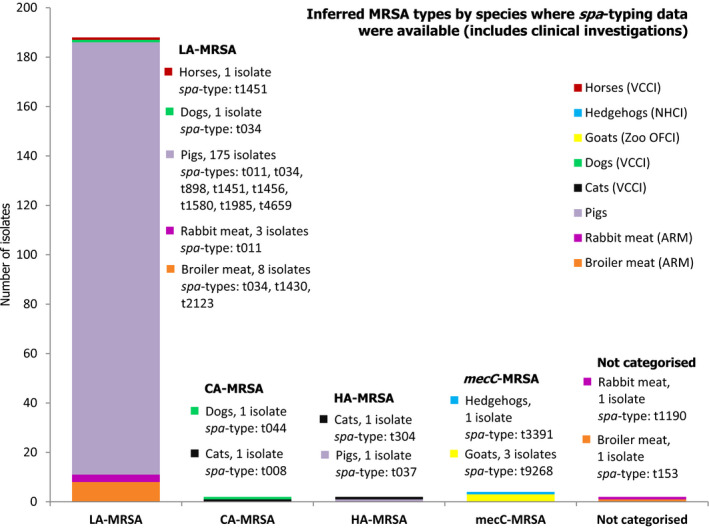
MLST types have for the most part been inferred from spa‐typing data, some isolates wereMLST typed. Both spa‐types t1190 and t153 were not categorised asCA ‐MRSA orHA ‐MRSA as further typing data includingPVL status were not reported. In total, 198MRSA isolates were spa‐typed.VCCI : at veterinary clinic clinical investigation;NHCI : Natural habitat clinical investigations;OFCI : On‐farm clinical investigations;ARM : At retail monitoring; MLST: multilocus sequence typing; CA: community‐associated; HA: healthcare‐associated; LA: livestock‐associated; MRSA: meticillin‐resistant Staphylococcus aureus.
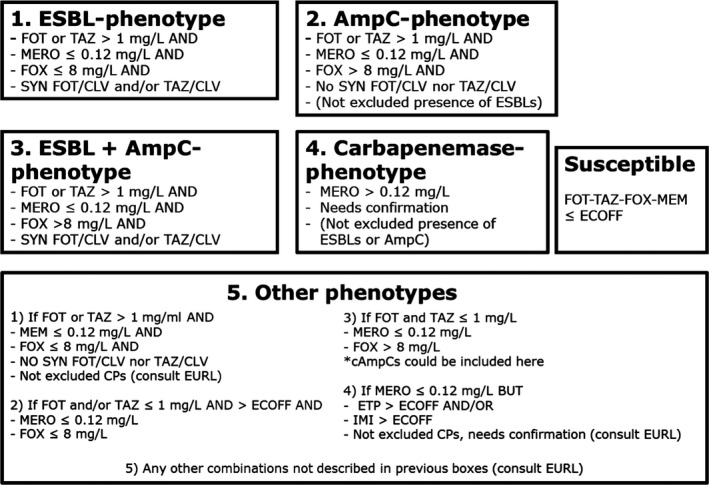
Presumptive
ESBL producers include isolates exhibiting phenotype 1 or 3.Presumptive AmpC producers include isolates exhibiting phenotype 2 or 3.
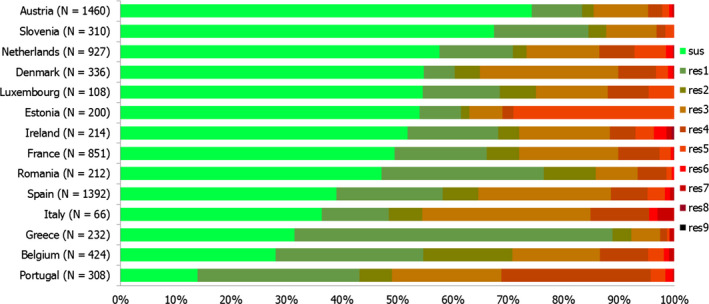
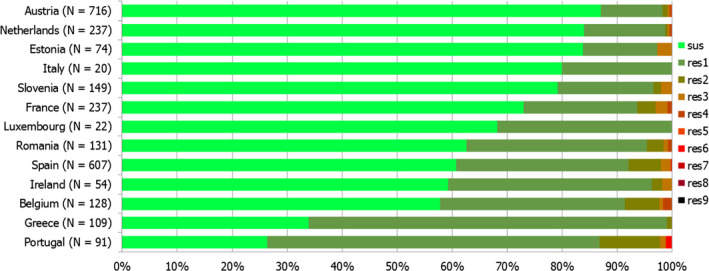
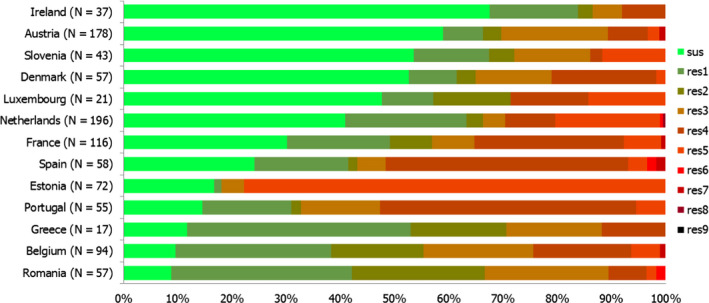
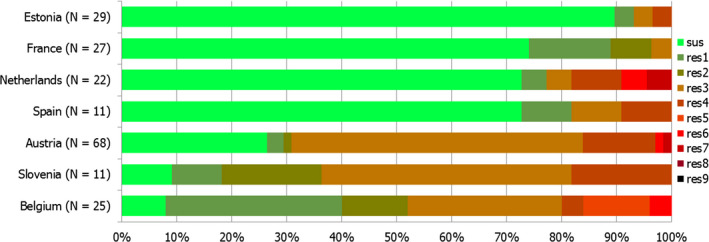
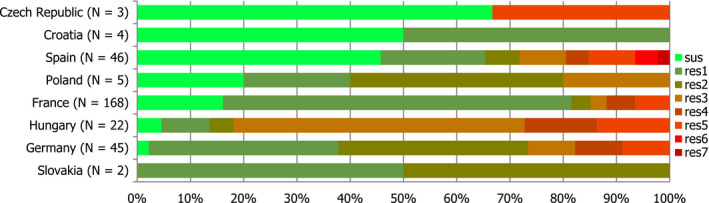
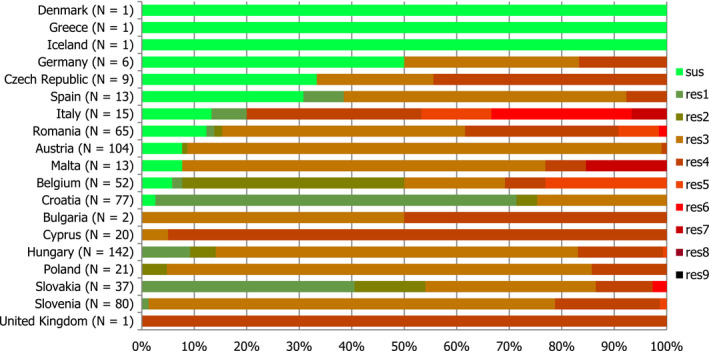
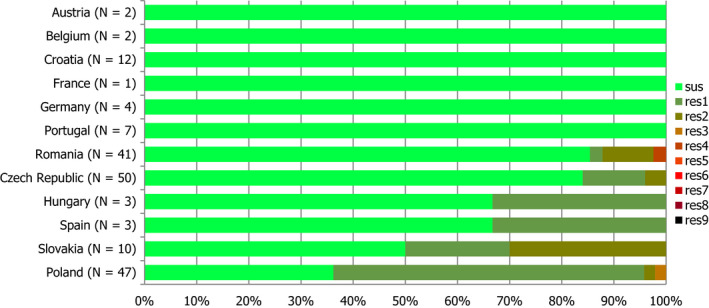
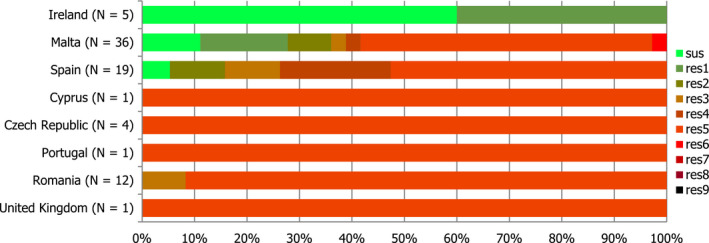
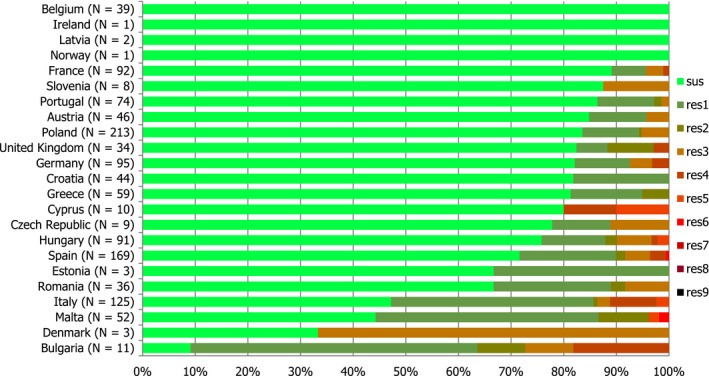
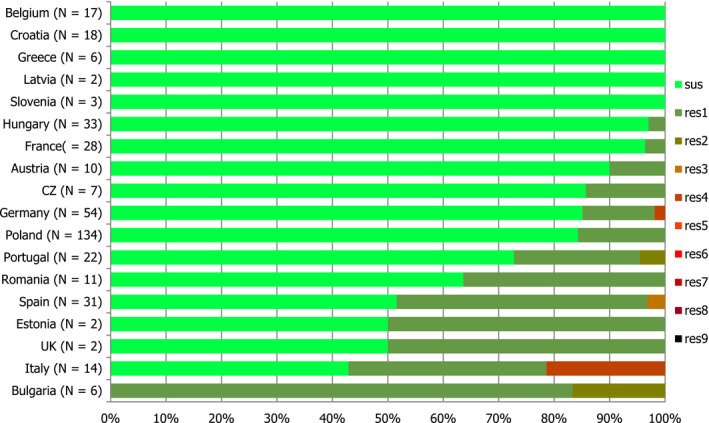
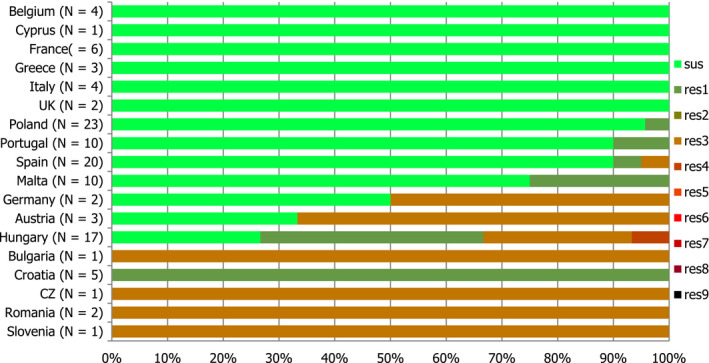
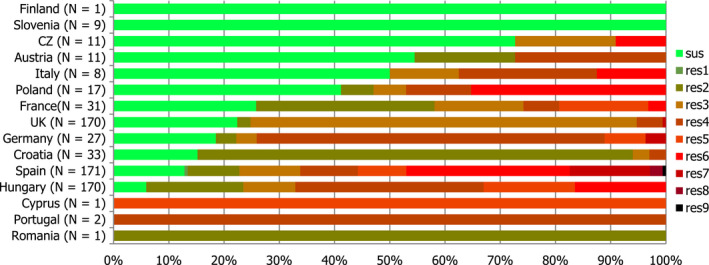
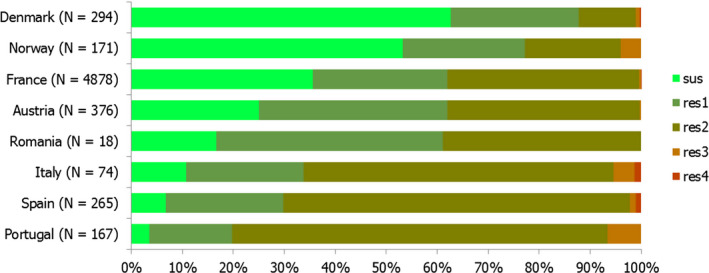
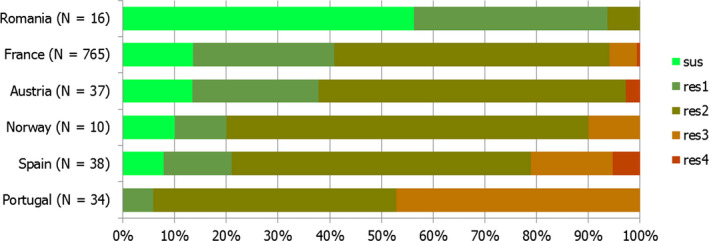
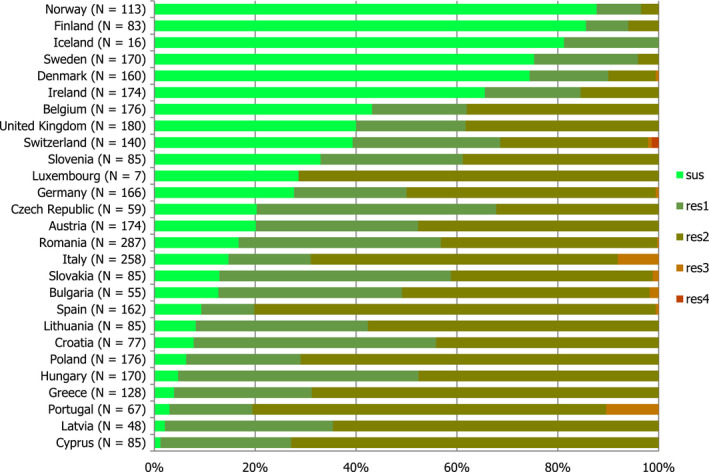
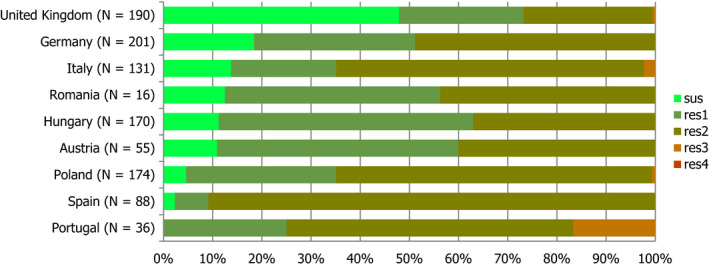
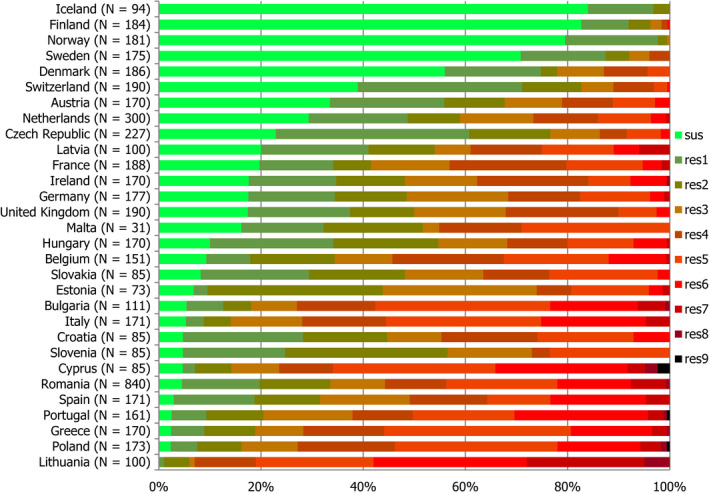
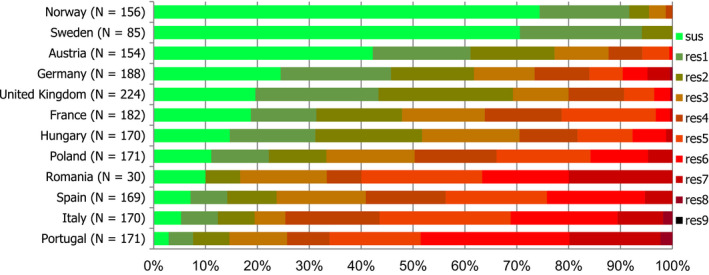
N: total number of isolates tested for susceptibility against the whole common set of antimicrobials for Salmonella; sus: susceptible to all antimicrobial classes of the common set for Salmonella; res1–res9: resistance to one up to nine antimicrobial classes of the common set for Salmonella.
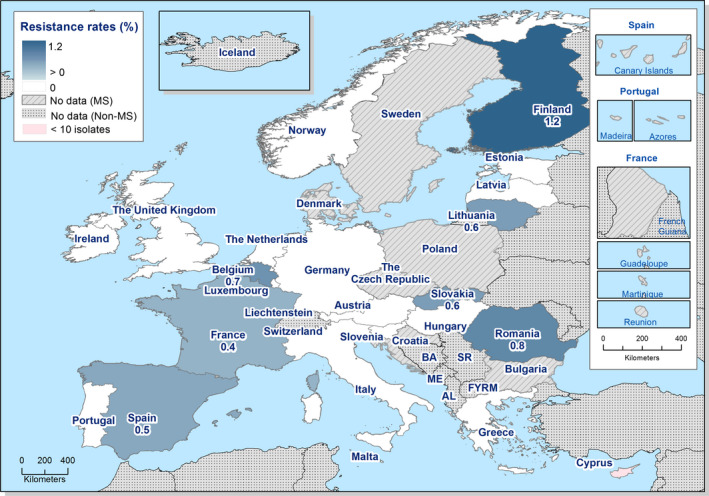
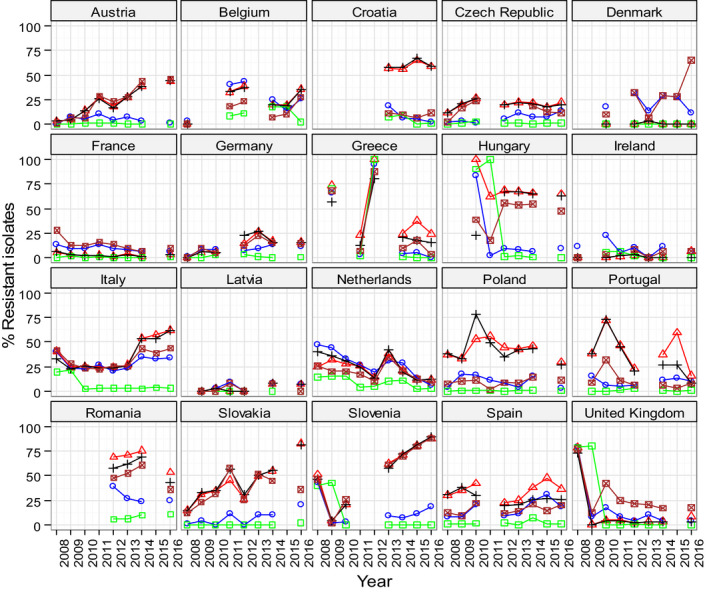
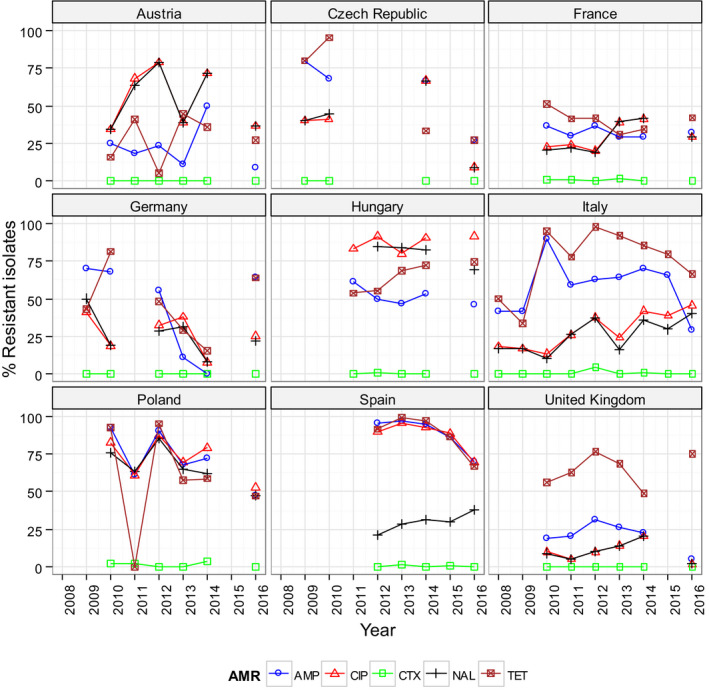
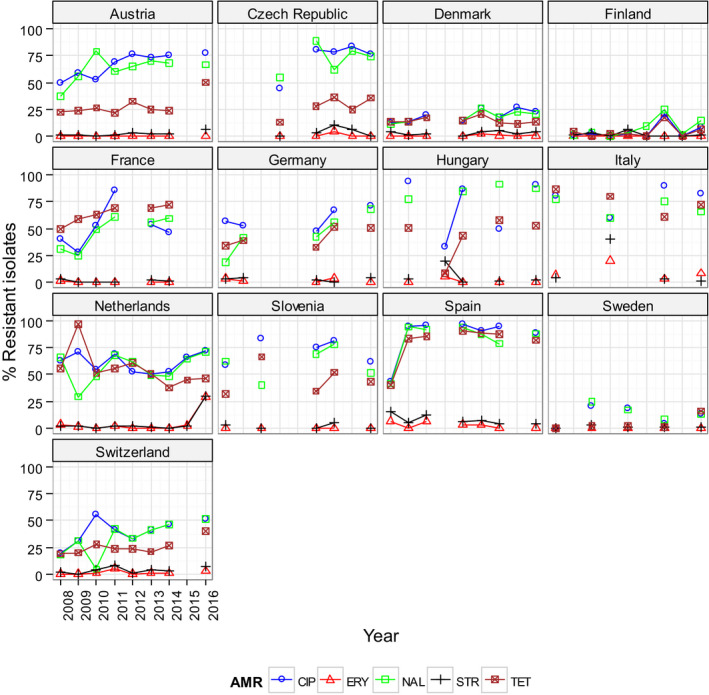
Statistically significant increasing trends over 3–4 years, as tested by logistic regression (p ≤ 0.05), were observed for ciprofloxacin in Finland and Germany, for ampicillin in Finland, Germany and Hungary, and for tetracyclines in Finland, Hungary and Norway. Statistically significant decreasing trends over 3–4 years were observed for ciprofloxacin in France, Hungary, Malta, Spain and the United Kingdom, for ampicillin in Italy, Latvia, Lithuania, Luxembourg, Malta, Romania, Slovenia and Spain, and for tetracyclines in Portugal. Only countries testing at least 10 isolates per year were included in the analysis.
N: total number of isolates tested for susceptibility against the whole common antimicrobial set for Salmonella; sus: susceptible to all antimicrobial classes of the common set for Salmonella; res1–res9: resistance to one up to nine antimicrobial classes of the common set for Salmonella.
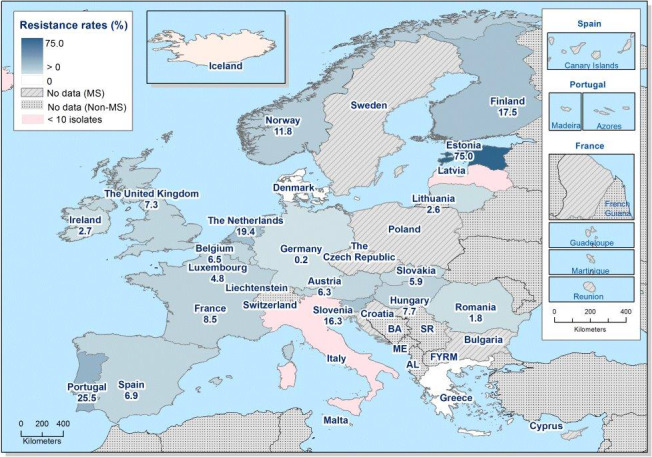
Statistically significant increasing trends over 3–4 years, as tested by logistic regression (p ≤ 0.05), were observed for ciprofloxacin in Estonia, Finland, Hungary, the Netherlands and Portugal, for ampicillin in Belgium, Lithuania, Slovakia and the United Kingdom, for tetracyclines in Belgium, Denmark and the United Kingdom, and for cefotaxime in Austria, Statistically significant decreasing trends over 3–4 years were observed for ciprofloxacin in Lithuania, for ampicillin in Finland, Hungary, Luxembourg, Norway and Spain, and for tetracyclines in Finland, Germany, Hungary, the Netherlands and Spain. Only countries testing at least 10 isolates per year were included in the analysis.
N: total number of isolates tested for susceptibility against the whole common antimicrobial set for Salmonella; sus: susceptible to all antimicrobial classes of the common set for Salmonella; res1–res9: resistance to one up to nine antimicrobial classes of the common set for Salmonella.
Statistically significant increasing trends over 3–4 years, as tested by logistic regression (p ≤ 0.05), were observed for ciprofloxacin in Germany, for ampicillin in Germany and for tetracyclines in the Netherlands. Statistically significant decreasing trends over 3–4 years were observed for ampicillin in Slovakia and for cefotaxime in Belgium. Only countries testing at least 10 isolates per year were included in the analysis.
N: total number of isolates tested for susceptibility against the whole common antimicrobial set for Salmonella; sus: susceptible to all antimicrobial classes of the common set for Salmonella; res1–res9: resistance to one up to nine antimicrobial classes of the common set for Salmonella.
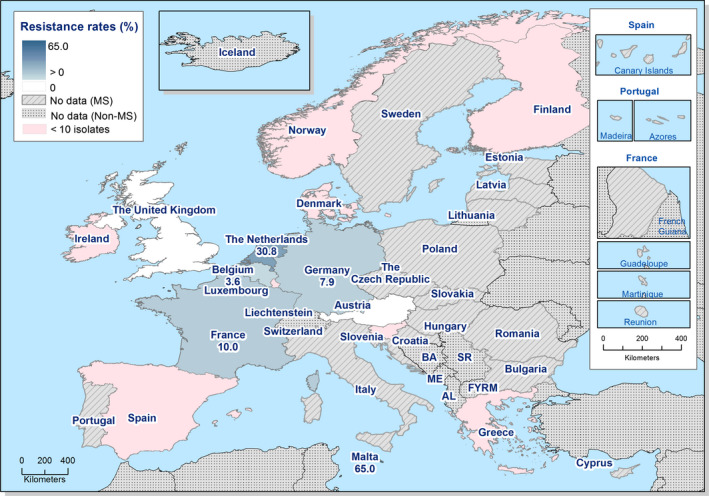
Statistically significant increasing trends over 3–4 years, as tested by logistic regression (p ≤ 0.05), were observed for ciprofloxacin in Germany and Malta and for ampicillin in Malta. Only countries testing at least 10 isolates per year were included in the analysis.
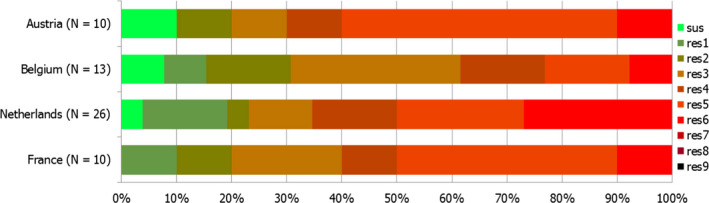
N: total number of isolates tested for susceptibility against the whole common antimicrobial set for Salmonella; sus: susceptible to all antimicrobial classes of the common set for Salmonella; res1–res9: resistance to one up to nine antimicrobial classes of the common set for Salmonella.
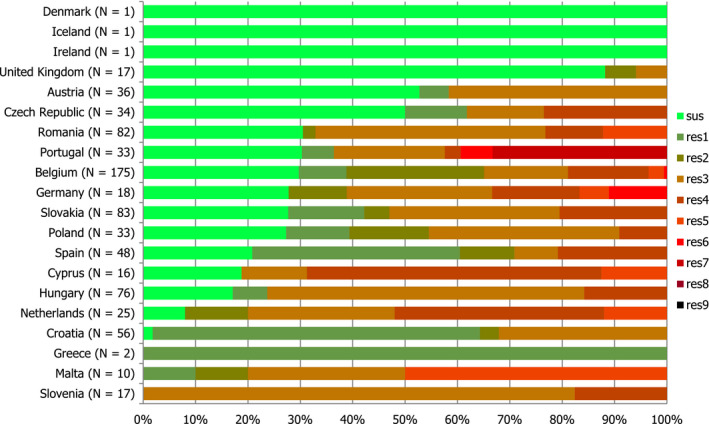
N: total number of isolates tested for susceptibility against the whole common antimicrobial set for Salmonella; sus: susceptible to all antimicrobial classes of the common set for Salmonella; res1–res9: resistance to one antimicrobial classes/resistance to nine antimicrobial classes of the common set for Salmonella.
N: total number of isolates tested for susceptibility against the whole common antimicrobial set for Salmonella; sus: susceptible to all antimicrobial classes of the common set for Salmonella; res1–res5: resistance to one antimicrobial classes/resistance to five antimicrobial classes of the common set for Salmonella.
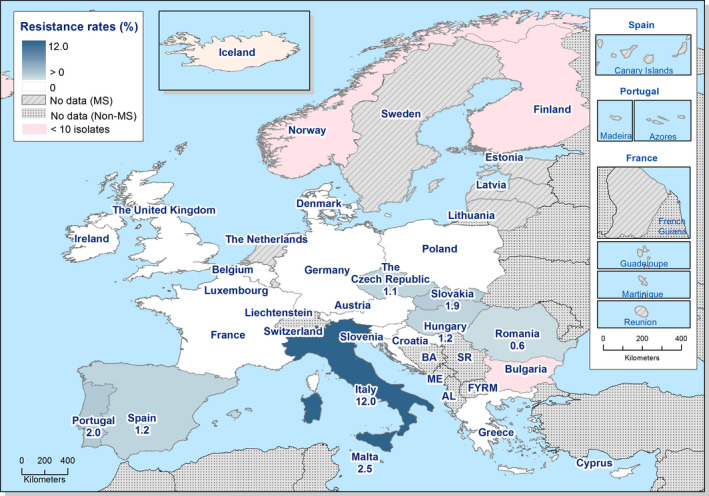
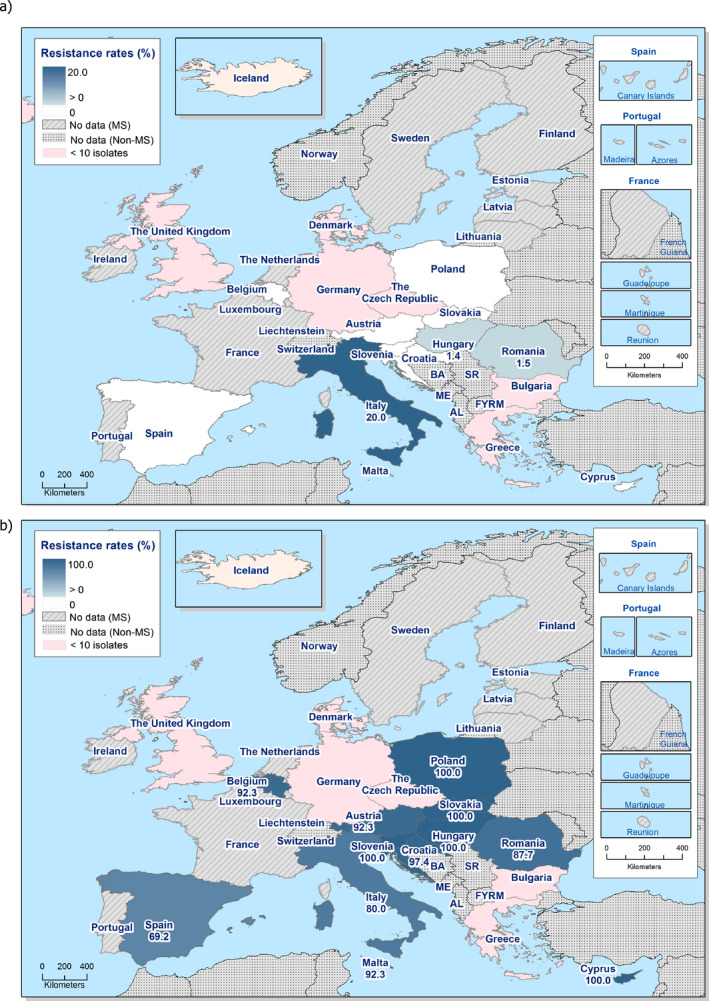
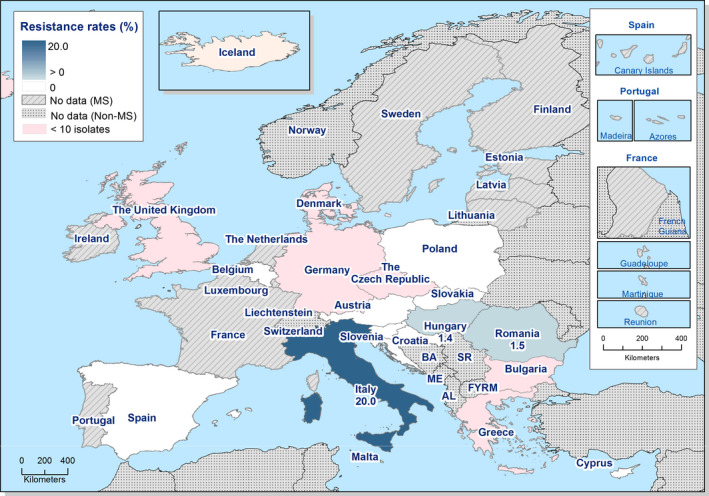
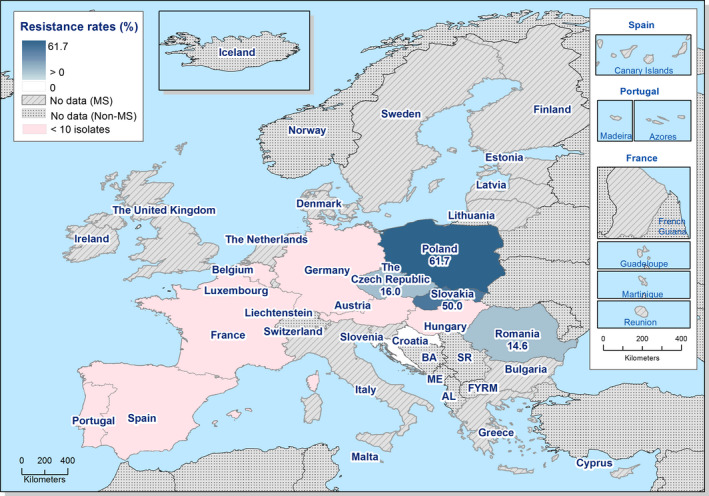
Statistical significance of trends over 4‐5 or more years was tested by a logistic regression model (p ≤ 0.05). Statistically significant increasing trends were observed for ampicillin in the Czech Republic, Italy and Spain, for ciprofloxacin and nalidixic acid in Austria, Italy, Poland, Romania and Slovenia, for cefotaxime in Italy and Romania, as well as for tetracycline in Austria, Denmark, Italy, Poland, Romania, Slovenia and Spain.
Statistically significant decreasing trends were observed for ampicillin in Austria and France, for ciprofloxacin and nalidixic acid in Spain, for cefotaxime in the Czech Republic, Portugal and Spain, for nalidixic acid in Portugal, as well as for tetracycline in the Czech Republic and France.
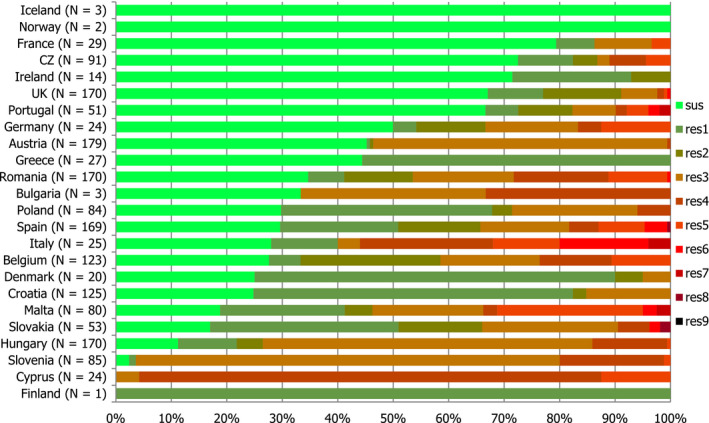
N: total number of isolates tested for susceptibility against the whole common antimicrobial set for Salmonella; sus: susceptible to all antimicrobial classes of the common set for Salmonella; res1–res9: resistance to one antimicrobial classes/resistance to nine antimicrobial classes of the common set for Salmonella.
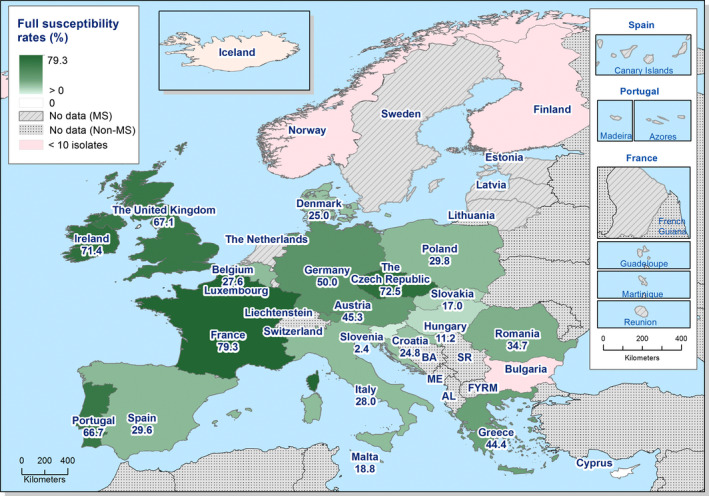
N: total number of isolates tested for susceptibility against the whole common antimicrobial set for Salmonella; sus: susceptible to all antimicrobial classes of the common set for Salmonella; res1–res9: resistance to one antimicrobial classes/resistance to nine antimicrobial classes of the common set for Salmonella.
N: total number of isolates tested for susceptibility against the whole common antimicrobial set for Salmonella; sus: susceptible to all antimicrobial classes of the common set for Salmonella; res1–res8: resistance to one antimicrobial classes/resistance to eight antimicrobial classes of the common set for Salmonella.
N: total number of isolates tested for susceptibility against the whole common antimicrobial set for Salmonella; sus: susceptible to all antimicrobial classes of the common set for Salmonella; res1–res7: resistance to one antimicrobial classes/resistance to seven antimicrobial classes of the common set for Salmonella.
N: total number of isolates tested for susceptibility against the whole common antimicrobial set for Salmonella; sus: susceptible to all antimicrobial classes of the common set for Salmonella; res1–res9: resistance to one antimicrobial classes/resistance to nine antimicrobial classes of the common set for Salmonella.
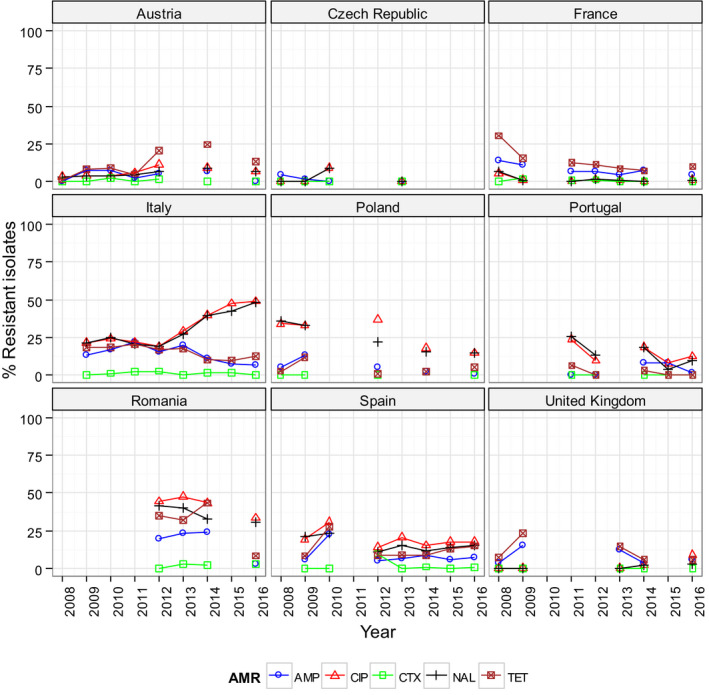
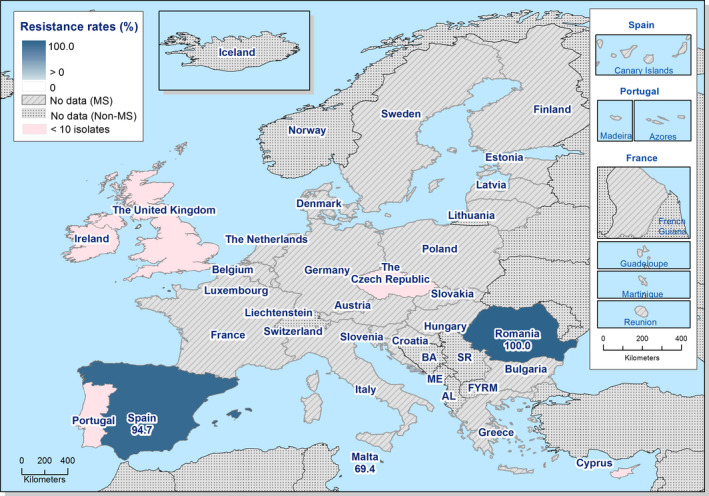
Statistical significance of trends over 4‐5 or more years was tested by a logistic regression model (p ≤ 0.05). Statistically significant increasing trends were observed for ampicillin in Romania, for ciprofloxacin in the United Kingdom, for ciprofloxacin and nalidixic acid in Italy and Romania, as well as for tetracycline in Austria.
Statistically significant decreasing trends were observed for ampicillin in France, Greece, Italy, Poland and Spain, for ciprofloxacin and nalidixic acid in France, Greece, Poland and Spain, for cefotaxime in Italy and Spain, for nalidixic acid in Portugal, as well as for tetracycline in France, Greece, Italy, Portugal and Romania.
N: total number of isolates tested for susceptibility against the whole common antimicrobial set for Salmonella;
CZ : the Czech Republic;UK : the United Kingdom; sus: susceptible to all antimicrobial classes of the common set for Salmonella; res1–res9: resistance to one antimicrobial classes/resistance to nine antimicrobial classes of the common set for Salmonella.
N: total number of isolates tested for susceptibility against the whole common antimicrobial set for Salmonella;
UK : the United Kingdom; sus: susceptible to all antimicrobial classes of the common set for Salmonella; res1–res7: resistance to one antimicrobial classes/resistance to seven antimicrobial classes of the common set for Salmonella.
Statistical significance of trends over 4‐5 or more years was tested by a logistic regression model (p ≤ 0.05). Statistically significant increasing trends were observed for ampicillin in the Czech Republic, Germany, Italy, Latvia, Portugal, Romania, Slovakia and Spain, for ciprofloxacin in Spain, for ciprofloxacin and nalidixic acid in Austria, Germany, Italy, Romania, Slovakia and Slovenia, for cefotaxime in Italy, Romania and Slovakia, for nalidixic acid in Hungary, as well as for tetracycline in Austria, Denmark, Germany, Hungary, Italy, Slovenia, Slovakia and Spain.
Statistically significant decreasing trends were observed for ampicillin in Austria, Belgium, Croatia, Greece, Hungary, the Netherlands, Poland, Slovenia and the United Kingdom, for ciprofloxacin and nalidixic acid in Belgium, Greece, the Netherlands, Poland and the United Kingdom, for cefotaxime in Belgium, Croatia, Germany, Greece, Hungary, the Netherlands, Slovenia, Spain and the United Kingdom, for nalidixic acid in Portugal and Spain, as well as for tetracycline in the Czech Republic, France, Greece, the Netherlands, Portugal, Romania and the United Kingdom.
N: total number of isolates tested for susceptibility against the whole common antimicrobial set for Salmonella;
CZ : the Czech Republic,UK : the United Kingdom; sus: susceptible to all antimicrobial classes of the common set for Salmonella; res1–res9: resistance to one antimicrobial classes/resistance to nine antimicrobial classes of the common set for Salmonella.
Statistical significance of trends over 4‐5 or more years was tested by a logistic regression model (p ≤ 0.05).
Statistically significant increasing trends were observed for ampicillin in Spain, for ciprofloxacin and nalidixic acid in the Czech Republic, France, Hungary and Italy, for nalidixic acid in Austria, Spain and the United Kingdom, as well as for tetracycline in Hungary, Italy, Spain and the United Kingdom.
Statistically significant decreasing trends were observed for ampicillin in the Czech Republic, Germany, Hungary, Italy, Poland and the United Kingdom, for ciprofloxacin in Austria, Spain and the United Kingdom, for cefotaxime in Hungary and Spain, for nalidixic acid in Germany and Poland, as well as for tetracycline in the Czech Republic and France.
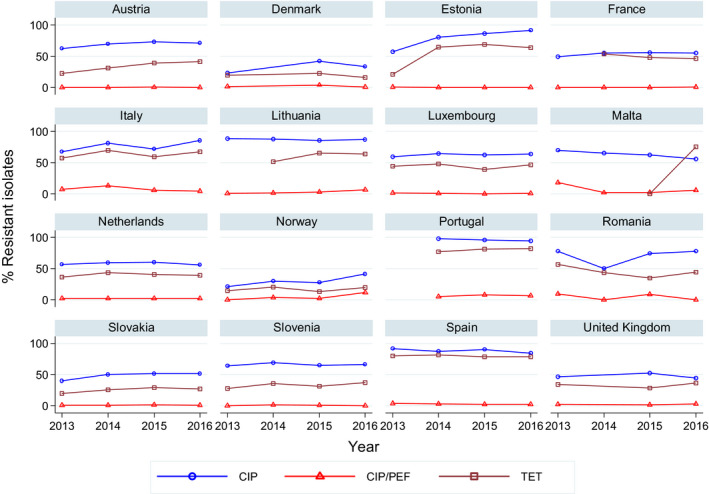
Statistically significant increasing trends over 3–4 years, as tested by logistic regression (p ≤ 0.05), were observed for ciprofloxacin in Austria, Estonia, France, Italy and Norway, for erythromycin in Lithuania, Norway and the United Kingdom and for tetracycline in Austria, Estonia, Italy, Lithuania and Slovenia. Statistically significant decreasing trends over 3–4 years were observed for ciprofloxacin in Malta and Spain, for erythromycin in Luxembourg and Malta. Only countries testing at least 10 isolates per year were included in the analysis.
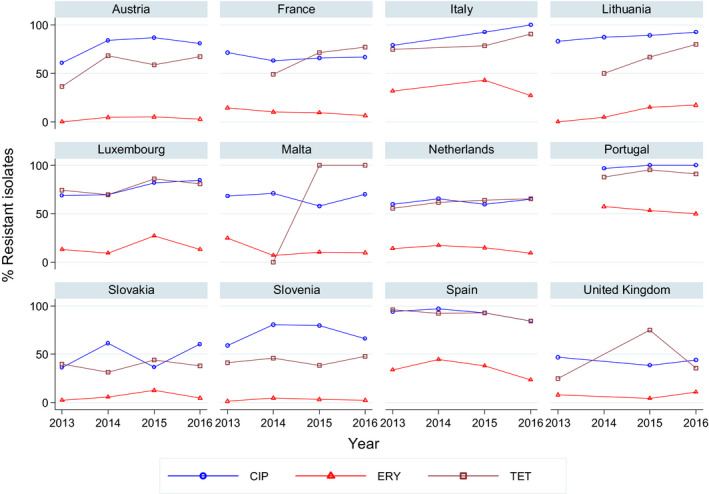
Statistically significant increasing trends over 3–4 years, as tested by logistic regression (p ≤ 0.05), were observed for ciprofloxacin in Lithuania and Luxembourg and for tetracycline in Austria, France, Lithuania, Malta, the Netherlands and the United Kingdom. Statistically significant decreasing trends over 3–4 years were observed for erythromycin in France. Only countries testing at least 10 isolates per year were included in the analysis.
Statistical significance of trends over 4‐5 or more years was tested by a logistic regression model (p ≤ 0.05).
Statistically significant increasing trends were observed for ciprofloxacin (and nalidixic acid) in Austria, the Czech Republic, Denmark, Finland, France, Germany, Hungary, the Netherlands, Spain and Switzerland, for erythromycin in the Netherlands, for gentamicin in the Netherlands and Switzerland, for streptomycin in Austria, the Czech Republic, the Netherlands and Switzerland, as well as for tetracycline in Austria, the Czech Republic, Finland, France, Germany, Hungary, Spain, Sweden and Switzerland.
Statistically significant decreasing trends were observed for ciprofloxacin in Slovenia, for erythromycin in Hungary and Spain, for gentamicin in Hungary and Spain, for streptomycin in Italy and Spain, as well as for tetracycline in the Netherlands.

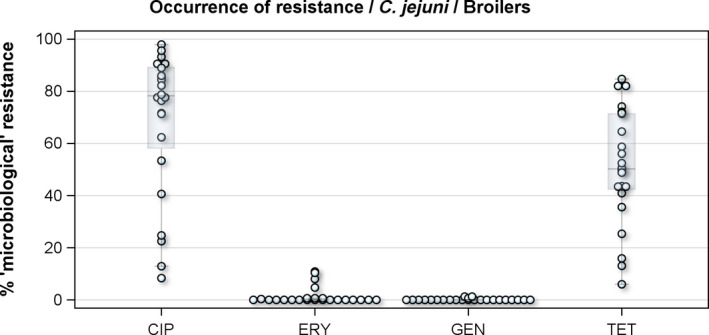
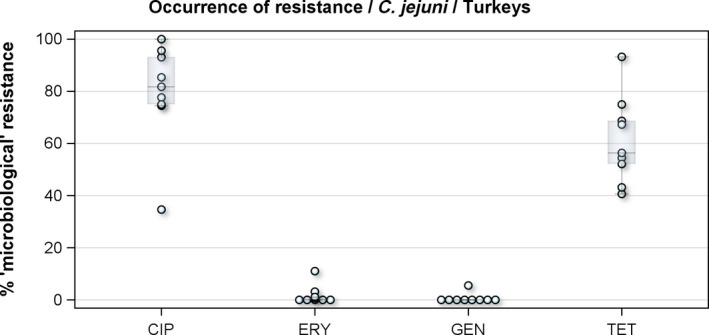
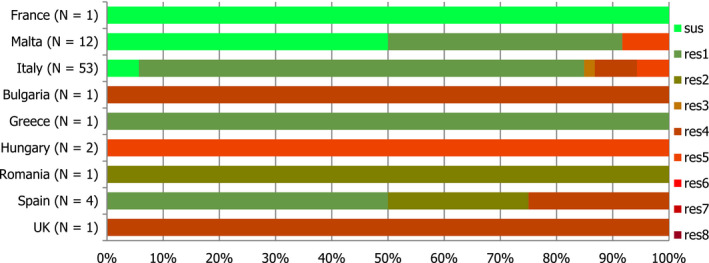
N: total number of isolates tested for susceptibility against the whole harmonised set of antimicrobials for Campylobacter; sus: susceptible to all antimicrobial classes of the harmonised set for Campylobacter; res1–res4: resistance to one up to four antimicrobial classes of the harmonised set for Campylobacter.
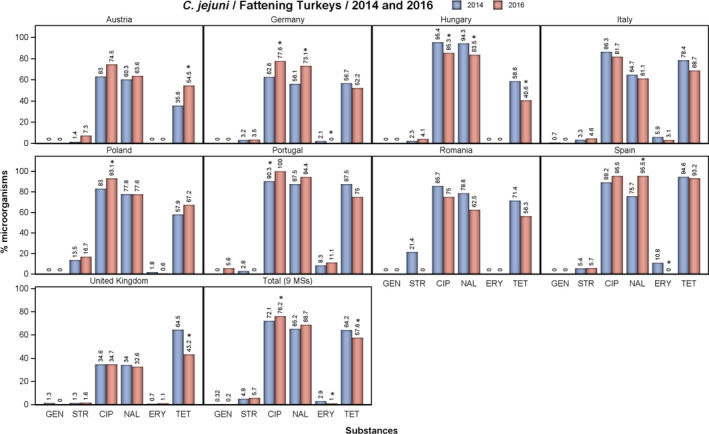
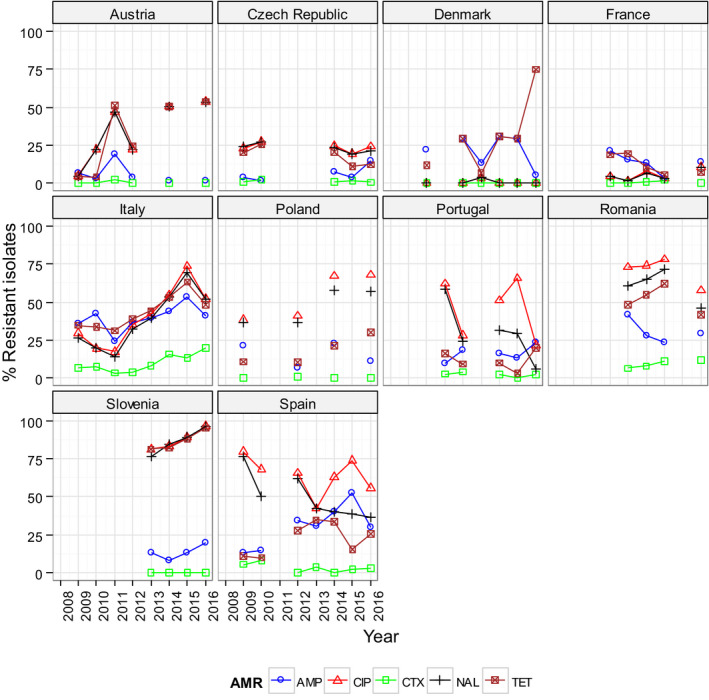
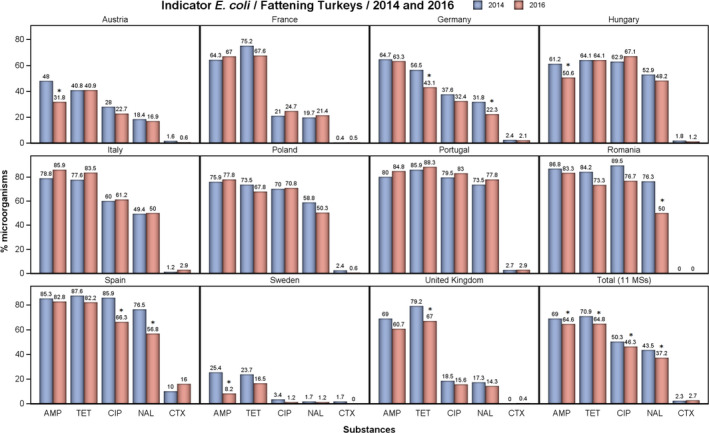
Stars indicate statistically significant changes in occurrence of resistance between 2014 and 2016.
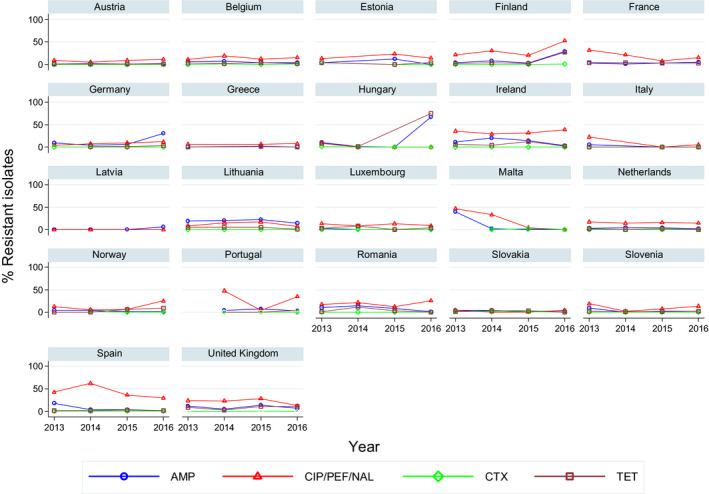
CIP : ciprofloxacin;ERY : erythromycin;GEN : gentamicin;NAL : nalidixic acid;STR : streptomycin;TET : tetracycline.
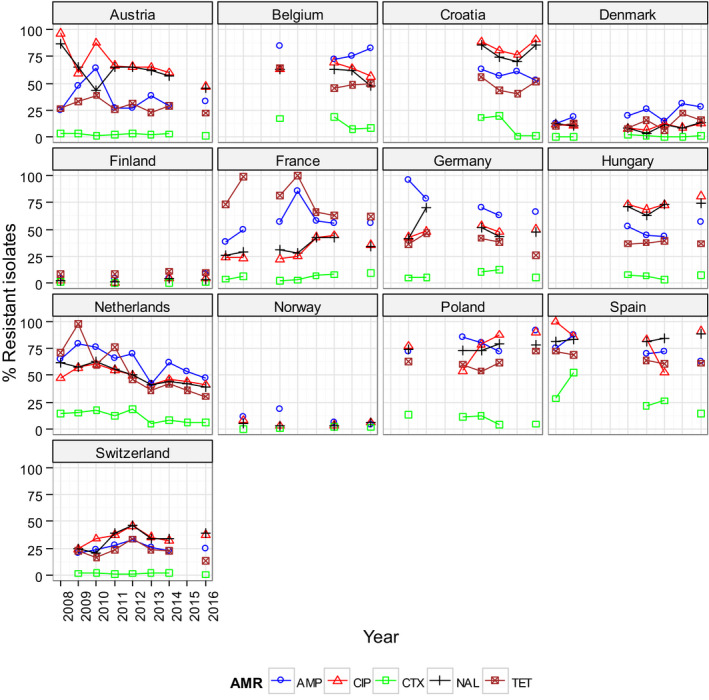
Statistical significance of trends over 4‐5 or more years was tested by a logistic regression model (p ≤ 0.05). Statistically significant increasing trends were observed for ampicillin in Belgium, Denmark, France and Poland, for ciprofloxacin in Finland, France, Hungary, Poland and Switzerland, for cefotaxime in France, as well as for tetracycline in Poland.
Statistically significant decreasing trends were observed for ampicillin in Austria, Germany, Hungary, the Netherlands, Norway and Spain, for ciprofloxacin in Austria, Croatia, the Netherlands, Norway and Spain, for cefotaxime in Belgium, Croatia, Germany, the Netherlands, Poland and Spain, for nalidixic acid in Belgium and the Netherlands, as well as for tetracycline in Austria, Belgium, Croatia, France, Germany, the Netherlands, Spain and Switzerland.
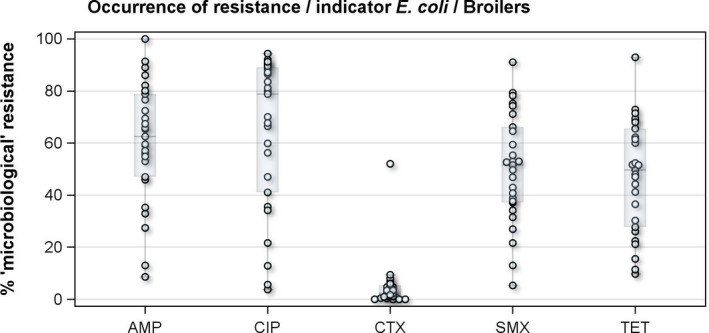
N: total number of isolates tested for susceptibility against the whole harmonised set of antimicrobials for Escherichia coli; sus: susceptible to all antimicrobial classes of the harmonised set for E. coli; res1–res9: resistance to 1 up to 11 antimicrobial classes of the harmonised set for E. coli.
Asterisks indicate statistically significant changes in occurrence of resistance between 2014 and 2016.
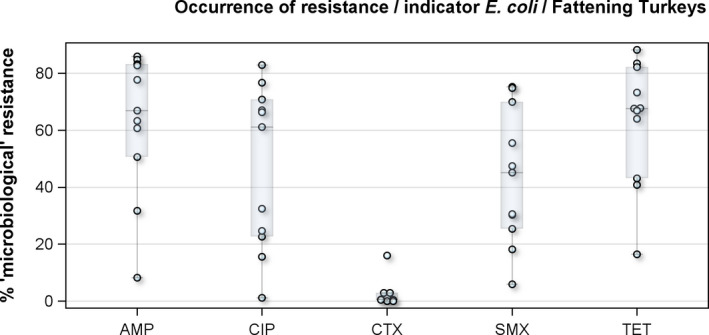
N: total number of isolates tested for susceptibility against the whole harmonised set of antimicrobials for Escherichia coli; sus: susceptible to all antimicrobial classes of the harmonised set for Escherichia coli; res1–res9: resistance to one up to 11 antimicrobial classes of the harmonised set for Escherichia coli.
MLST types have for the most part been inferred from spa‐typing data, some isolates wereMLST typed.Both spa‐types t1190 and t153 were not categorised as
CA ‐MRSA orHA ‐MRSA as further typing data includingPVL status were not reported. In total, 198MRSA isolates were spa‐typed.VCCI : At‐veterinary‐clinic clinical investigation;NHCI : Natural habitat clinical investigations;OFCI : On‐farm clinical investigations;ARM : At‐retail monitoring.
References
-
- Abdallah HM, Reuland EA, Wintermans BB, Al Naiemi N, Koek A, Abdelwahab AM, Ammar AM, Mohamed AA and Vandenbroucke‐Grauls CM, 2015. Extended‐spectrum beta‐lactamases and/or carbapenemases‐producing Enterobacteriaceae isolated from retail chicken meat in Zagazig Egypt. PLoS ONE, 10, e0136052. - PMC - PubMed
-
- Aviv G, Tsyba K, Steck N, Salmon‐Divon M, Cornelius A, Rahav G, Grassl GA and Gal‐Mor O, 2014. A unique megaplasmid contributes to stress tolerance and pathogenicity of an emergent Salmonella enterica serovar Infantis strain. Environmental Microbiology, 16, 977–994. 10.1111/1462-2920.12351 - DOI - PubMed
-
- Bartels MD, Larner‐Svensson H, Meiniche H, Kristoffersen K, Schønning K, Nielsen JB, Rohde SM, Christensen LB, Skibsted AW, Jarløv JO, Johansen HK, Andersen LP, Petersen IS, Crook DW, Bowden R, Boye K, Worning P and Westh H, 2015. Monitoring meticillin resistant Staphylococcus aureus and its spread in Copenhagen, Denmark, 2013, through routine whole genome sequencing. Euro Surveillance, 20, pii=21112. - PubMed
LinkOut - more resources
Full Text Sources