

The European Union One Health 2018 Zoonoses Report
- PMID: 32626211
- PMCID: PMC7055727
- DOI: 10.2903/j.efsa.2019.5926
The European Union One Health 2018 Zoonoses Report
Abstract
This report of the European Food Safety Authority and the European Centre for Disease Prevention and Control presents the results of zoonoses monitoring activities carried out in 2018 in 36 European countries (28 Member States (MS) and 8 non-MS). The first and second most commonly reported zoonoses in humans were campylobacteriosis and salmonellosis, respectively. The European Union (EU) trend for confirmed human cases of these two diseases was stable during 2014-2018. The proportion of human salmonellosis cases due to Salmonella Enteritidis was at the same level in 2018 as in 2017. Of the 27 reporting MS, 16 met all Salmonella reduction targets for poultry, whereas 11 MS failed meeting at least one. The EU flock prevalence of target Salmonella serovars in breeding hens, laying hens, broilers and fattening turkeys decreased during recent years but stalled in breeding turkeys. Salmonella results from Competent Authorities for pig carcasses and for poultry tested through National Control Programmes were more frequently positive compared with food business operators. Shiga toxin-producing Escherichia coli (STEC) infections in humans were the third most commonly reported zoonosis in the EU and increased from 2014 to 2018. Yersiniosis was the fourth most frequently reported zoonosis in humans in 2018 with a stable trend in 2014-2018. The number of reported confirmed listeriosis cases further increased in 2018, despite Listeria rarely exceeding the EU food safety limit tested in ready-to-eat food. In total, 5,146 food- and waterborne outbreaks were reported. Salmonella was the most commonly detected agent with S. Enteritidis causing one in five outbreaks. Salmonella in eggs and egg products was the highest risk agent/food pair. A large increase of human West Nile virus infections was reported in 2018. The report further updates on bovine tuberculosis, Brucella, Trichinella, Echinococcus, Toxoplasma, rabies, Coxiella burnetii (Q fever) and tularaemia.
Keywords: Campylobacter; Listeria; Salmonella; food‐borne outbreaks; monitoring; parasites; zoonoses.
© 2019 European Food Safety Authority and European Centre for Disease Prevention and Control.
Figures

Note: The total number of confirmed cases is indicated between parentheses at the end of each bar.
1Exception: West Nile fever where the total number of cases was used.

Source(s): Austria, Cyprus, the Czech Republic, Denmark, Estonia, Finland, France, Germany, Hungary, Iceland, Ireland, Italy, Latvia, Lithuania, Luxembourg, Malta, the Netherlands, Norway, Poland, Romania, Slovakia, Slovenia, Spain, Sweden and the United Kingdom. Belgium, Bulgaria, Croatia, Greece and Portugal did not report data to the level of detail required for the analysis.

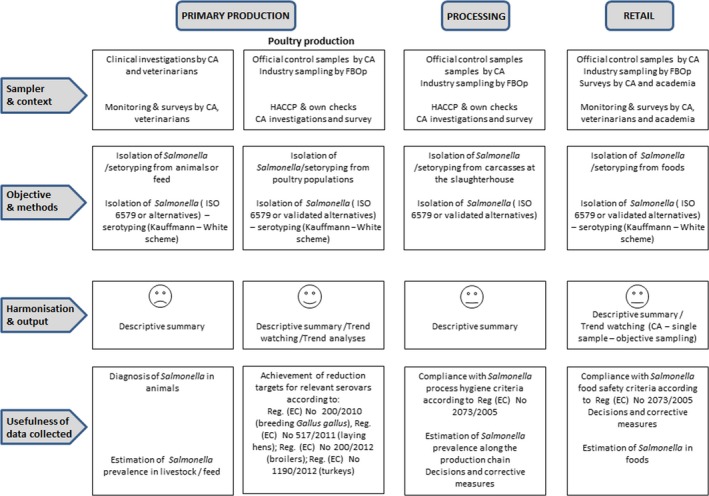
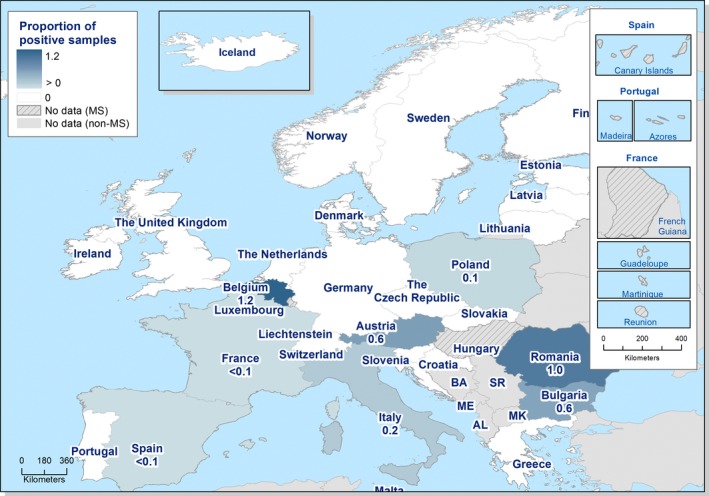
On the left side of the infographic are shown: a) Map of the salmonellosis notification rates per 100,000 population in the EU/EFTA; b) the single Member States’ prevalence in the context of NCP in poultry compared to the European reduction target for laying hens (2%) and other poultry species (1%); c) the trends of the prevalence of poultry flocks positive for Salmonella target serovars in the context of NCP, and d) the comparisons between the results of the CA and FBOp data in the context of the NCP; on the right side: e) the geographical distribution of the human top‐5 Salmonella serovars isolates coming from food and animal matrices, and f) the distribution of human top‐5 Salmonella serovars isolates according to different food and animal matrices.

Source: Austria, Belgium, Cyprus, the Czech Republic, Denmark, Estonia, Finland, France, Germany, Greece, Hungary, Iceland, Ireland, Italy, Lithuania, Luxembourg, Latvia, Malta, the Netherlands, Norway, Poland, Portugal, Romania, Slovakia, Slovenia, Spain, Sweden and the United Kingdom. Bulgaria and Croatia did not report data to the level of detail required for the analysis.


Red vertical bars indicate the target to be reached, which was fixed at 1% for all categories with the exception of laying hens for which it was 2% for all MS with the exception of Poland, for which it was 3.1%.

AL: Albania; BA: Bosnia and Herzegovina; ME: Montenegro; MK: the Republic of North Macedonia; and SR: Serbia.
AL: Albania; BA: Bosnia and Herzegovina; ME: Montenegro; MK: the Republic of North Macedonia; and SR: Serbia.

AL: Albania; BA: Bosnia and Herzegovina; ME: Montenegro; MK: the Republic of North Macedonia; and SR: Serbia.

AL: Albania; BA: Bosnia and Herzegovina; ME: Montenegro; MK: the Republic of North Macedonia; and SR: Serbia.

AL: Albania; BA: Bosnia and Herzegovina; ME: Montenegro; MK: the Republic of North Macedonia; and SR: Serbia.

AL: Albania; BA: Bosnia and Herzegovina; ME: Montenegro; MK: the Republic of North Macedonia; and SR: Serbia.

AL: Albania; BA: Bosnia and Herzegovina; ME: Montenegro; MK: the Republic of North Macedonia; and SR: Serbia.

AL: Albania; BA: Bosnia and Herzegovina; ME: Montenegro; MK: the Republic of North Macedonia; and SR: Serbia.

AL: Albania; BA: Bosnia and Herzegovina; ME: Montenegro; MK: the Republic of North Macedonia; and SR: Serbia.


Source(s): Austria, the Czech Republic, Denmark, Estonia, Finland, Germany, Greece, Hungary, Ireland, Italy, Latvia, Malta, the Netherlands, Portugal, Slovakia, Spain, Sweden and the United Kingdom. Belgium, Bulgaria, Cyprus, Croatia, France, Lithuania, Luxembourg, Poland, Romania and Slovenia did not report data to the level of detail required for the analysis.

The left side of the diagram shows the five commonest reported Salmonella serovars from human salmonellosis cases acquired in the EU: S. Infantis (blue), S. Typhimurium (green), S. Enteritidis (pink), monophasic S. Typhimurium (yellow) and S. Derby (violet). Animal and food data from the same source were merged: ‘broiler’ includes isolates from broiler flocks and broiler meat, ‘cattle’ includes isolates from bovines for meat production and bovine meat, ‘pig’ includes isolates from fattening pigs and pig meat, ‘turkey’ includes isolates from fattening turkey flocks and turkey meat and ‘layers’ includes laying hen flocks and eggs. The right side shows the five sources considered (broiler, cattle, pig, turkey and layers). The width of the coloured bands linking sources and serovars is proportional to the percentage of isolation of each serovar from each source.
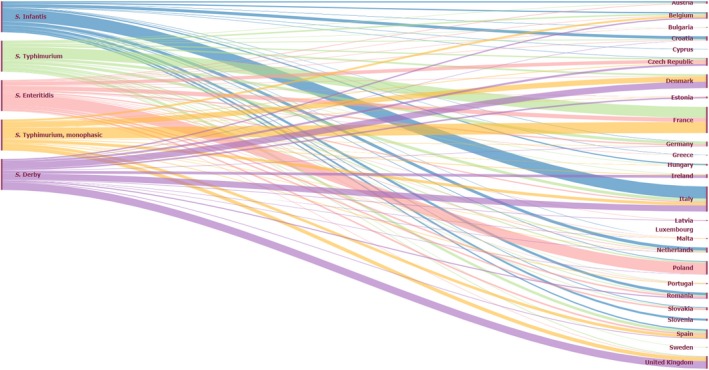
The left side of the diagram shows the five commonest reported Salmonella serovars from human salmonellosis cases acquired in the EU: S. Infantis (blue), S. Typhimurium (green), S. Enteritidis (pink), monophasic S. Typhimurium (yellow) and S. Derby (violet). The right side shows the reporting MS. The width of the coloured bands linking MSs and serovars is proportional to the percentage of isolation of each serovar reported from each MS.

The percentages were calculated on the total number of isolates serotyped for each of the five animal/food categories (bovine, broiler, layers, pig and turkey). The values at the top of each box are the numbers of Salmonella serovar isolates and the numbers in parentheses are the number of reporting MS, for animal matrices (grey) and food matrices (black). Each plot shows the percentage of isolates belonging to the reported serovar out of the total number of serotyped isolates.

CA: Competent Authority; FBOp: Food business operator; Lm: Listeria monocytogenes; MS: Member State; RTE: ready‐to‐eat.

Source: Austria, Belgium, Cyprus, the Czech Republic, Denmark, Estonia, Finland, France, Germany, Greece, Hungary, Iceland, Ireland, Italy, Latvia, Lithuania, Malta, the Netherlands, Norway, Poland, Romania, Slovakia, Slovenia, Spain, Sweden and the United Kingdom. Bulgaria, Croatia, Luxembourg and Portugal did not report data to the level of detail required for the analysis.

(a): Number of sampling units tested by the MS for the corresponding category and year.
(b): Number of MS which have reported tested sampling units for the corresponding category and year.
Over the period 2016–2018, testing was reported by the following countries: for RTE fish products: AT, BE, BG, HR, CY, CZ, DK, EE, DE, GR, HU, IR, IT, LV, LU, LT, NL, PL, PT, SK, SI, ES, SE, ME, IS and MK; for RTE fishery products: AT, BE, BG, HR, CY, CZ, DK, EE, DE, GR, HU, IT, IR, LU, LT, NL, PL, PT, RO, SK, ES, SE, IS, ME and MK.
‘fish, RTE’ includes data on ‘fish’ of the following types: ‘chilled’, ‘cooked‐chilled’, ‘gravad/slightly salted’, ‘marinated’ and ‘smoked – cold‐smoked’, ‘smoked – hot‐smoked’, ‘smoked’.
‘fishery products, RTE’ includes the following types: ‘crustaceans – prawns – cooked’, ‘crustaceans – lobsters – cooked’, ‘crustaceans – unspecified – cooked’, ‘crustaceans – shrimps – shelled, shucked and cooked’, ‘crustaceans – unspecified – shelled, shucked and cooked’, ‘crustaceans – shrimps – cooked’, ‘fish – fishery products from fish species associated with a high amount of histidine – not enzyme maturated’, ‘fish – fishery products from fish species associated with a high amount of histidine – which have undergone enzyme maturation treatment in brine’, ‘fishery products, unspecified – cooked’, ‘fishery products, unspecified – RTE – chilled’, ‘fishery products, unspecified – smoked’, ‘fishery products, unspecified – RTE’, ‘molluscan shellfish – shelled, shucked and cooked’, ‘molluscan shellfish – cooked’, ‘molluscan shellfish – cooked – frozen’, ‘Surimi – frozen’, ‘surimi – chilled’, ‘surimi’.

(a): Number of samples tested by the MS for the corresponding category and year.
(b): Number of MS which have reported tested samples for the corresponding category and year.
Over the period 2016–2018, meat and meat products testing was reported by the following countries: pig meat: AT, BE, BG, HR, CY, CZ, DK, EE, DE, GR, IT, LV, PL, PT, RO, SK, ES and MK; turkey meat: AT, CY, DE, GR, PL, PT, SK and ES; broiler meat: BG, CZ, EE, DE, PL, RO, ES and MK; bovine meat: AT, BE, BG, CZ, DK, EE, DE, GR, LU, NL, PL, RO, SK and MK.
Since data were mostly reported by a limited number of MS and are of a heterogeneous nature as these include various diverse subcategories, the findings presented in this figure may not be representative of the EU level or directly comparable across years. RTE pig meat products includes ‘Meat from pig, meat products’ of the following types: ‘cooked ham’, ‘cooked, RTE’, ‘fermented sausages’, ‘pâté’, ‘raw and intended to be eaten raw’, ‘raw ham’, ‘unspecified, ready‐to‐eat’ and ‘ready‐to‐eat’ and ‘meat from pig – meat preparation’ of the following type ‘intended to be eaten raw’. ‘RTE turkey meat’ includes turkey ‘meat products’ of the following types: ‘cooked, RTE’, ‘ready‐to‐eat’ and ‘raw and intended to be eaten raw’. ‘RTE broiler meat’ includes broiler ‘meat products’ of the following types: ‘cooked, RTE’. ‘RTE bovine meat’ includes ‘meat from bovine animals, meat products’ of the following types: ‘cooked, RTE’, ‘fermented sausages’, ‘raw and intended to be eaten raw’, ‘pâté’; ‘ready‐to‐eat’; and ‘unspecified, RTE’; ‘meat from bovine animals, meat preparation’ of the following types: ‘intended to be eaten raw’ and ‘meat from bovine animals, minced meat’ of the following types: ‘intended to be eaten raw’.

LHT: low heat treated. ‘Overall’ and the number of MS correspond to data across all major sampling stages (‘retail’ + ‘processing’ + ‘farm’ + ‘border inspection activities’ + ‘unspecified’). ‘Retail’ corresponds to data obtained from catering, hospital or medical care facilities, retail, wholesale and restaurants or cafes or pubs or bars or hotels or catering services. For each sampling stage (‘overall’, ‘retail’ and ‘processing’), data are pooled across both types of sampling units (‘single’ and ‘batch’). ‘Processing’ corresponds to data obtained from packing centres, cutting plants and processing plants. Since data were mostly reported by a limited number of MS, the findings presented in this figure may not be presentative of the EU level.
‘Hard cheeses pasteurised milk’ and ‘hard cheeses from raw or low heat‐treated milk’ includes cheeses made from cows’ milk, sheep's milk, goats’ milk, mixed milk from cows, sheep and/or goats and unspecified milk or other animal milk.
‘Soft and semi‐soft cheeses’ includes both soft and semi‐soft and fresh cheese made from cows’ milk, sheep's milk, goats’ milk, mixed milk from cows, sheep and/or goats and unspecified milk or other animal milk.

Source: Austria, Cyprus, Denmark, Estonia, Finland, France, Germany, Greece, Hungary, Iceland, Ireland, Italy, Latvia, Lithuania, Luxembourg, Malta, the Netherlands, Norway, Poland, Romania, Slovakia, Slovenia, Spain, Sweden and the United Kingdom. Belgium, Bulgaria, the Czech Republic, Croatia and Portugal did not report data to the level of detail required for the analysis.

Note: The presence (red boxes) and absence (white boxes) of STEC serogroups in foods (left) and animals (right). The E. coli O104:H4 stx2+eae‐ was isolated from sprouted seeds in 2015.

Proportions of STEC serogroups: red boxes > 1%, orange boxes > 0.1% and ≤ 1%, yellow boxes > 0.0001% and ≤ 0.1% of positive samples. White boxes indicate absence of the serogroup.
The category ‘other ruminants meat’ includes meat from deer; ‘other meat’ includes meat from animals other than ruminants; ‘milk and dairy products’ include any type of dairy product, cheese and milk other than raw milk; ‘raw milk’ includes raw milk from different species, but most tested samples were from cows; ‘seeds’ includes mostly sprouted seeds, but dry seeds are also included.
Source: Twenty‐two MS plus one non‐MS.

Proportions of STEC serogroups: red boxes > 1%, orange boxes > 0.1% and ≤ 1%, yellow boxes > 0.0001% and ≤ 0.1% of positive samples. White boxes indicate absence of the serogroup. The category ‘other ruminants’ includes deer; ‘other animals’ comprises pigeons, cats, chinchillas, dogs, ferrets, foxes, Gallus gallus, guinea pigs, hedgehogs, mice, rabbits, rats solipeds, water buffalos, weasels and wild boars.
Source: six MS.

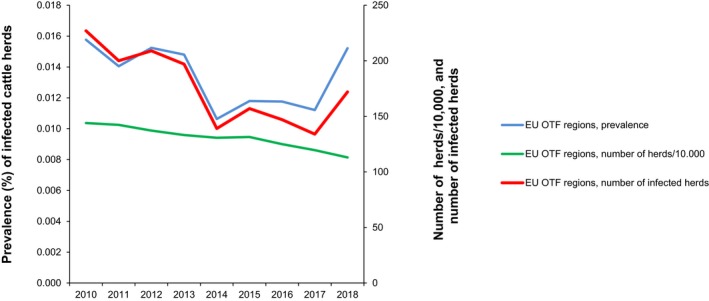
OTF: Officially bovine tuberculosis free in cattle.

OTF: Officially bovine tuberculosis free in cattle.


Source: Austria, Cyprus, the Czech Republic, Estonia, Finland, France, Germany, Greece, Hungary, Iceland, Ireland, Italy, Latvia, Lithuania, Malta, the Netherlands, Norway, Poland, Portugal, Romania, Slovakia, Slovenia, Spain and Sweden. Belgium, Bulgaria, Croatia, Luxembourg and the United Kingdom did not report data to the level of detail required for the analysis. Denmark does not have a surveillance system for this disease.

OBF: Officially brucellosis free in cattle.

Non‐OBF: Non‐officially brucellosis free in cattle.


ObmF: Officially B. melitensis free in sheep and goats.

Non‐ObmF: Non‐officially B. melitensis free in sheep and goats.


Source: Austria, Cyprus, the Czech Republic, Estonia, Finland, Germany, France, Greece, Hungary, Ireland, Italy, Latvia, Lithuania, Luxembourg, Malta, the Netherlands, Norway, Poland, Portugal, Romania, Slovakia, Slovenia, Spain, Sweden and the United Kingdom. Belgium, Bulgaria, Croatia and Iceland did not report data to the level of detail required for the analysis. Denmark does not have any formal surveillance system for the disease.

Countries in which human cases were reported due to FBO (EFSA data) are in colour according the food vehicle causing the outbreaks (‘pig meat’, ‘wild boar meat’ or ‘unknown’ food vehicle). The number of cases in each country indicates domestic trichinellosis cases (ECDC data); numbers in green box indicate the travel‐related trichinellosis human cases.

These distribution maps have been built based on data from reports (EFSA and ECDC, 2015a,b, 2016, 2017b, 2018a,b,c,d).


Source: Austria, the Czech Republic, Estonia, France, Germany, Hungary, Latvia, Lithuania, Norway, Poland, Sweden and Slovakia. Belgium, Bulgaria, Croatia, Cyprus, Denmark, Finland, Greece, Iceland, Italy, Ireland, Luxembourg, Malta, the Netherlands, Portugal, Romania, Slovenia, Spain and the United Kingdom did not report data to the level of detail required for the analysis.

Source: Austria, the Czech Republic, Estonia, Finland, France, Germany, Greece, Hungary, Ireland, Latvia, Lithuania, Malta, Norway, Malta, Poland, Portugal, Romania, Slovakia, Slovenia, Spain and Sweden. Belgium, Bulgaria, Croatia, Cyprus, Denmark, Iceland, Italy Luxembourg, the Netherlands and the United Kingdom did not report data to the level of detail required for the analysis.

Number of positive animals: sheep (N = 507,432), goats (N = 166,661), pigs (N = 149,913), cattle (N = 63,874), sheep and goats (N = 7,427), wild boars (N = 452), water buffalos (N = 376), domestic solipeds (N = 228), deer (N = 92), reindeer (N = 24), moose (N = 6) and mouflons (N = 2). The total number of positive animals for E. granulosus s.l. reported in this period was 896,487. Positive pigs could be overestimated in co‐endemic countries with E. multilocularis.

Intermediate hosts included in map are: cattle, deer, goats, horses, moose, mouflons, reindeer, sheep, water buffalos and wild boars.
Legend: black > 10,000 positive cases; dark blue < 1,000 positive cases; light blue < 100 cases; yellow = 0 cases reported; white = data not reported. Pigs were excluded from Poland and Germany because of the co‐endemicity with E. multilocularis.

The number of reporting MS is mentioned in parentheses.

Sweden reported one strong‐evidence listeriosis outbreak with one illness, which was due to a multicountry listeriosis outbreak.


Sweden reported one strong‐evidence listeriosis outbreak with one illness, which was due to a multicountry listeriosis outbreak.
Other bacterial agents include Aeromonas hydrophila, Escherichia coli, enteroinvasive Escherichia coli (EIEC), enterotoxigenic Escherichia coli (ETEC), Enterococcus, Leptospira spp., Shigella spp., Shigella flexneri, Shigella sonnei, Yersinia enterocolitica and other unspecified bacteria.
Other viruses include adenovirus, flavivirus, hepatitis E, rotavirus and other unspecified viruses.
Marine biotoxins include ciguatoxin and other unspecified toxins.
Other parasites include Giardia intestinalis (lamblia), Giardia spp., Taenia saginata and other unspecified parasites.
Other causative agent include atropine, lectin, monosodium glutamate, chemical agents unspecified.


Escherichia coli includes Escherichia coli (unspecified), enteroinvasive E. coli (EIEC), enterotoxigenic E. coli (ETEC). Other bacteria include Aeromonas hydrophila and other unspecified bacteria. Marine biotoxins include ciguatoxin and other unspecified toxins. Other causative agent include atropine, lectine, monosodium glutamate, chemical agents unspecified.


*Data from France are not shown because data on outbreaks by B. cereus, C. perfringens and Staphylococcus were differently coded in 2018 compared with 2017.


Other bacterial agents include Aeromonas hydrophila, Escherichia coli, enteroinvasive Escherichia coli (EIEC), enterotoxigenic Escherichia coli (ETEC), Enterococcus spp., Francisella spp., Leptospira spp., Shigella spp., Shigella flexneri, Shigella sonnei, Streptococcus spp.; Vibrio parahaemolyticus, Vibrio spp., Yersinia enterocolitica and other unspecified bacteria.
Bacterial toxins other than Clostridium botulinum include toxins produced by Bacillus, Clostridium other than Clostridium botulinum and Staphylococcus and other unspecified bacterial toxins.
Other viruses include adenovirus, flavivirus, hepatitis E, rotavirus, sapovirus and other unspecified viruses.
Other parasites include Anisakis, Giardia intestinalis (lamblia), Giardia spp., Taenia saginata and other unspecified parasites.
Marine biotoxins include ciguatoxin and other unspecified toxins.


Intensity of the line is proportional to the magnitude of outbreak reporting rate. Red boxes indicates statistically significant (p < 0.05) trends over years.

Other bacterial agents include Aeromonas hydrophila, Escherichia coli, enteroinvasive Escherichia coli (EIEC), enterotoxigenic Escherichia coli (ETEC), Enterococcus, Leptospira spp., Shigella spp., Shigella flexneri, Shigella sonnei, Yersinia enterocolitica and other unspecified bacteria.
Other viruses include adenovirus, flavivirus, Hepatitis E, rotavirus and other unspecified viruses.
Marine biotoxins include ciguatoxin and other unspecified toxins.
Other parasites include Giardia intestinalis (lamblia), Giardia spp., Taenia saginata and other unspecified parasites.
Other causative agent include atropine, lectin, monosodium glutamate, chemical agents unspecified.

Other bacterial agents include Aeromonas hydrophila, Escherichia coli, enteroinvasive Escherichia coli (EIEC), enterotoxigenic Escherichia coli (ETEC), Enterococcus, Leptospira spp., Shigella spp., Shigella flexneri, Shigella sonnei, Yersinia enterocolitica and other unspecified bacteria.
Bacterial toxins other than Clostridium botulinum include toxins produced by Bacillus, Clostridium other than Clostridium botulinum and Staphylococcus and other unspecified bacterial toxins.
Other viruses include adenovirus, flavivirus, hepatitis E, rotavirus and other unspecified viruses.
Other parasites include Giardia intestinalis (lamblia), Giardia spp., Taenia saginata and other unspecified parasites.
Marine biotoxins include ciguatoxin and other unspecified toxins.
Other causative agent include atropine, lectin, monosodium glutamate, chemical agents unspecified.
Meat and meat products include: bovine meat, pig meat, poultry meat, sheep meat, other or mixed red meat and products thereof, meat and meat products, unspecified.
Fish and fishery products include: crustaceans, shellfish, molluscs and products thereof, fish and fish products.
Other foods include: canned food products, cereal products and legumes, drinks, including bottled water, other foods, unspecified.
Food of non‐animal origin include: fruits (and juices), herbs and spices, sweets and chocolate, vegetables (and juices).
Milk and milk products include: cheese, dairy product (other than cheeses), milk.

One outbreak by Salmonella Paratyphi has been excluded.

Escherichia coli include Escherichia coli (unspecified), enteroinvasive E. coli (EIEC), enterotoxigenic E. coli (ETEC).
Other bacteria include Aeromonas hydrophila and other unspecified bacteria.


Outbreaks by viruses, Unspecified have been excluded.


Marine biotoxins include ciguatoxin and other unspecified toxins.
Other causative agent include atropine, lectin, monosodium glutamate, chemical agents unspecified.


Other settings and multiple settings include Camp or picnic, Farm, Multiple places of exposure in more than one country, Multiple places of exposure in one country, Others unspecified, Temporary mass catering (fairs or festivals).

Other settings and multiple settings include Camp or picnic, Farm, Multiple places of exposure in more than one country, Multiple places of exposure in one country, Others unspecified, Temporary mass catering (fairs or festivals).

Canteen or Catering to Workplace, school, hospital etc. include: canteen or workplace catering, catering on aircraft or ship or train.
Hospital or medical care facility, residential institution (nursing home or prison or boarding school), school or kindergarten.
Restaurant, pub, street vendors, take‐away etc. include: mobile retailer or market/street vendor, restaurant or cafe or pub or bar or hotel or catering service, take‐away or fast‐food outlet.
Other settings and multiple settings include: camp or picnic, farm, multiple places of exposure in more than one country, multiple places of exposure in one country, others, temporary mass catering (fairs or festivals).

Canteen or Catering to Workplace, school, hospital etc. include: canteen or workplace catering, catering on aircraft or ship or train.
Hospital or medical care facility, residential institution (nursing home or prison or boarding school), school or kindergarten.
restaurant, pub, street vendors, take‐away etc. include: mobile retailer or market/street vendor, restaurant or cafe or pub or bar or hotel or catering service, take‐away or fast‐food outlet.
Other settings and multiple settings include: camp or picnic, farm, multiple places of exposure in more than one country. Multiple places of exposure in one country, Others, Temporary mass catering (fairs or festivals).

Note: Norway reported four positive Arctic (polar) foxes on the Svalbard and Jan Mayen Islands.


Source(s): Cyprus, Czech Republic, Estonia, Finland, France, Germany, Greece, Hungary, Iceland, Ireland, Latvia, Lithuania, Luxembourg, Malta, the Netherlands, Norway, Poland, Portugal, Romania, Slovakia, Slovenia, Spain, Sweden and the United Kingdom. Austria, Belgium, Bulgaria, Croatia, Denmark, Italy and Switzerland did not report data to the level of detail required for the analysis.

Source: Austria, Belgium, Cyprus, Czech Republic, Estonia, Finland, France, Greece, Hungary, Ireland, Italy, Latvia, Lithuania, Luxembourg, Malta, the Netherlands, Norway, Poland, Romania, Slovakia, Slovenia, Spain, Sweden and the United Kingdom. Bulgaria, Croatia, Denmark, Germany, Iceland and Portugal did not report data to the level of detail required for the analysis.


References
-
- Alban L, Pozio E, Boes J, Boireau P, Boué F, Claes M, Cook AJC, Dorny P, Enemark HL, van der Giessen J, Hunt KR, Howell M, Kirjusina M, Nöckler K, Rossi P, Smith GC, Snow L, Taylor MA, Theodoropoulos G, Vallée I, Viera‐Pinto MM and Zimmer IA, 2011. Towards a standardised surveillance for Trichinella in the European Union. Preventive Veterinary Medicine, 99, 148–160. - PubMed
-
- Beck R, Mihaljević Ž, Brezak R, Bosnić S, Janković IL and Deplazes P, 2018. First detection of Echinococcus multilocularis in Croatia. Parasitology Research, 117, 617–621. - PubMed
LinkOut - more resources
Full Text Sources
Other Literature Sources
Miscellaneous