

The European Union summary report on antimicrobial resistance in zoonotic and indicator bacteria from humans, animals and food in 2017
- PMID: 32626224
- PMCID: PMC7009238
- DOI: 10.2903/j.efsa.2019.5598
The European Union summary report on antimicrobial resistance in zoonotic and indicator bacteria from humans, animals and food in 2017
Abstract
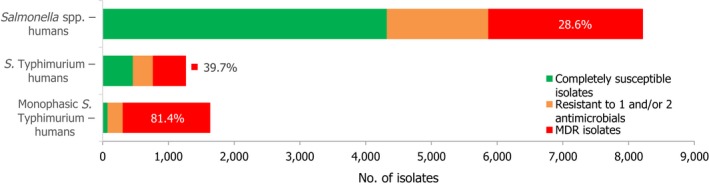
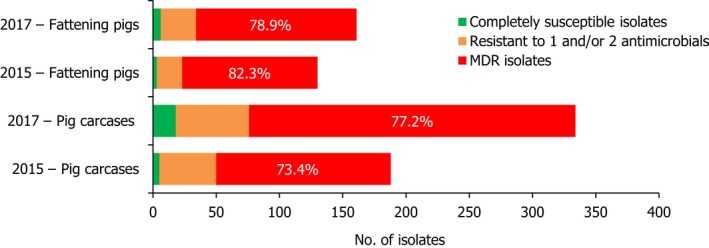
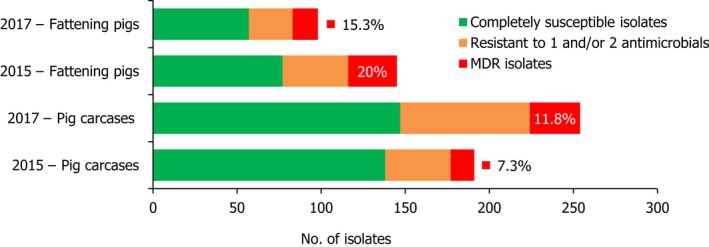
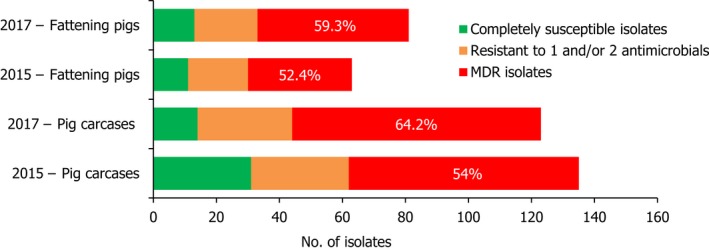
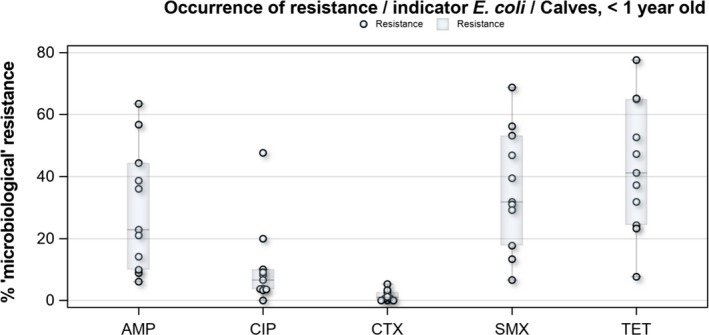
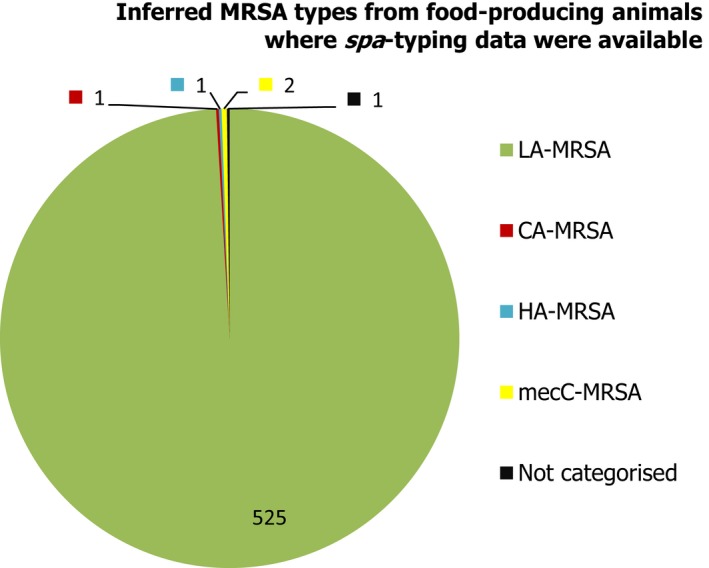
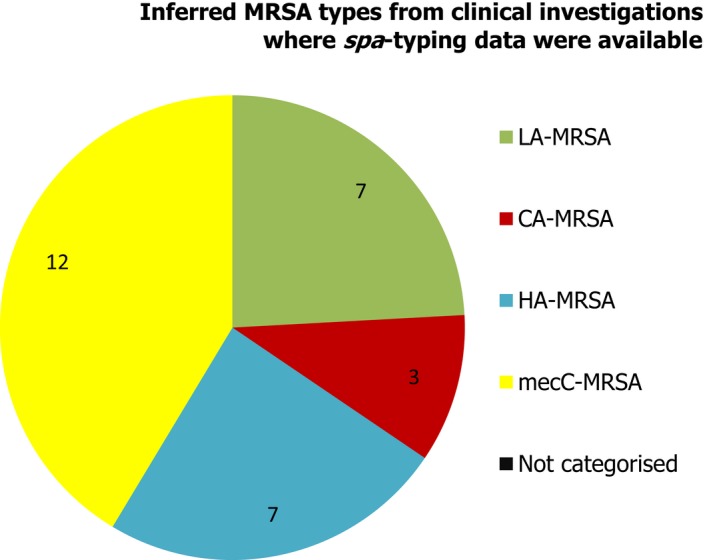
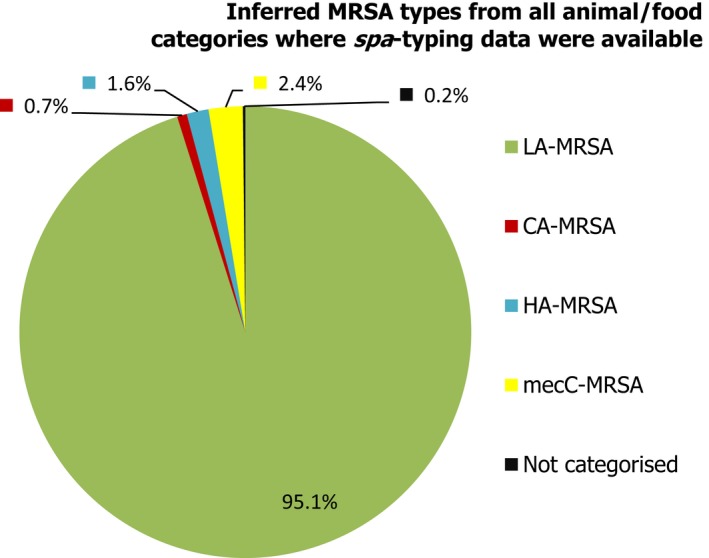
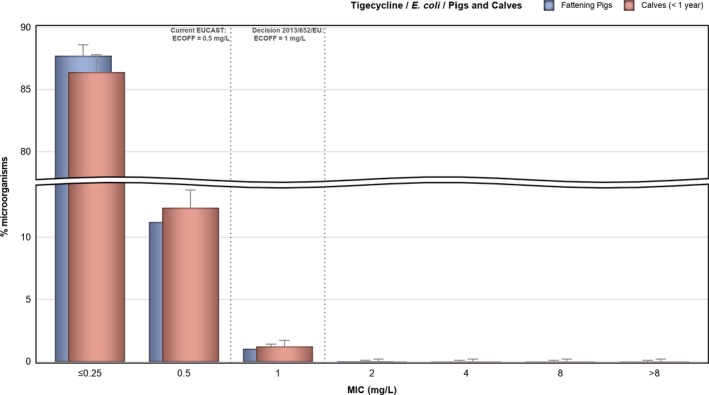
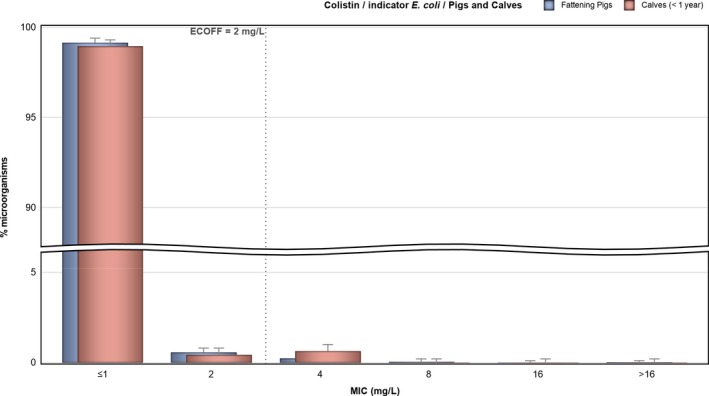
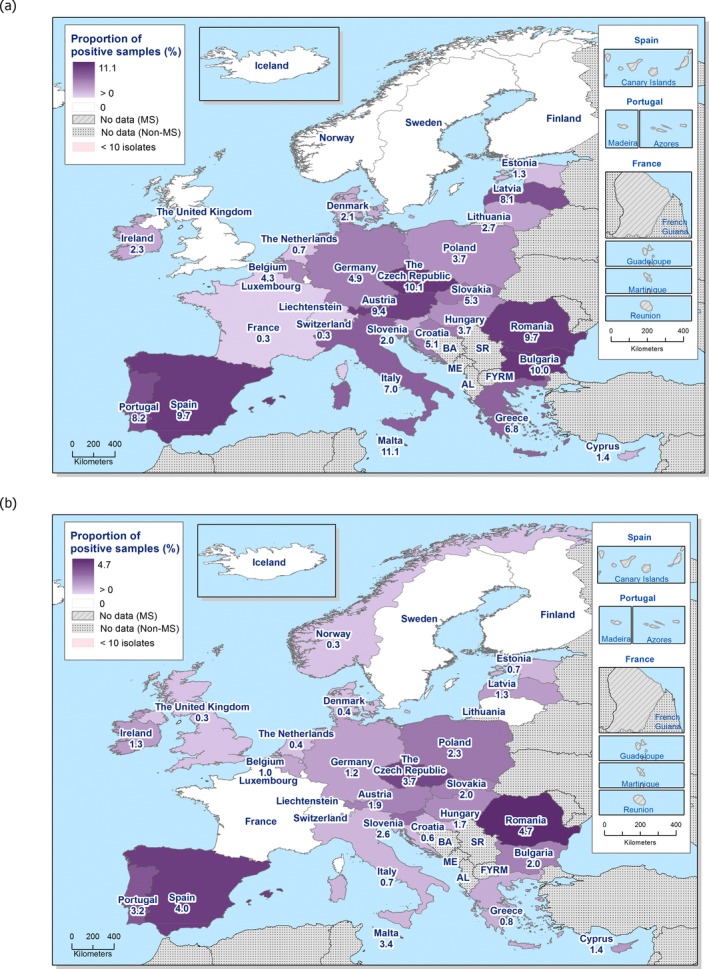
The data on antimicrobial resistance in zoonotic and indicator bacteria in 2017, submitted by 28 EU Member States (MSs), were jointly analysed by EFSA and ECDC. Resistance in zoonotic Salmonella and Campylobacter from humans, animals and food, and resistance in indicator Escherichia coli as well as meticillin-resistant Staphylococcus aureus in animals and food were addressed, and temporal trends assessed. 'Microbiological' resistance was assessed using epidemiological cut-off (ECOFF) values; for some countries, qualitative data on human isolates were interpreted in a way which corresponds closely to the ECOFF-defined 'microbiological' resistance. In Salmonella from humans, as well as in Salmonella and E. coli isolates from fattening pigs and calves of less than 1 year of age, high proportions of isolates were resistant to ampicillin, sulfonamides and tetracyclines, whereas resistance to third-generation cephalosporins was uncommon. Varying occurrence/prevalence rates of presumptive extended-spectrum beta-lactamase (ESBL)/AmpC producers in Salmonella and E. coli monitored in meat (pork and beef), fattening pigs and calves, and Salmonella monitored in humans, were observed between countries. Carbapenemase-producing E. coli were detected in one single sample from fattening pigs in one MS. Resistance to colistin was observed at low levels in Salmonella and E. coli from fattening pigs and calves and meat thereof and in Salmonella from humans. In Campylobacter from humans, high to extremely high proportions of isolates were resistant to ciprofloxacin and tetracyclines, particularly in Campylobacter coli. In five countries, high to very high proportions of C. coli from humans were resistant also to erythromycin, leaving few options for treatment of severe Campylobacter infections. High resistance to ciprofloxacin and tetracyclines was observed in C. coli isolates from fattening pigs, whereas much lower levels were recorded for erythromycin. Combined resistance to critically important antimicrobials in both human and animal isolates was generally uncommon but very high to extremely high multidrug resistance levels were observed in S. Typhimurium and its monophasic variant in both humans and animals. S. Kentucky from humans exhibited high-level resistance to ciprofloxacin, in addition to a high prevalence of ESBL.
Keywords: ESBL; antimicrobial resistance; indicator bacteria; zoonotic bacteria.
© 2019 European Food Safety Authority and European Centre for Disease Prevention and Control. EFSA Journal published by John Wiley and Sons Ltd on behalf of European Food Safety Authority.
Figures
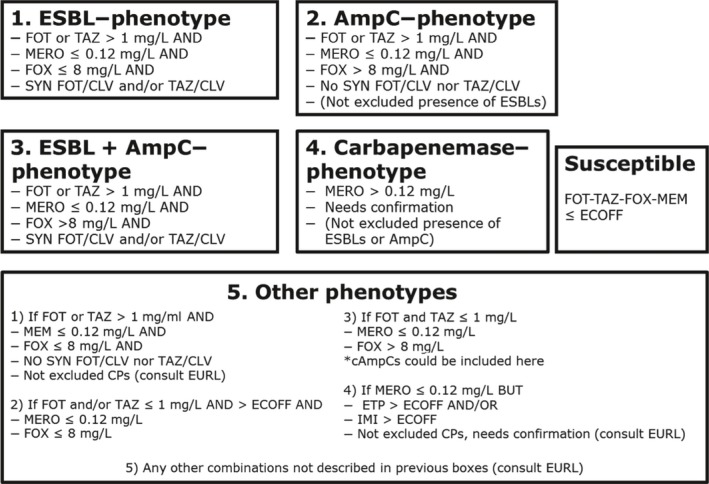
Presumptive ESBL producers include isolates exhibiting phenotype 1 or 3.
Presumptive AmpC producers include isolates exhibiting phenotype 2 or 3.
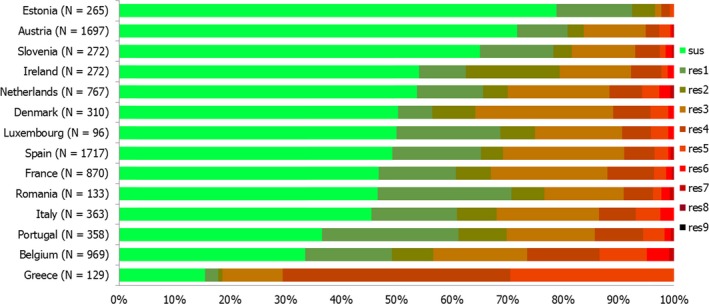
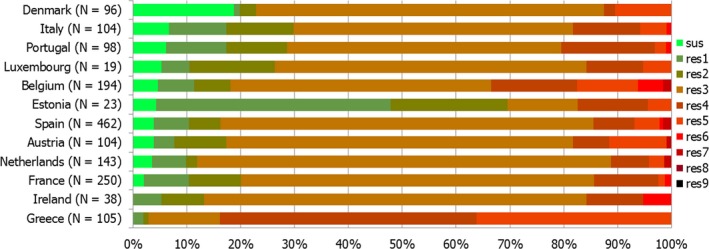
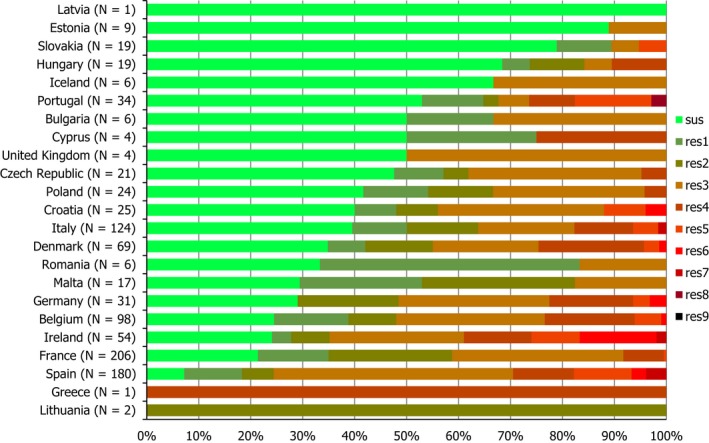
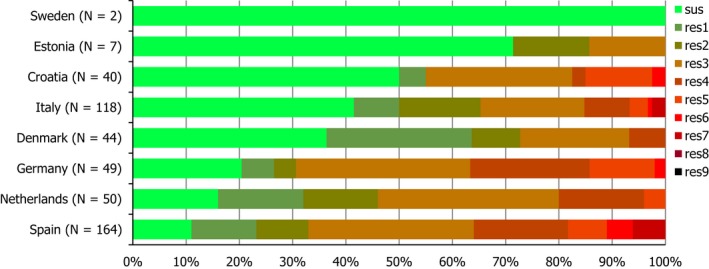
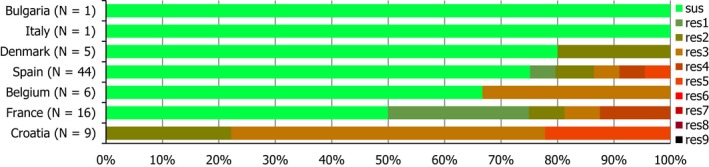
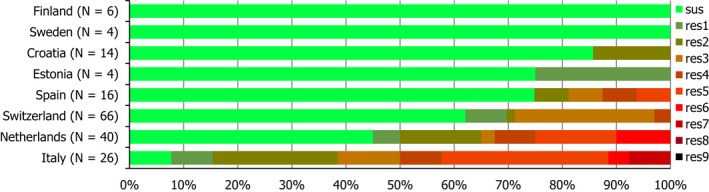
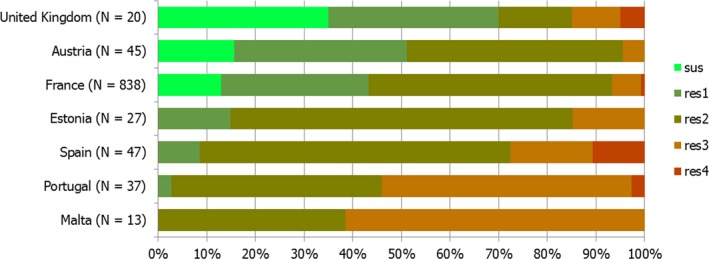
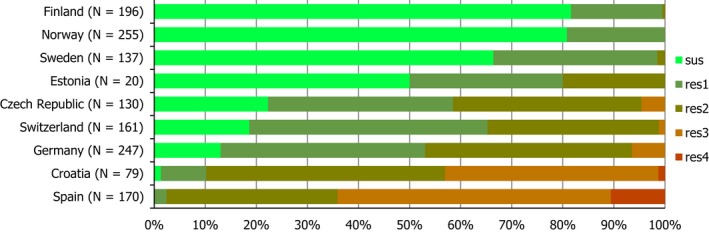
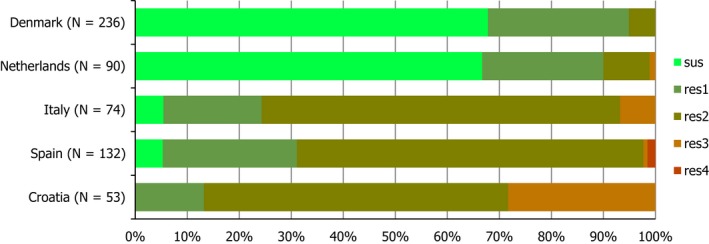
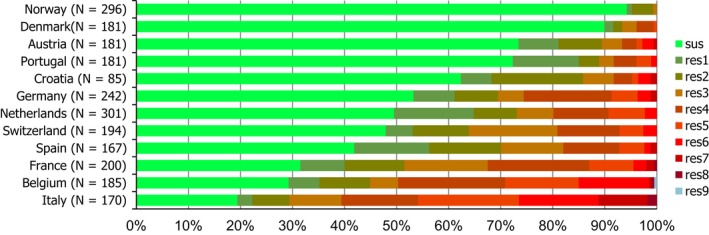
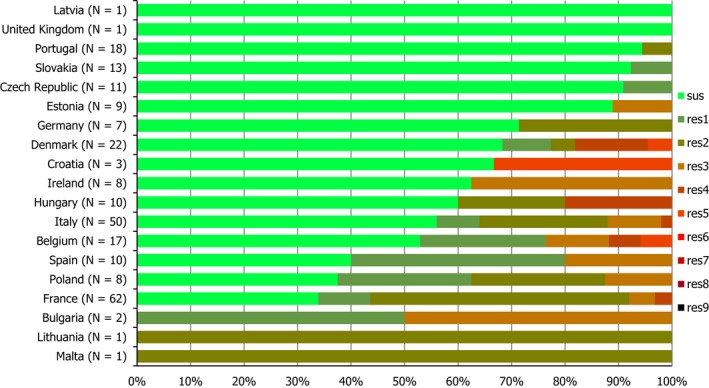
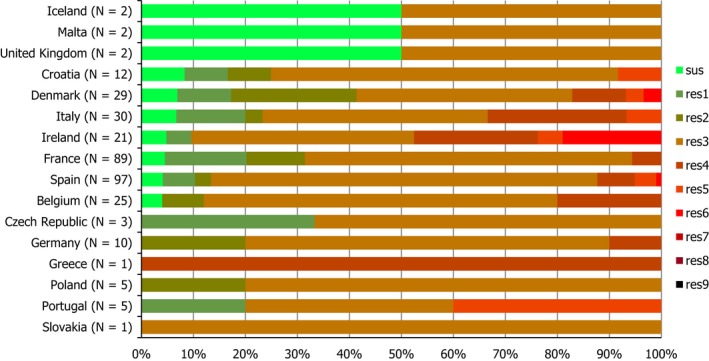
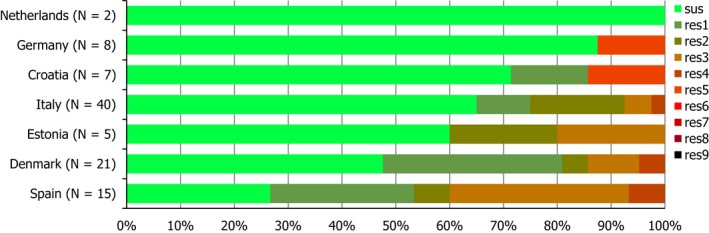
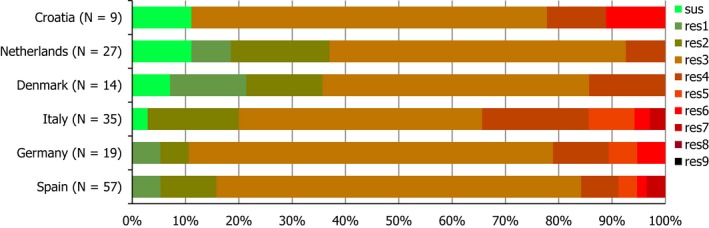
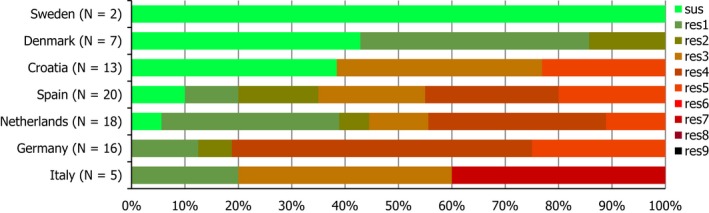
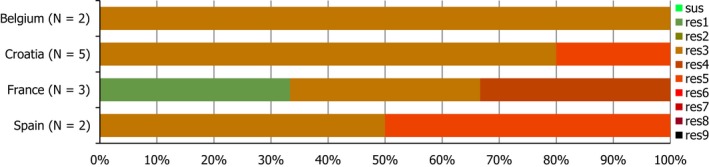
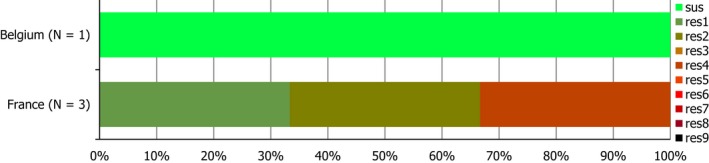
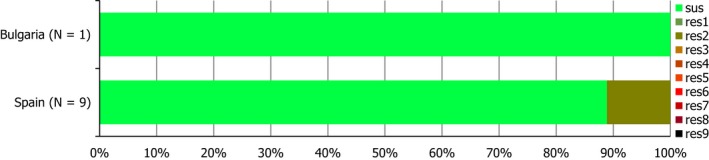
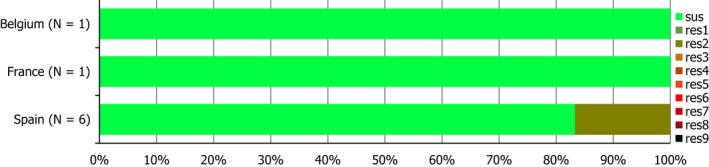
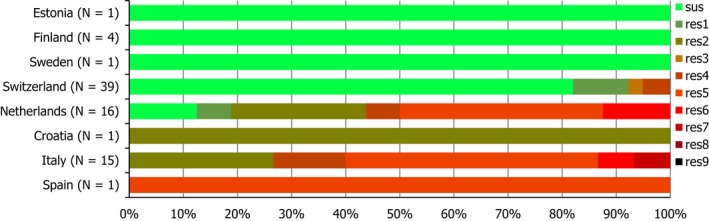
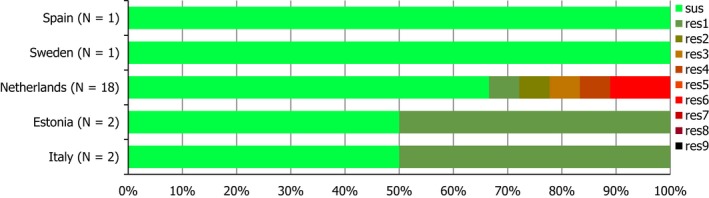
N: total number of isolates tested for susceptibility against the whole common set of antimicrobials for Salmonella; sus: susceptible to all antimicrobial classes of the common set for Salmonella; res1–res9: resistance to one up to nine antimicrobial classes of the common set for Salmonella.
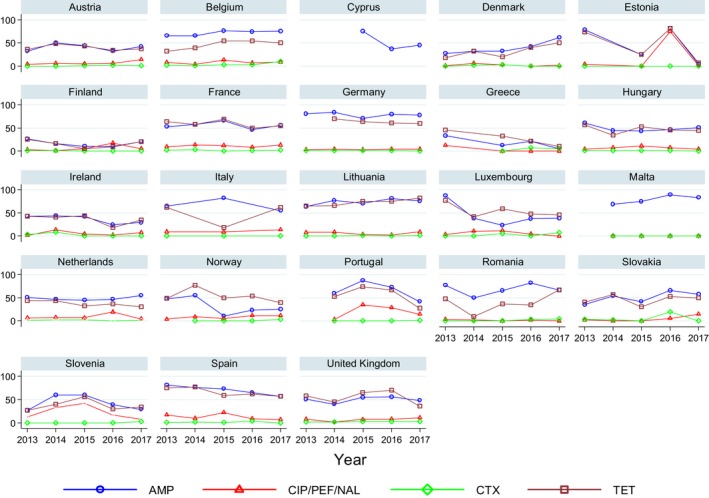
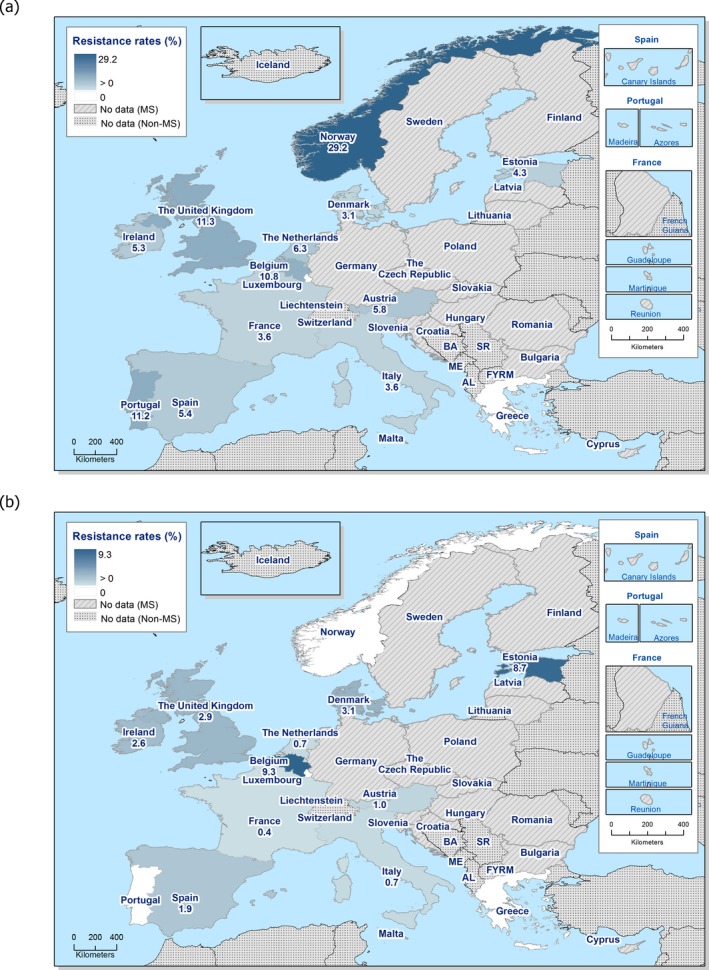
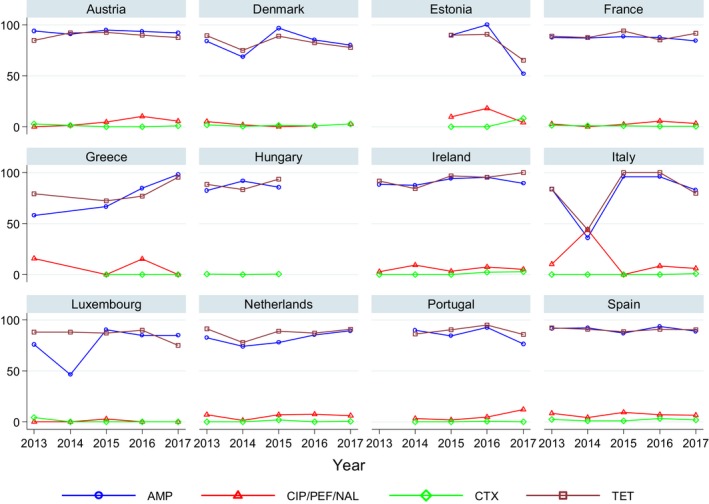
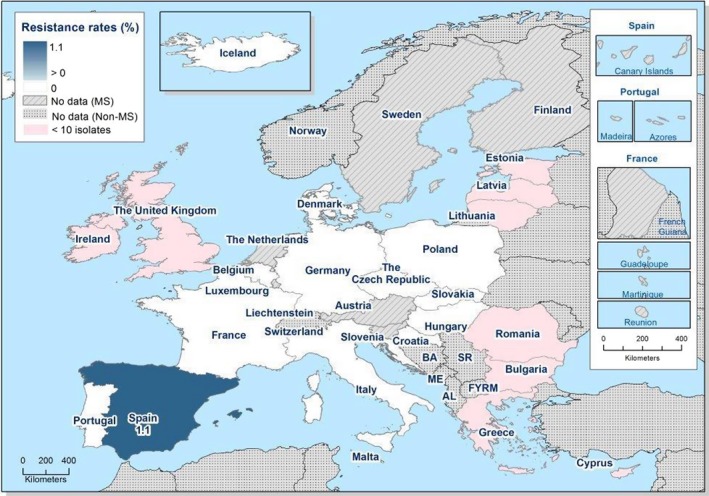
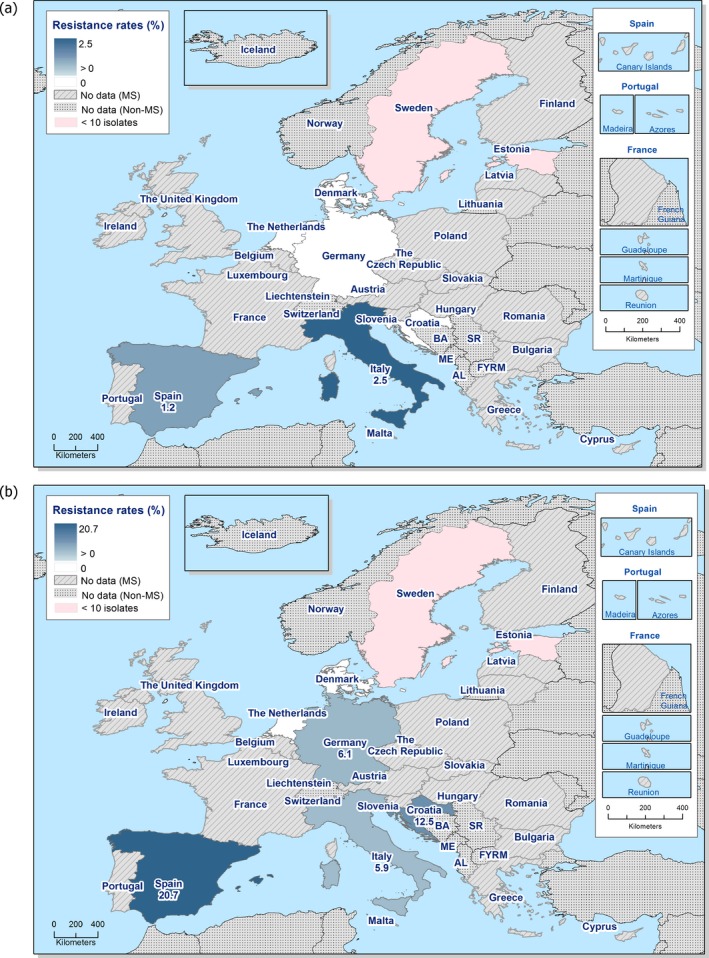
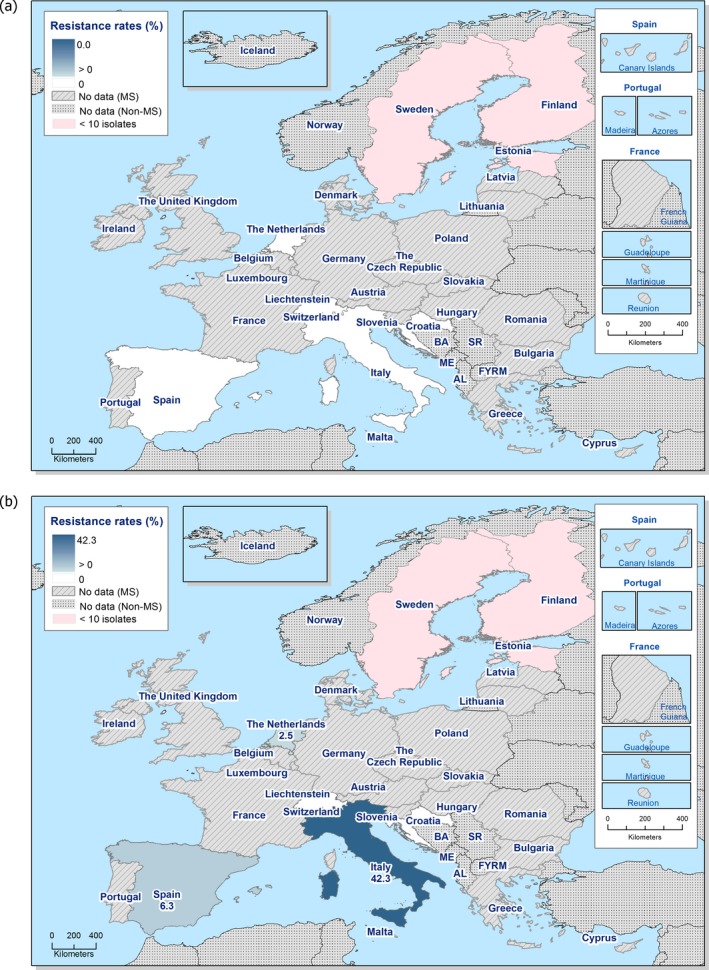
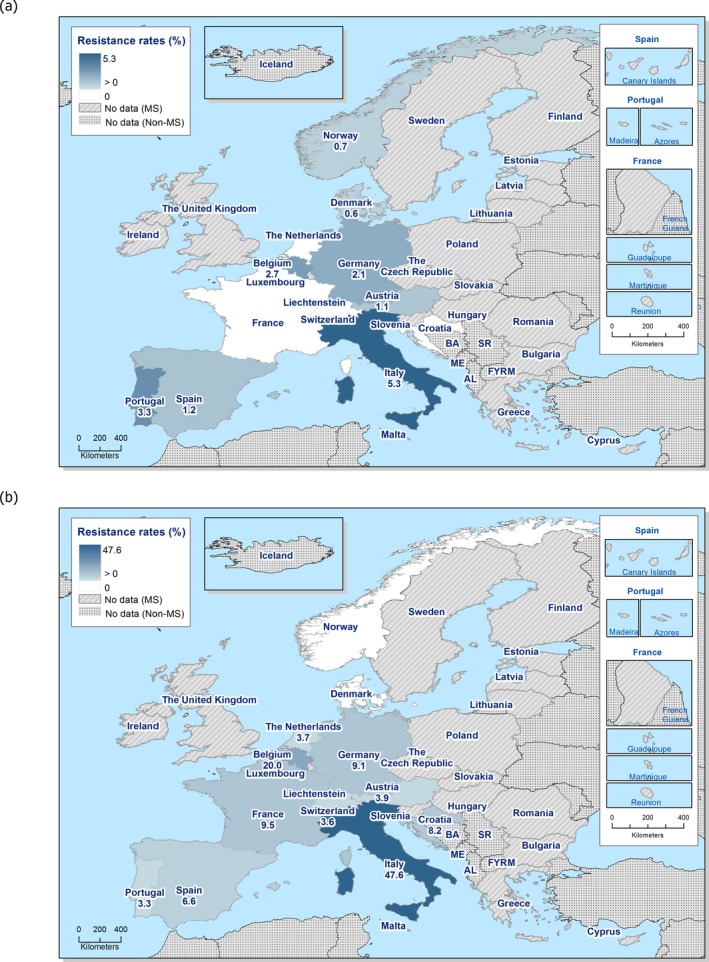
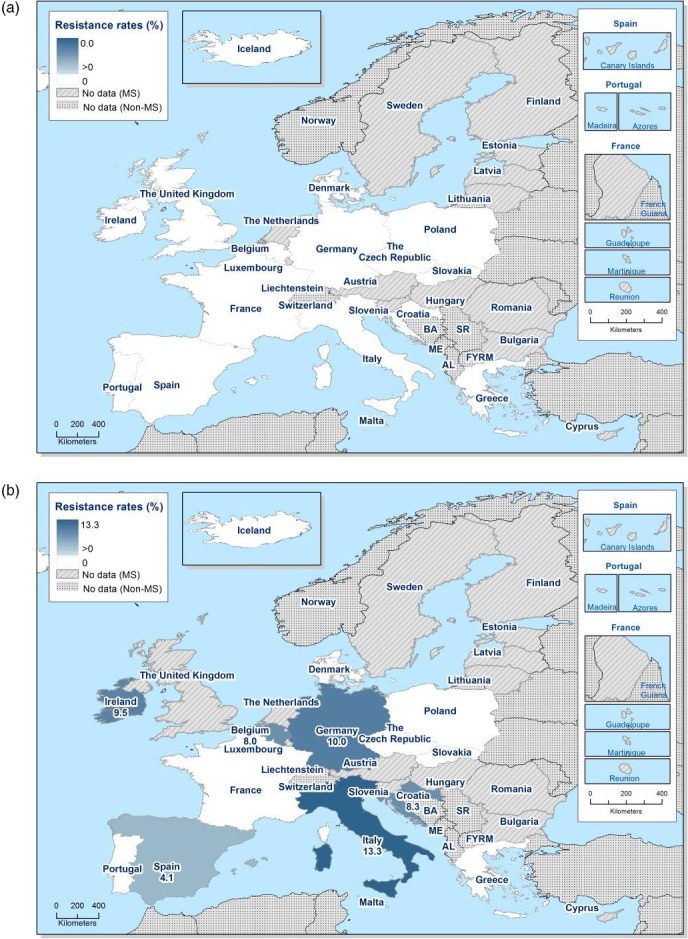
Statistically significant increasing trends over 3–5 years, as tested by logistic regression (p ≤ 0.05), were observed for ciprofloxacin in Austria, Finland, Slovakia and the United Kingdom (↑), for ampicillin in Belgium, Denmark and Slovakia (↑), for tetracyclines in Belgium, Denmark, Lithuania and Romania (↑) and for cefotaxime in Belgium (↑). Statistically significant decreasing trends over 3–5 years were observed for ciprofloxacin in Greece and Spain (↓), for ampicillin in Cyprus, Estonia, Germany, Greece, Lithuania, Luxembourg, Norway, Portugal and Spain (↓), for tetracyclines in Estonia, Finland, Germany, Greece, the Netherlands, Portugal and Spain (↓), and for cefotaxime in Norway, Portugal and Slovenia (↓). Only countries testing at least 10 isolates per year were included in the analysis.
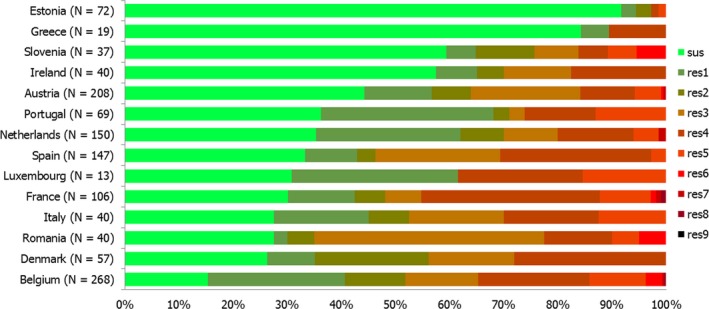
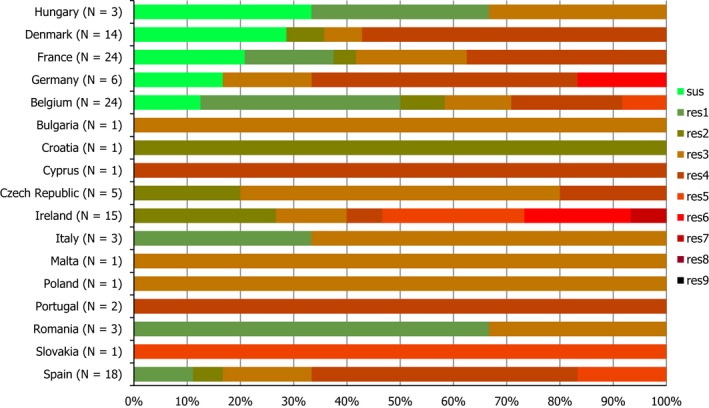
N: total number of isolates tested for susceptibility against the whole common antimicrobial set for Salmonella; sus: susceptible to all antimicrobial classes of the common set for Salmonella; res1–res9: resistance to one up to nine antimicrobial classes of the common set for Salmonella.
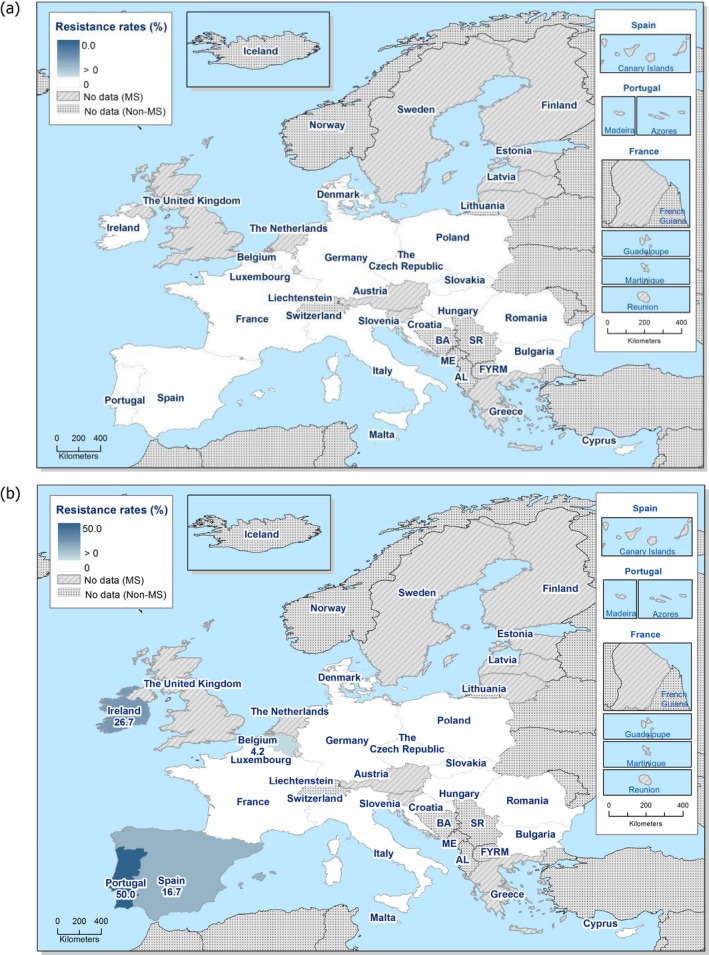
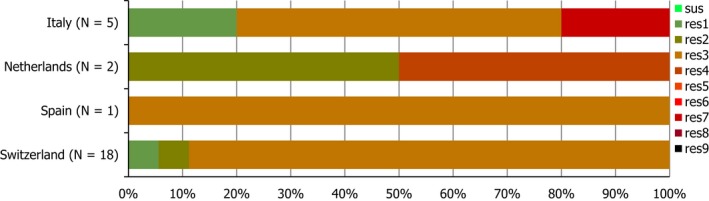
Statistically significant increasing trends over 3–5 years, as tested by logistic regression (p ≤ 0.05), were observed for ciprofloxacin in Austria and Portugal (↑), for ampicillin in Greece and the Netherlands (↑) and for tetracyclines in Greece and Ireland (↑). Statistically significant decreasing trends over 3–5 years were observed for ciprofloxacin in Greece (↓), for ampicillin in Estonia and Portugal (↓) and for cefotaxime in Estonia, Italy and Luxembourg (↓). Only countries testing at least 10 isolates per year were included in the analysis.
N: total number of isolates tested for susceptibility against the whole common antimicrobial set for Salmonella; sus: susceptible to all antimicrobial classes of the common set for Salmonella; res1–res9: resistance to one up to nine antimicrobial classes of the common set for Salmonella.
N: total number of isolates tested for susceptibility against the whole common antimicrobial set for Salmonella; sus: susceptible to all antimicrobial classes of the common set for Salmonella; res1–res9: resistance to one antimicrobial class/resistance to eleven antimicrobial classes of the common set for Salmonella.
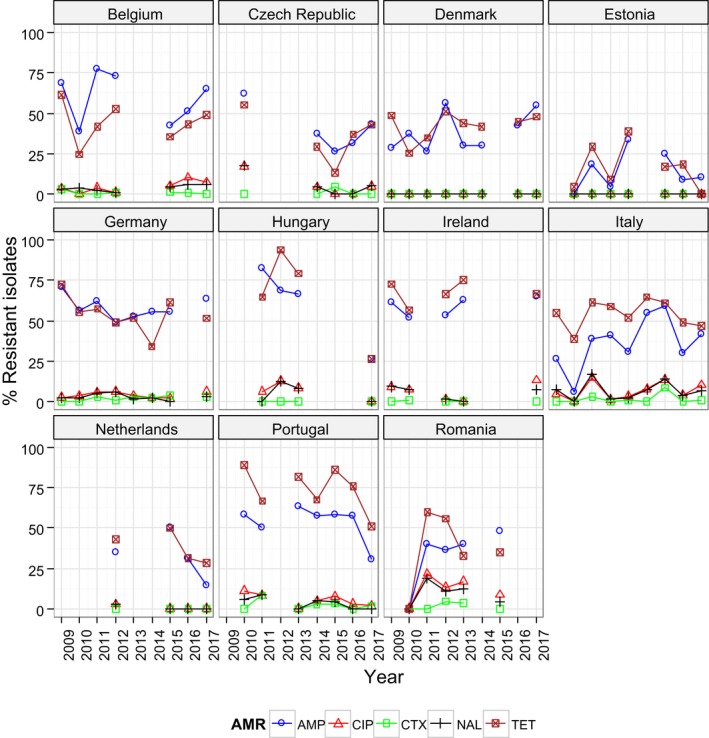
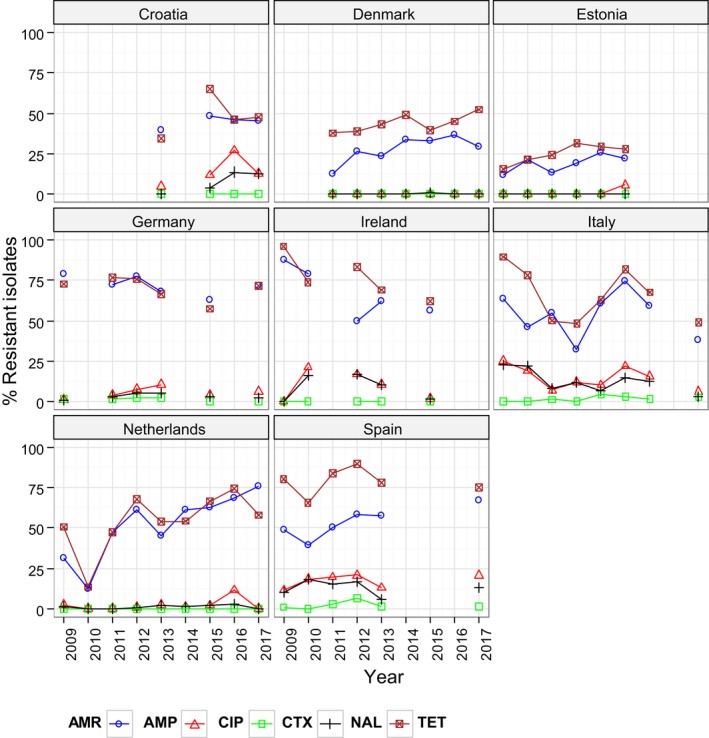
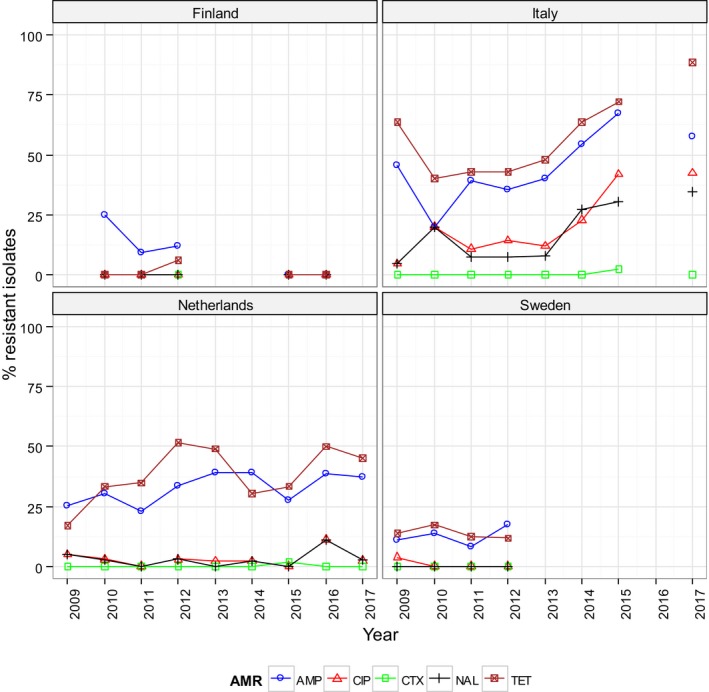
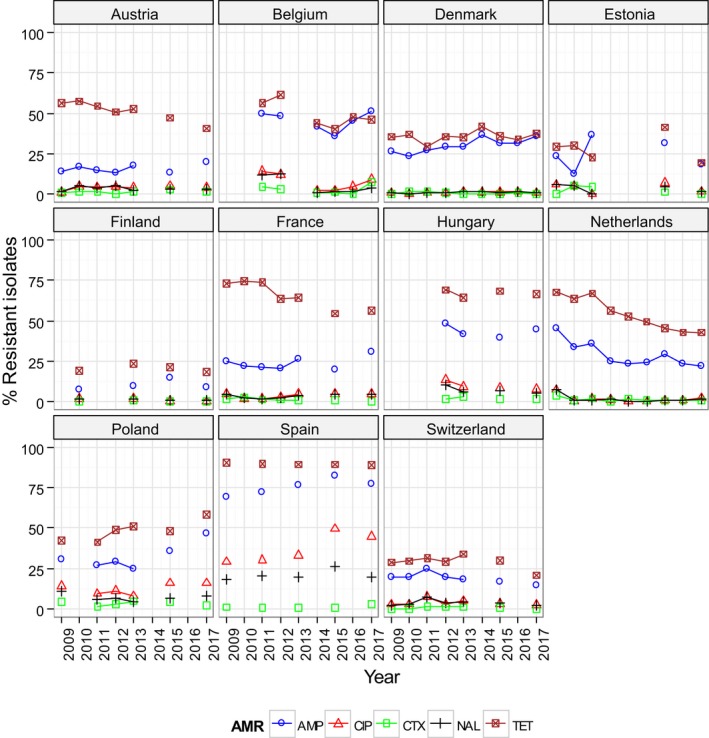
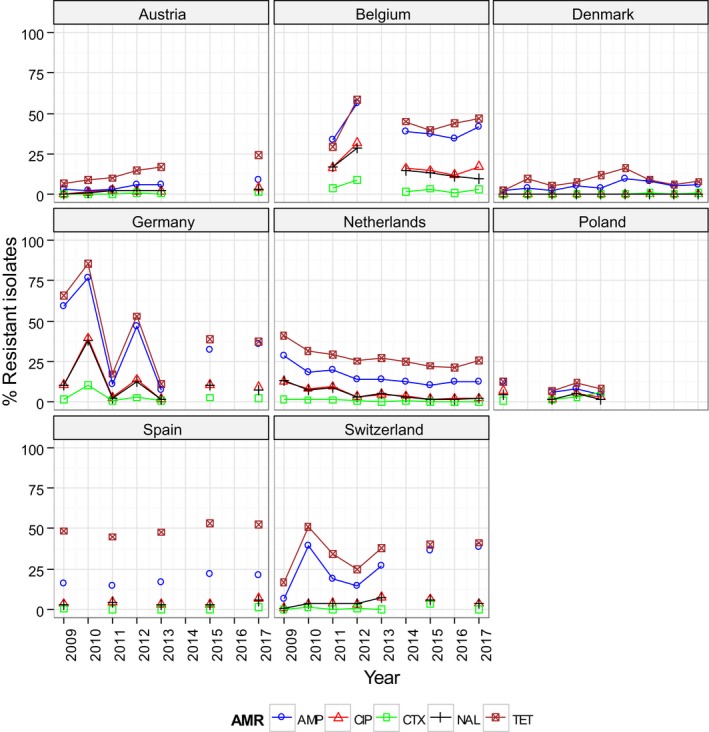
Statistical significant trends for 4 or more years were assessed using a logistic regression model (p ≤ 0.05). Statistically significant increasing trends were observed for ampicillin in Denmark (↑), Estonia (↑), Italy (↑) and Romania (↑), for cefotaxime in Germany (↑), for ciprofloxacin and nalidixic acid in Belgium (↑) and Romania (↑), as well as for tetracycline in the Czech Republic (↑) and Romania (↑).
Statistically significant decreasing trends were observed for ampicillin in Belgium (↓), the Czech Republic (↓), Germany (↓), Hungary (↓) and Portugal (↓), for ciprofloxacin and nalidixic acid in the Czech Republic (↓), as well as for tetracycline in Belgium (↓), Estonia (↓), Germany (↓), Hungary (↓) and Portugal (↓).
N: total number of isolates tested for susceptibility against the whole common antimicrobial set for Salmonella; sus: susceptible to all antimicrobial classes of the common set for Salmonella; res1–res9: resistance to one antimicrobial class/resistance to eleven antimicrobial classes of the common set for Salmonella.
Statistical significant trends for 4 or more years were assessed using a logistic regression model (p ≤ 0.05). Statistically significant increasing trends were observed for ampicillin in Denmark (↑) and the Netherlands (↑), for ciprofloxacin in Estonia (↑), for nalidixic acid in Ireland (↑), for ciprofloxacin and nalidixic acid in Germany (↑), as well as for tetracycline in the Netherlands (↑).
Statistically significant decreasing trends were observed for ampicillin in Germany (↓), Ireland (↓) and Italy (↓), for ciprofloxacin in Ireland (↓), for ciprofloxacin and nalidixic acid in Italy (↓), as well as for tetracycline in Ireland (↓) and Italy (↓).
N: total number of isolates tested for susceptibility against the whole common antimicrobial set for Salmonella; sus: susceptible to all antimicrobial classes of the common set for Salmonella; res1–res9: resistance to one antimicrobial class/resistance to eleven antimicrobial classes of the common set for Salmonella.
N: total number of isolates tested for susceptibility against the whole common antimicrobial set for Salmonella; sus: susceptible to all antimicrobial classes of the common set for Salmonella; res1–res9: resistance to one antimicrobial class/resistance to eleven antimicrobial classes of the common set for Salmonella.
Statistical significant trends for 4 or more years were assessed using a logistic regression model (p ≤ 0.05). Statistically significant increasing trends were observed for ampicillin in Italy (↑) and the Netherlands (↑), for ciprofloxacin and nalidixic acid in Italy (↑), as well as for tetracycline in Italy (↑) and the Netherlands (↑).
Statistically significant decreasing trends were observed for ampicillin in Finland (↓).
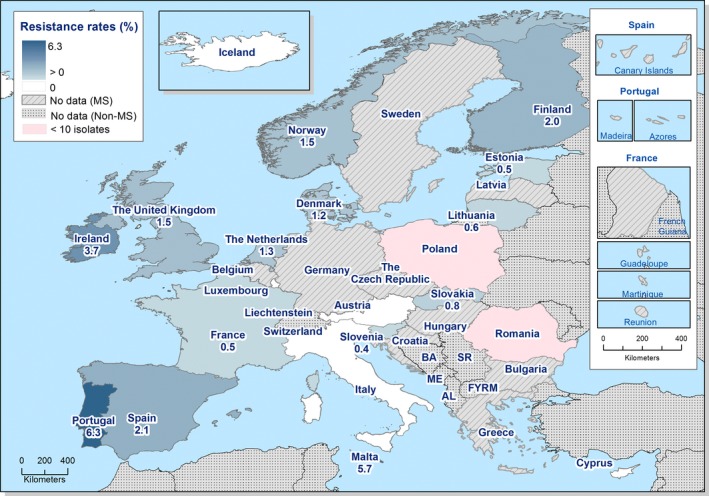
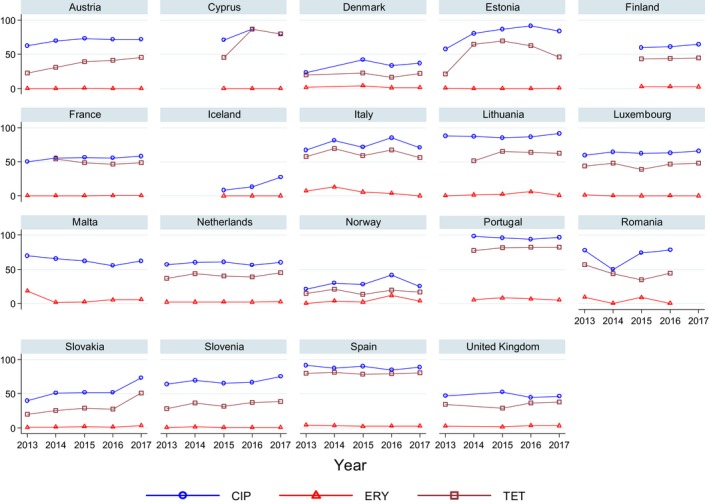
Statistically significant increasing trends over 3–5 years, as tested by logistic regression (p ≤ 0.05), were observed for ciprofloxacin in Austria, Estonia, Finland, France, Iceland, Italy, Slovakia and Slovenia (↑), for erythromycin France, Norway and Slovakia (↑) and for tetracycline in Austria, Cyprus, Estonia, the Netherlands, Slovakia, Slovenia and the United Kingdom (↑). Statistically significant decreasing trends were observed for erythromycin in Luxembourg and Malta (↓) and for tetracycline in France. Only countries testing at least 10 isolates per year were included in the analysis.
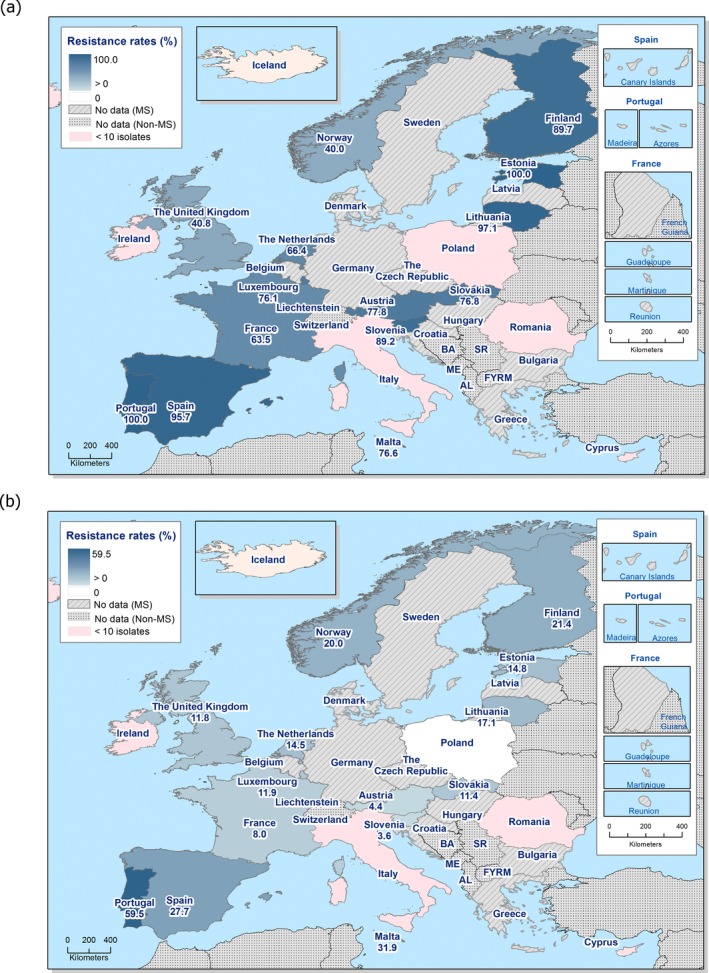
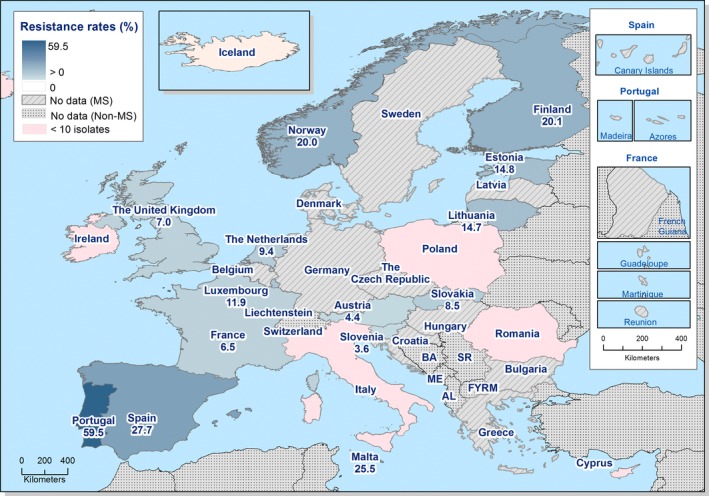
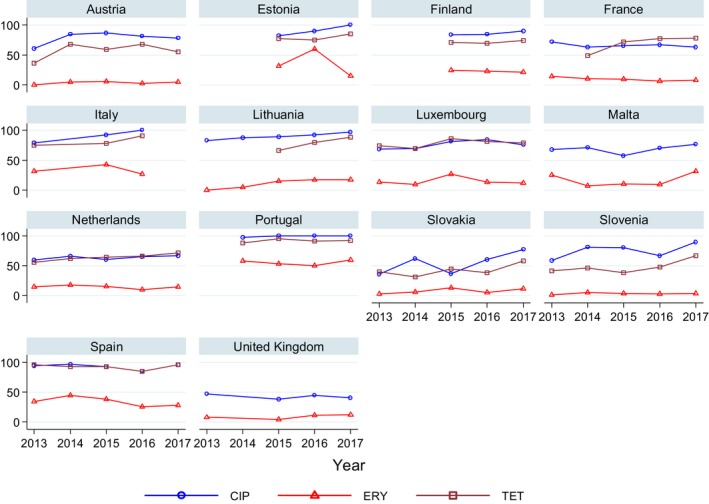
Statistically significant increasing trends over 3–5 years, as tested by logistic regression (p ≤ 0.05), were observed for ciprofloxacin in Estonia, Finland, Slovakia and Slovenia (↑), for tetracycline in France, the Netherlands, Slovakia and Slovenia (↑). Statistically significant decreasing trends were observed for ciprofloxacin and erythromycin in France (↓). Only countries reporting at least 10 isolates per year were included in the analysis.
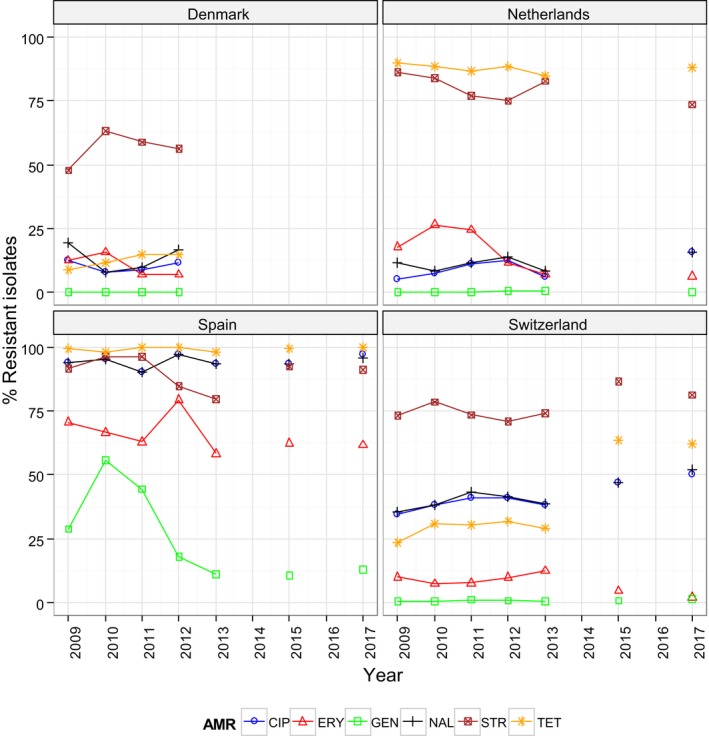
Statistically significance of trends over 4/5 or more years was tested by a logistic regression model (p ≤ 0.05).
Statistically significant increasing trends were observed for ciprofloxacin, nalidixic acid, streptomycin and tetracycline in Switzerland.
Statistically significant decreasing trends were observed for erythromycin in the Netherlands, Spain and Switzerland, for gentamicin in Spain, for streptomycin in Spain.
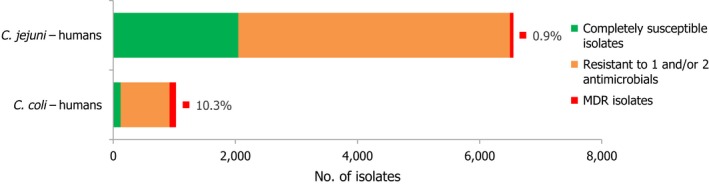
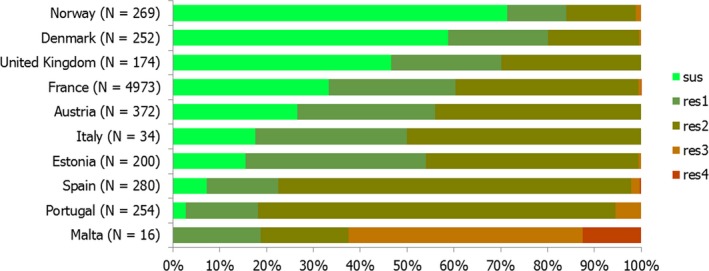
N: total number of isolates tested for susceptibility against the whole harmonised set of antimicrobials for Campylobacter; sus: susceptible to all antimicrobial classes of the harmonised set for Campylobacter; res1–res4: resistance to one up to four antimicrobial classes of the harmonised set for Campylobacter.
C. jejuni isolates from cattle tested in the Netherlands in 2017 derive from fattening steers.
C. jejuni isolates from cattle tested in the Netherlands in 2017 derive from fattening steers.
N: total number of isolates tested for susceptibility against the whole harmonised set of antimicrobials for Campylobacter; sus: susceptible to all antimicrobial classes of the harmonised set for Campylobacter; res1–res4: resistance to one up to four antimicrobial classes of the harmonised set for Campylobacter.
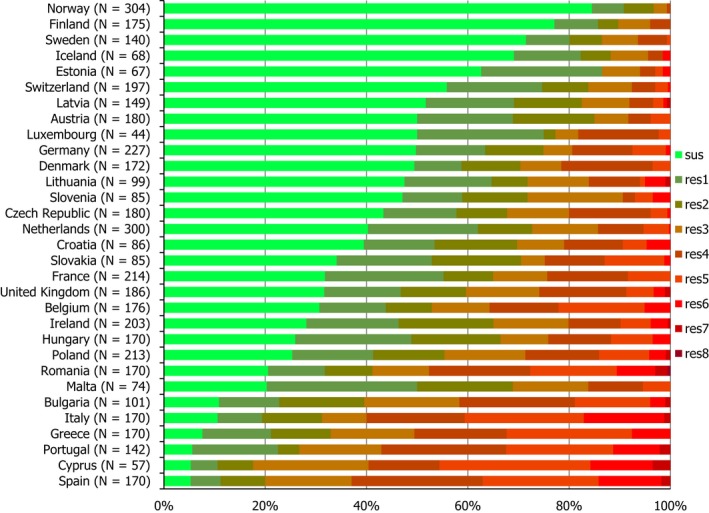
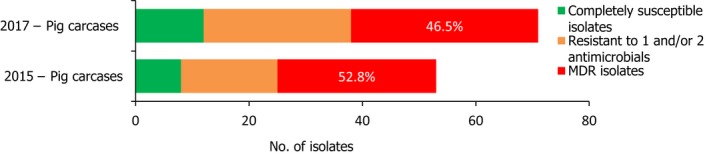
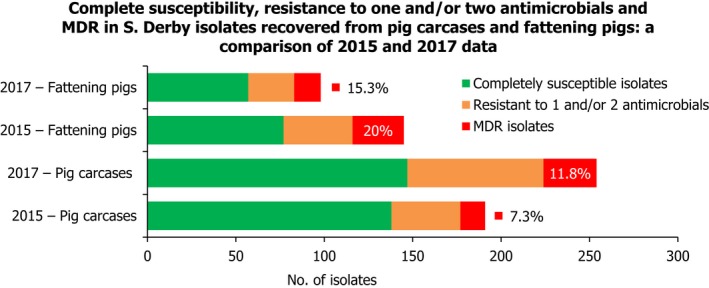
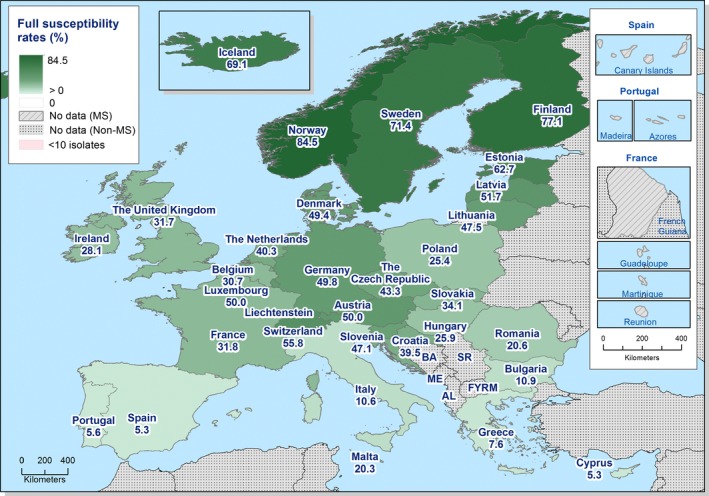
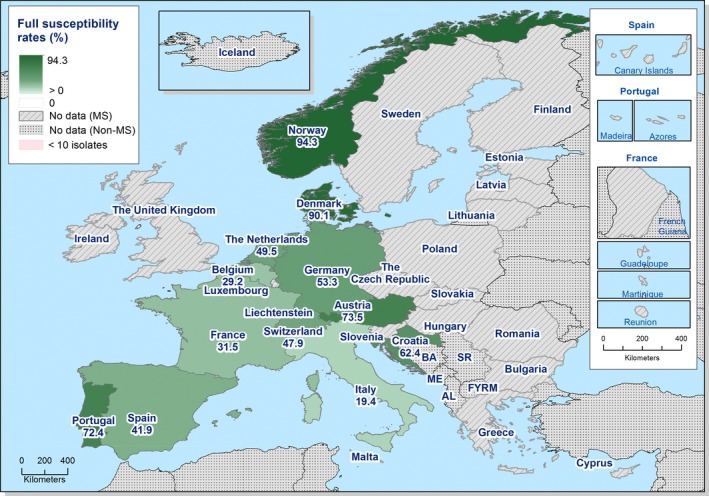
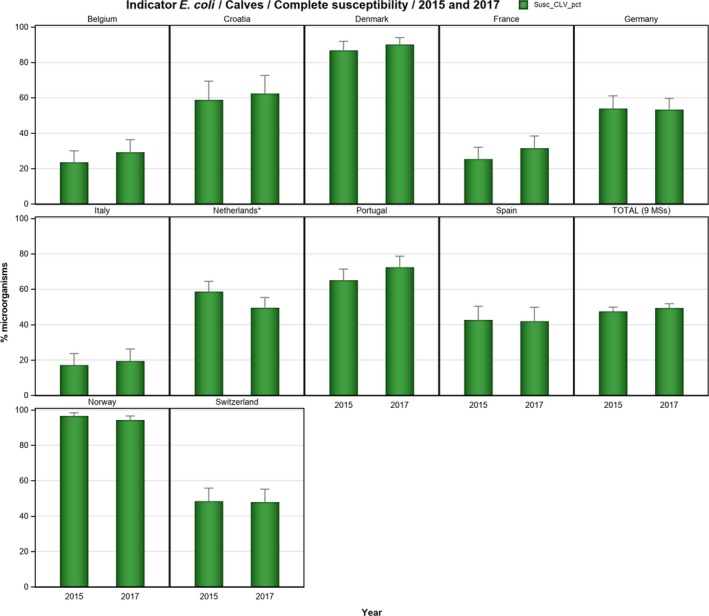
N: total number of isolates tested for susceptibility against the whole harmonised set of antimicrobials for Escherichia coli; sus: susceptible to all antimicrobial classes of the harmonised set for E. coli; res1–res9: resistance to 1 up to 11 antimicrobial classes of the harmonised set for E. coli.
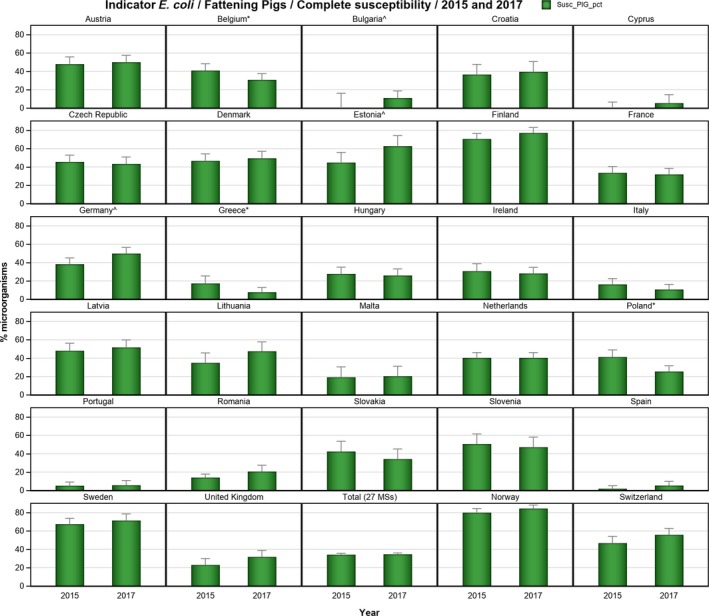
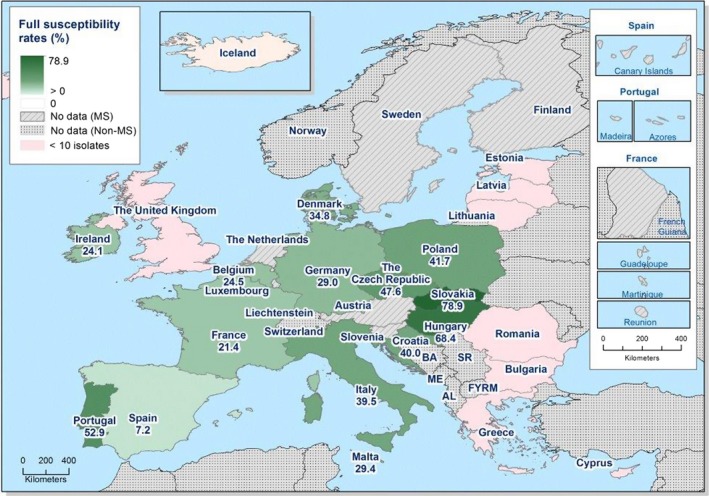
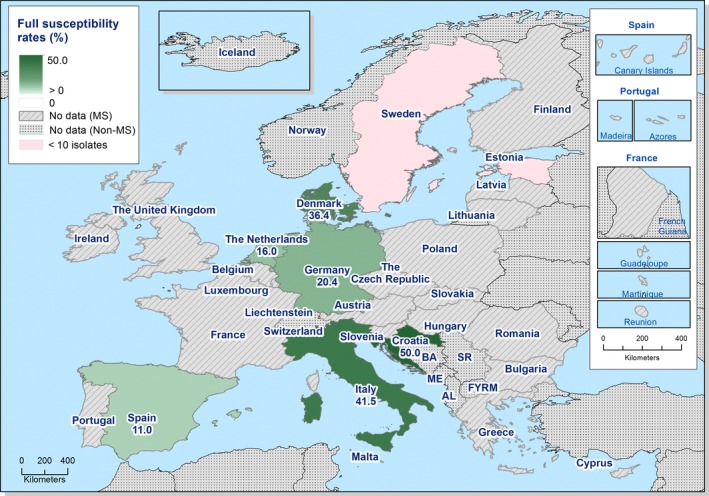
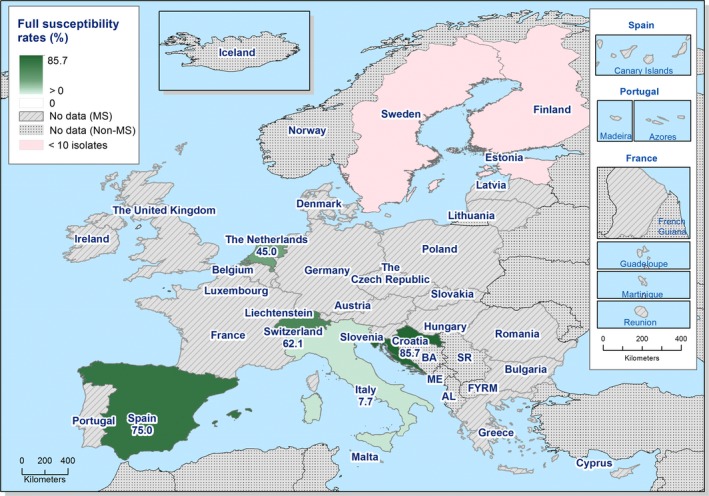
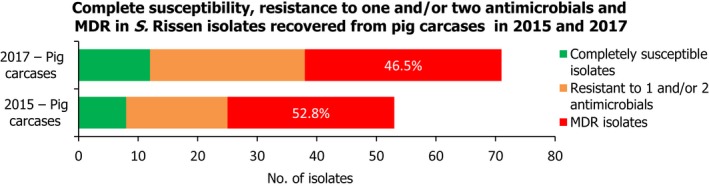
^indicates statistically significant positive difference in the occurrence of complete susceptibility between 2017 and 2015.
*indicates statistically significant negative difference in the occurrence of complete susceptibility between 2017 and 2015.
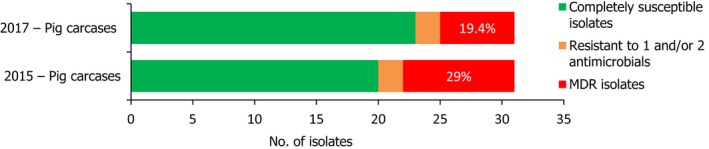
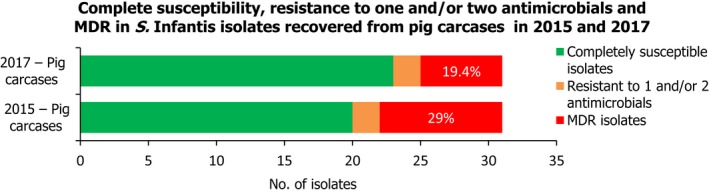
N: total number of isolates tested for susceptibility against the whole harmonised set of antimicrobials for Escherichia coli; sus: susceptible to all antimicrobial classes of the harmonised set for Escherichia coli; res1–res9: resistance to one up to 11 antimicrobial classes of the harmonised set for Escherichia coli.
Stars indicate statistically significant negative difference in occurrence of complete susceptibility between 2017 and 2015.
N: total number of isolates tested for susceptibility against the whole common antimicrobial set for Salmonella; sus: susceptible to all antimicrobial classes of the common set for Salmonella; res1–res9: resistance to one antimicrobial class/resistance to eleven antimicrobial classes of the common set for Salmonella.
N: total number of isolates tested for susceptibility against the whole common antimicrobial set for Salmonella; sus: susceptible to all antimicrobial classes of the common set for Salmonella; res1–res9: resistance to one antimicrobial class/resistance to eight antimicrobial classes of the common set for Salmonella.
N: total number of isolates tested for susceptibility against the whole common antimicrobial set for Salmonella; sus: susceptible to all antimicrobial classes of the common set for Salmonella; res1–res9: resistance to one antimicrobial class/resistance to seven antimicrobial classes of the common set for Salmonella.
N: total number of isolates tested for susceptibility against the whole common antimicrobial set for Salmonella; sus: susceptible to all antimicrobial classes of the common set for Salmonella; res1–res9: resistance to one antimicrobial class/resistance to eleven antimicrobial classes of the common set for Salmonella.
N: total number of isolates tested for susceptibility against the whole common antimicrobial set for Salmonella; sus: susceptible to all antimicrobial classes of the common set for Salmonella; res1–res9: resistance to one antimicrobial class/resistance to eight antimicrobial classes of the common set for Salmonella.
N: total number of isolates tested for susceptibility against the whole common antimicrobial set for Salmonella; sus: susceptible to all antimicrobial classes of the common set for Salmonella; res1–res7: resistance to one antimicrobial class/resistance to seven antimicrobial classes of the common set for Salmonella.
N: total number of isolates tested for susceptibility against the whole common antimicrobial set for Salmonella; sus: susceptible to all antimicrobial classes of the common set for Salmonella; res1–res9: resistance to one antimicrobial class/resistance to eight antimicrobial classes of the common set for Salmonella.
N: total number of isolates tested for susceptibility against the whole common antimicrobial set for Salmonella; sus: susceptible to all antimicrobial classes of the common set for Salmonella; res1–res9: resistance to one antimicrobial class/resistance to seven antimicrobial classes of the common set for Salmonella.
N: total number of isolates tested for susceptibility against the whole common antimicrobial set for Salmonella; sus: susceptible to all antimicrobial classes of the common set for Salmonella; res1–res9: resistance to one antimicrobial class/resistance to seven antimicrobial classes of the common set for Salmonella.
N: total number of isolates tested for susceptibility against the whole common antimicrobial set for Salmonella; sus: susceptible to all antimicrobial classes of the common set for Salmonella; res1–res9: resistance to one antimicrobial class/resistance to seven antimicrobial classes of the common set for Salmonella.
N: total number of isolates tested for susceptibility against the whole common antimicrobial set for Salmonella; CZ: Czech Republic; UK: United Kingdom; sus: susceptible to all antimicrobial classes of the common set for Salmonella; res1–res9: resistance to one antimicrobial class/resistance to eleven antimicrobial classes of the common set for Salmonella.
N: total number of isolates tested for susceptibility against the whole common antimicrobial set for Salmonella; CZ: Czech Republic; UK: United Kingdom; sus: susceptible to all antimicrobial classes of the common set for Salmonella; res1–res9: resistance to one antimicrobial class/resistance to eleven antimicrobial classes of the common set for Salmonella.
N: total number of isolates tested for susceptibility against the whole common antimicrobial set for Salmonella; UK: United Kingdom; sus: susceptible to all antimicrobial classes of the common set for Salmonella; res1–res9: resistance to one antimicrobial class/resistance to seven antimicrobial classes of the common set for Salmonella.
References
-
- Agersø Y, Torpdahl M, Zachariasen C, Seyfarth A, Hammerum AM and Møller Nielsen EM, 2012. Tentative colistin epidemiological cut‐off value for Salmonella spp. Foodborne Pathogens Disease, 9, 367–369. https://doi.org/10.1089/fpd. 2011.1015 - DOI - PubMed
-
- Anonymous , 2018. Annual Report on Zoonoses in Denmark 2017, National Food Institute, Technical University of Denmark. Available from: https://www.food.dtu.dk/-/media/Institutter/Foedevareinstituttet/Publika...
-
- Aviv G, Tsyba K, Steck N, Salmon‐Divon M, Cornelius A, Rahav G, Grassl GA and Gal‐Mor O, 2014. A unique megaplasmid contributes to stress tolerance and pathogenicity of an emergent Salmonella enterica serovar Infantis strain. Environmental Microbiology, 16, 977–994. 10.1111/1462-2920.12351 - DOI - PubMed
LinkOut - more resources
Full Text Sources