. 2020 Jun;2(2):lqaa044.
doi: 10.1093/nargab/lqaa044. Epub 2020 Jun 23.

A network-based integrated framework for predicting virus-prokaryote interactions

Affiliations

A network-based integrated framework for predicting virus-prokaryote interactions

Weili Wang et al. NAR Genom Bioinform. 2020 Jun.

Abstract

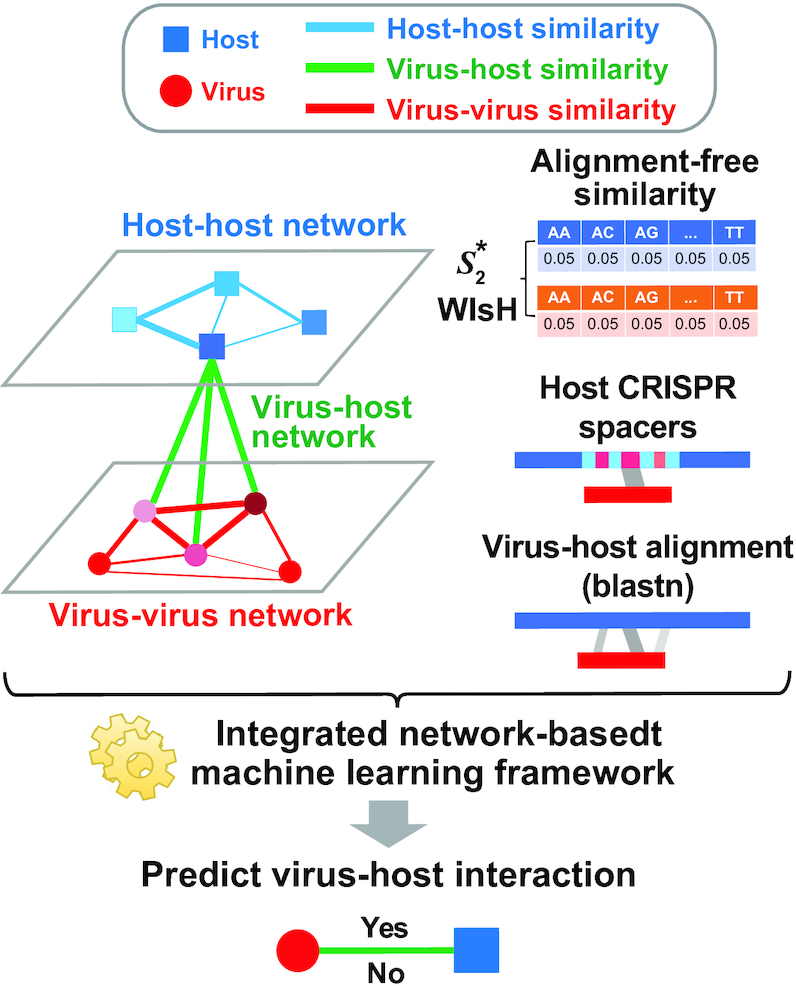
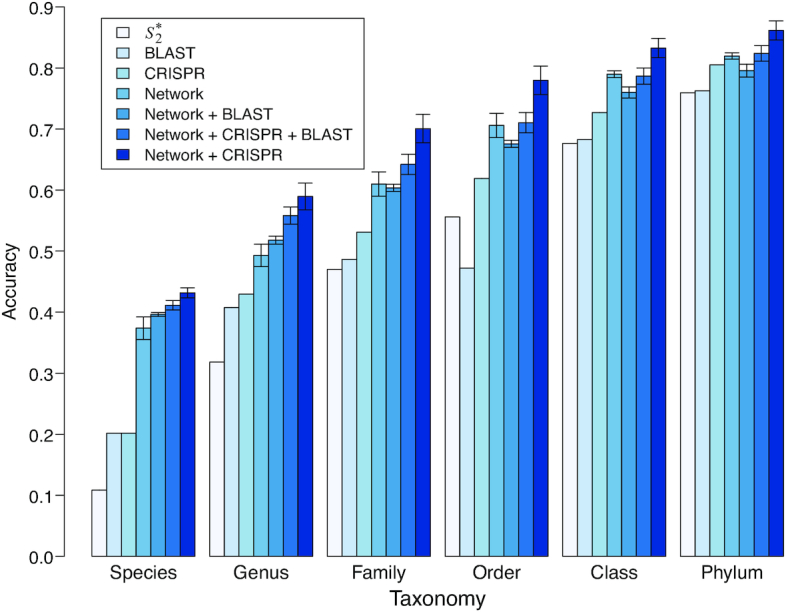
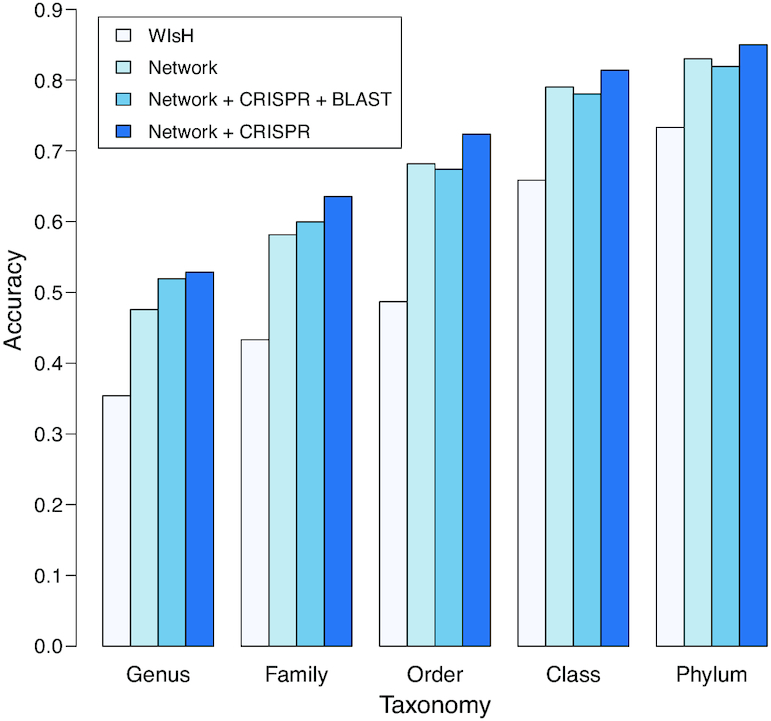
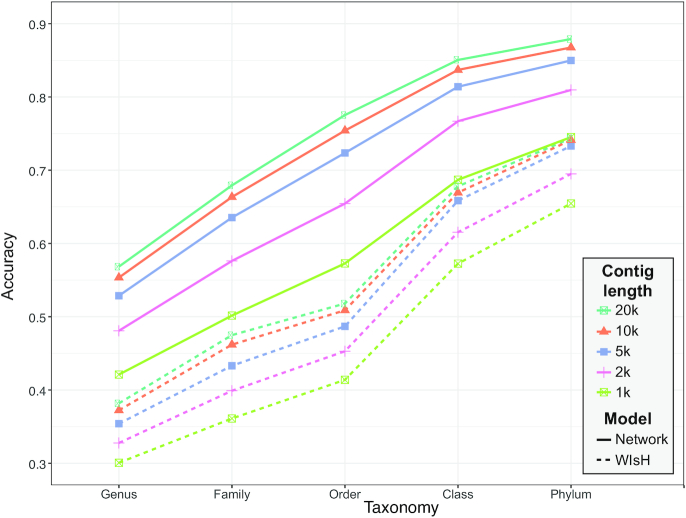
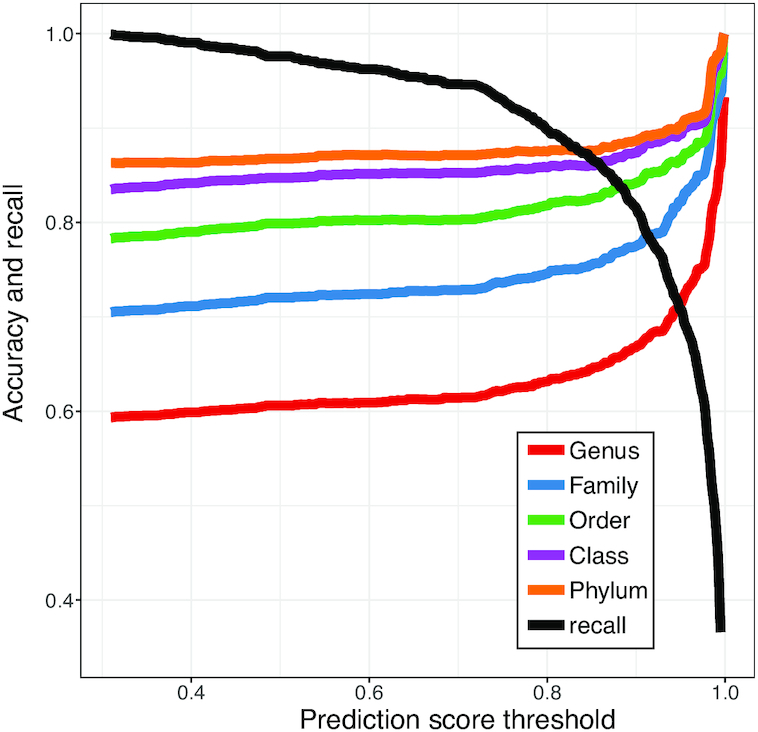
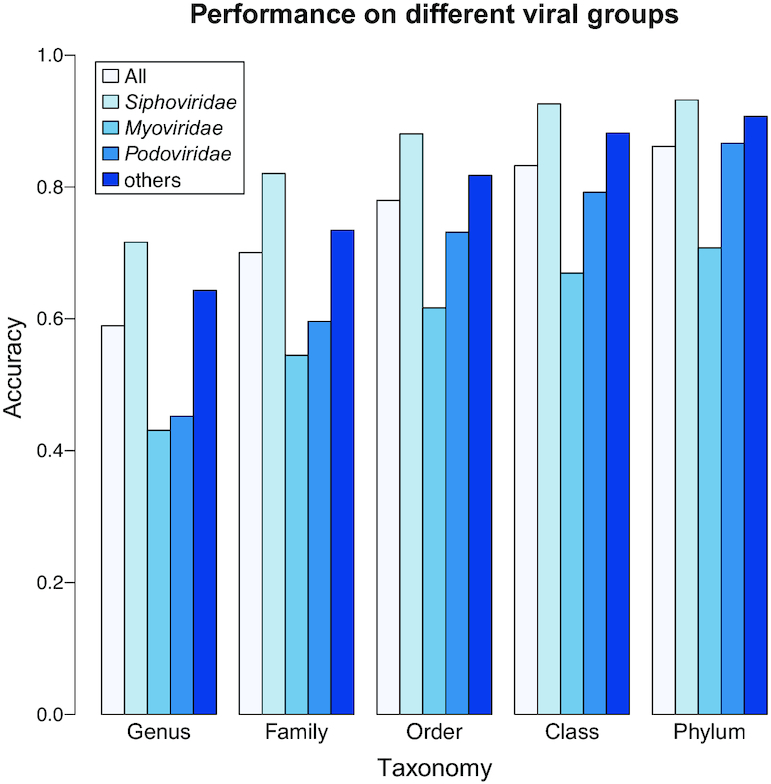
Metagenomic sequencing has greatly enhanced the discovery of viral genomic sequences; however, it remains challenging to identify the host(s) of these new viruses. We developed VirHostMatcher-Net, a flexible, network-based, Markov random field framework for predicting virus-prokaryote interactions using multiple, integrated features: CRISPR sequences and alignment-free similarity measures ([Formula: see text] and WIsH). Evaluation of this method on a benchmark set of 1462 known virus-prokaryote pairs yielded host prediction accuracy of 59% and 86% at the genus and phylum levels, representing 16-27% and 6-10% improvement, respectively, over previous single-feature prediction approaches. We applied our host prediction tool to crAssphage, a human gut phage, and two metagenomic virus datasets: marine viruses and viral contigs recovered from globally distributed, diverse habitats. Host predictions were frequently consistent with those of previous studies, but more importantly, this new tool made many more confident predictions than previous tools, up to nearly 3-fold more (n > 27 000), greatly expanding the diversity of known virus-host interactions.


Figures

Figure 1.
Figure 1.
Overview of the network prediction framework. A novel two-layer network is constructed for representing virus–virus, host–host and virus–host similarities. Viruses (red circles) are connected based on sequence similarity (red edges). Similarly, hosts (blue squares) are connected based on sequence similarity (blue edges). The thickness of the edges indicates the degree of similarity. The interaction between a virus and host pair (green edges) can be predicted using multiple types of features: (i) the similarity between the virus and other viruses infecting the host; (ii) the similarity between the host and other hosts infected by the virus; (iii) the alignment-free sequence similarity between the virus and the host based on k-mer frequencies; (iv) the existence of shared CRISPR spacers between the virus and the host; and (v) alignment-based sequence matches between the virus and the host. Finally, a network-based machine learning model is used to integrate all different types of features and to predict the likelihood of the interaction of a VHP.
Figure 2.
Figure 2.
Distributions of the different feature values among 826 interacting and non-interacting VHPs. The positive set consists of 826 known infecting VHPs (positive set) and the same number of randomly selected virus and host pairs were used as the non-interacting, negative set. (A) Box plots of similarity defined by formula image(v, b). (B) Box plots of the log-likelihood scores given by WIsH. (C) Box plots of SV+(v, b) scores. (D) Box plots of the SV(v, b) scores. (E) Box plots of BLAST scores. (F) Box plots of the CRISPR scores. For all figures, the horizontal bar displays the median; boxes display the first and third quartiles; whiskers depict minimum and maximum values; and points depict outliers beyond the whiskers.
Figure 3.
Figure 3.
Prediction accuracies of the different approaches for 1462 viruses. Prediction accuracies for 1462 viral genomes whose true hosts are known against 62 493 candidate hosts, binned by taxonomic level. The first three bars show results using individual features of formula image(v, b), CRISPR score or alignment-based similarity score (blastn), respectively. The remaining bars show results with integrated network models, trained using 826 positive and the same number of negative VHPs as in Figure 2. In order, these are the model in Equation (5) that incorporates the network-based features SV+(v, b) and SV(v, b), alignment-free virus–host similarity formula image(v, b), in addition to the blastn scores (‘Network + BLAST’), the model in Equation (7) (‘Network + CRISPR + BLAST’), and the model in Equation (6) (‘Network + CRISPR’). Error bars for the network-based results depict 95% confidence intervals using 100 replicates of negative training sets (random VHPs).
Figure 4.
Figure 4.
Prediction accuracies of the different approaches for viral contigs of length 5 kb. Prediction accuracies for viral contigs of length 5 kb, binned by taxonomic level. The first bar shows results using WIsH method alone, as in (25). The remaining bars show results with integrated network models, similar to Figure 3. All bars are calculated based on the average accuracies for 10 different sets of viral contigs.
Figure 5.
Figure 5.
Prediction accuracies for contigs subsampled at various lengths from the 1462 virus genomes. Mean accuracies are shown at different taxonomic levels using WIsH scores only (dashed lines) or the integrated model in Equation (8) (solid line) that uses WIsH scores in place of formula image scores.
Figure 6.
Figure 6.
Improvement in host prediction by thresholding on the prediction score. By applying a given threshold, predictions were made only when the prediction score is above the threshold. Predictions were made using the whole genomes of 1462 viruses whose true hosts are known among 62 493 hosts as in Figure 3. The proportion of viruses that can be predicted (recall rate) decreases as the prediction accuracy at all levels increases.
Figure 7.
Figure 7.
Differences in prediction accuracy across viral families. Prediction accuracies for different virus families within the order Caudovirales: Siphoviridae, Myoviridae and Podoviridae. For comparison, accuracies are shown for all viruses (‘all’) and for viruses outside of the Caudovirales or for which their virus families were not listed in the GenBank files (‘other’). Predictions were made using whole viral genomes with no thresholding.

References

    1. Breitbart M., Rohwer F.. Here a virus, there a virus, everywhere the same virus?. Trends Microbiol. 2005; 13:278–284. - PubMed
    1. Breitbart M., Salamon P., Andresen B., Mahaffy J.M., Segall A.M., Mead D., Azam F., Rohwer F.. Genomic analysis of uncultured marine viral communities. Proc. Natl Acad. Sci. U.S.A. 2002; 99:14250–14255. - PMC - PubMed
    1. Fierer N., Breitbart M., Nulton J., Salamon P., Lozupone C., Jones R., Robeson M., Edwards R.A., Felts B., Rayhawk S. et al. .. Metagenomic and small-subunit rRNA analyses reveal the genetic diversity of bacteria, archaea, fungi, and viruses in soil. Appl. Environ. Microb. 2007; 73:7059–7066. - PMC - PubMed
    1. Hurwitz B.L., Sullivan M.B.. The Pacific Ocean Virome (POV): a marine viral metagenomic dataset and associated protein clusters for quantitative viral ecology. PLoS One. 2013; 8:e57355. - PMC - PubMed
    1. Waller A.S., Yamada T., Kristensen D.M., Kultima J.R., Sunagawa S., Koonin E.V., Bork P.. Classification and quantification of bacteriophage taxa in human gut metagenomes. ISME J. 2014; 8:1391–1402. - PMC - PubMed