. 2020 Oct;82(7):3490-3506.
doi: 10.3758/s13414-020-02083-2.

Crossmodal associations modulate multisensory spatial integration

Affiliations

Crossmodal associations modulate multisensory spatial integration

Jonathan Tong et al. Atten Percept Psychophys. 2020 Oct.

Abstract

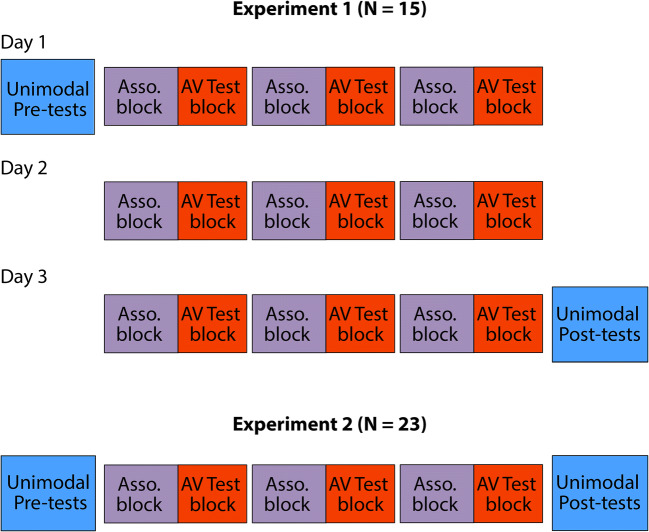
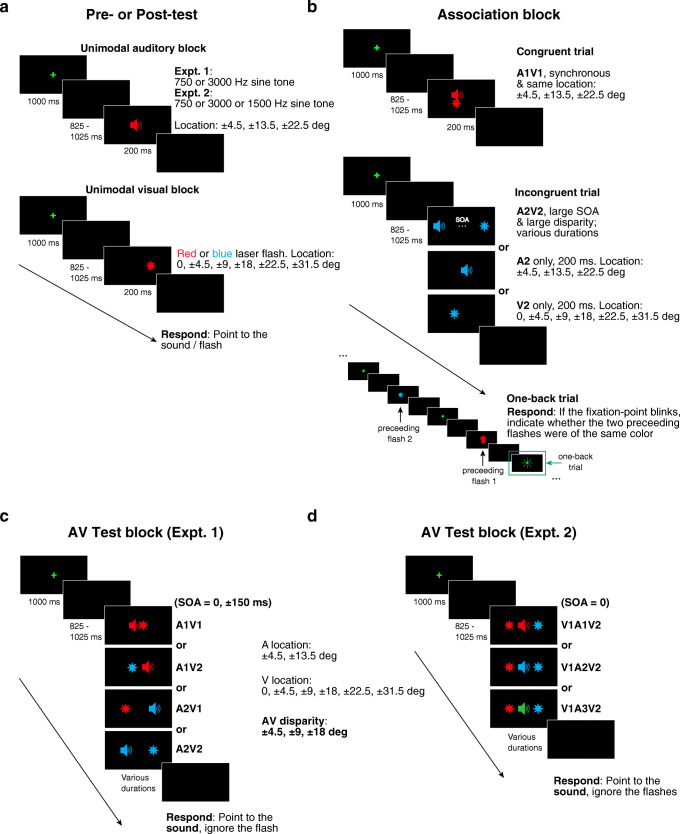
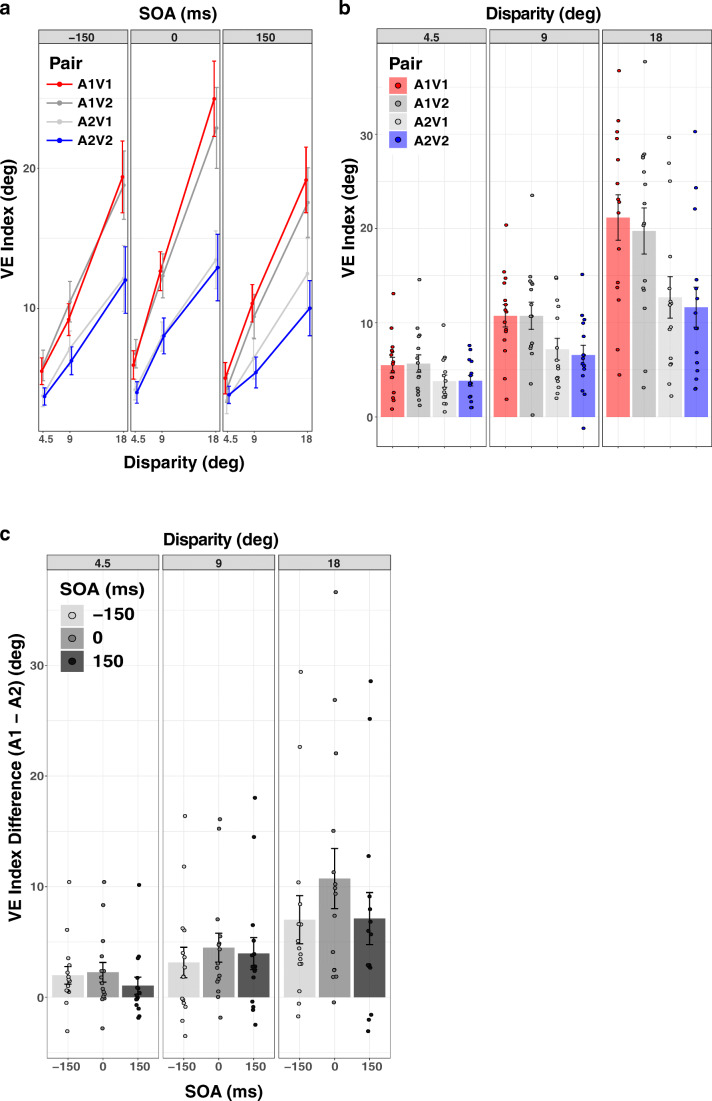
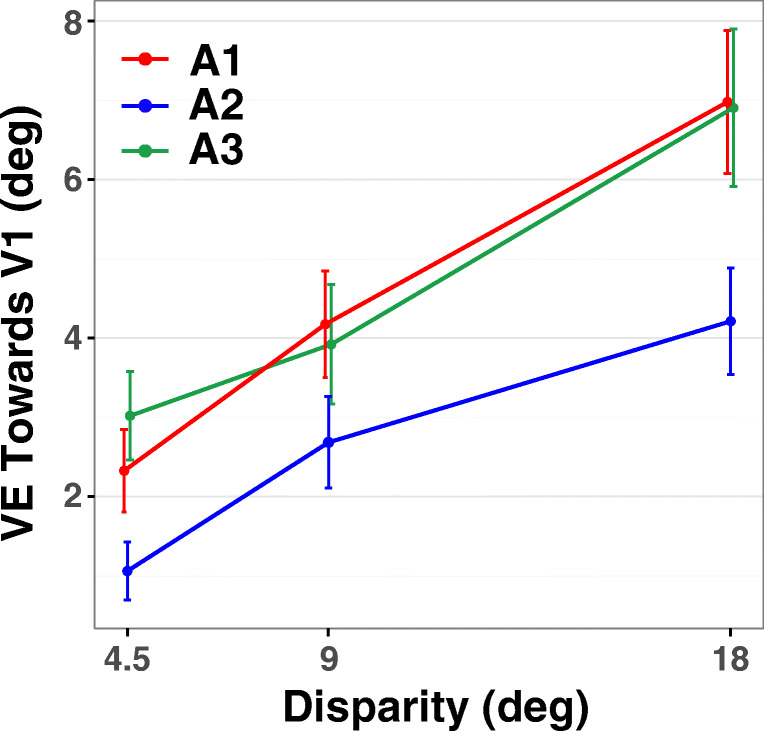
According to the Bayesian framework of multisensory integration, audiovisual stimuli associated with a stronger prior belief that they share a common cause (i.e., causal prior) are predicted to result in a greater degree of perceptual binding and therefore greater audiovisual integration. In the present psychophysical study, we systematically manipulated the causal prior while keeping sensory evidence constant. We paired auditory and visual stimuli during an association phase to be spatiotemporally either congruent or incongruent, with the goal of driving the causal prior in opposite directions for different audiovisual pairs. Following this association phase, every pairwise combination of the auditory and visual stimuli was tested in a typical ventriloquism-effect (VE) paradigm. The size of the VE (i.e., the shift of auditory localization towards the spatially discrepant visual stimulus) indicated the degree of multisensory integration. Results showed that exposure to an audiovisual pairing as spatiotemporally congruent compared to incongruent resulted in a larger subsequent VE (Experiment 1). This effect was further confirmed in a second VE paradigm, where the congruent and the incongruent visual stimuli flanked the auditory stimulus, and a VE in the direction of the congruent visual stimulus was shown (Experiment 2). Since the unisensory reliabilities for the auditory or visual components did not change after the association phase, the observed effects are likely due to changes in multisensory binding by association learning. As suggested by Bayesian theories of multisensory processing, our findings support the existence of crossmodal causal priors that are flexibly shaped by experience in a changing world.

Keywords: Audiovisual integration; Bayesian; Causal inference; Causal prior; Coupling prior; Crossmodal association; Multisensory binding; Multisensory processing; Priors; Ventriloquism effect.


Figures

Fig. 1
Fig. 1
Overall testing procedures for Experiments 1 and 2. Top: Experiment 1. Three testing days, each consisting of three alternating Association blocks and audiovisual (AV) Test blocks. The first and the last testing days had unimodal auditory (A) and visual (V) localization blocks at the beginning (Pre-tests) and the end (Post-tests), respectively, to track any possible changes in unimodal reliability or spatial biases over the course of the entire experiment. Bottom: Experiment 2. The same testing order as Experiment 1, but only for 1 day
Fig. 2.
Fig. 2.
Block designs. (a) Unimodal Pre- or Post-test (Experiments 1 and 2). Auditory (A) and visual (V) localization was tested in separate blocks, with counterbalanced order. (b) Association block (Experiments 1 and 2). A mixture of congruent, incongruent, and one-back trials. Participants only responded to the intermittent and rare one-back trials, which were included to ensure that participants were paying attention to the stimuli during the Association phase. The congruent pair A1V1 were presented at the same location in the experiments; the small vertical offset in the figure is only for display clarity purpose. Three types of stimuli were applied for incongruent trials: A2V2 (bimodal), A2 only, or V2 only. A2V2 was temporally separated by a large stimulus-onset asynchrony (SOA) randomly chosen from 750 to 1,500 ms, and spatially separated at a large disparity of ± 13.5°, ± 22.5°, ± 31.5°, or ± 40.5°. (c) Audiovisual Test block (Experiment 1). (d) Audiovisual Test block (Experiment 2). V1 and V2 flanked the auditory stimulus with equal discrepancies (4.5°, 9°, or 18°), and the sides that V1 and V2 appeared were counterbalanced. The A location, V location, and AV disparity values between (c) and (d) are for both figures (the figures only illustrate some of these values). For illustration purpose, in (b), (c), and (d) red is used to represent the congruent stimuli (“red” sound: A1; “red” flash: V1) and blue to represent the incongruent stimuli (“blue” sound: A2; “blue” flash: V2). In the experiments, the tone frequencies and flash colors used for the congruent pair (A1V1) versus the incongruent pair (A2V2) were counterbalanced across participants and consistent for an individual participant. “Green” sound in (d): a novel tone A3 (1,500 Hz sine tone), never presented during Association blocks. Positive location: stimulus on the right of the screen center. Negative location: stimulus on the left of the screen center. Positive AV disparity: V on the right of A. Negative AV disparity: V on the left of A. Positive SOA: V-leading. Negative SOA: A-leading
Fig. 3
Fig. 3
Ventriloquism effect (VE) data (Experiment 1). (a) VE index plotted as a function of audiovisual disparity for different stimulus-onset asynchronies (SOAs). (b) VE index averaged across SOAs, plotted for different audiovisual pairs. (c) VE index differences between A1 and A2 (VEA1-VEA2) averaged across V1 and V2, plotted for different SOAs. Dots: individual participants. Bars: condition means. Error bars: ± 1 SEM. Negative SOA: auditory first. Positive SOA: visual first. For illustration, lines and dots are slightly dodged horizontally to reduce overlap. Colors in (a) and (b) represent different AV pairs. Red: A1V1 (congruent). Dark gray: A1V2 (recombined). Light gray: A2V1 (recombined). Blue: A2V2 (incongruent)
Fig. 4
Fig. 4
Ventriloquism effect (VE) towards V1 (Experiment 2). VE index towards V1 (previously presented in the congruent audiovisual pair during the association phase), plotted as a function of audiovisual disparity. This index represents a net shift of auditory localization towards V1 when a pair of competing visual stimuli (V1 and V2) symmetrically and simultaneously flanked the auditory stimulus during test trials. Different colors represent different auditory stimuli tested: red = A1 (previously congruent), blue = A2 (previously incongruent), green = A3 (not presented during association phase). Lines are slightly dodged horizontally to reduce overlap for illustration purpose. Error bars: ± 1 SEM

References

    1. Adams WJ, Graf EW, Ernst MO. Experience can change the ‘light-from-above’ prior. Nature Neuroscience. 2004;7:1057–1058. doi: 10.1038/nn1312. - DOI - PubMed
    1. Angelaki DE, Gu Y, Deangelis GC. Multisensory integration: psychophysics , neurophysiology , and computation. Current Opinion in Neurobiology. 2009;19:452–458. doi: 10.1016/j.conb.2009.06.008. - DOI - PMC - PubMed
    1. Baier B, Kleinschmidt A, Muller NG. Cross-modal processing in early visual and auditory cortices depends on expected statistical relationship of multisensory information. Journal of Neuroscience. 2006;26(47):12260–12265. doi: 10.1523/JNEUROSCI.1457-06.2006. - DOI - PMC - PubMed
    1. Bakeman R. Recommended effect size statistics for repeated measures designs. Behavior Research Methods. 2005;37(3):379–384. doi: 10.3758/BF03192707. - DOI - PubMed
    1. Berkes P, Orbán G, Lengyel M, Fiser J. Spontaneous cortical activity reveals hallmarks of an optimal internal model. Science. 2011;6013:83–87. doi: 10.1126/science.1195870. - DOI - PMC - PubMed