

Estimation of incubation period and generation time based on observed length-biased epidemic cohort with censoring for COVID-19 outbreak in China
- PMID: 32627172
- PMCID: PMC7362037
- DOI: 10.1111/biom.13325
Estimation of incubation period and generation time based on observed length-biased epidemic cohort with censoring for COVID-19 outbreak in China
Abstract
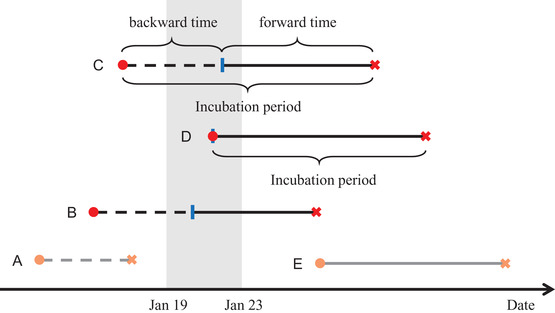
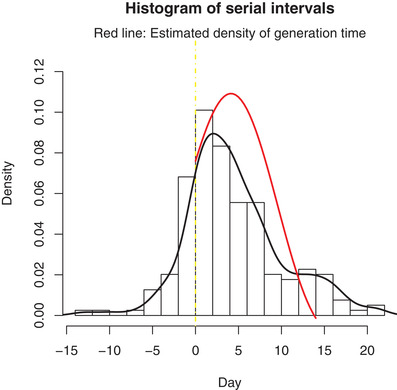
The incubation period and generation time are key characteristics in the analysis of infectious diseases. The commonly used contact-tracing-based estimation of incubation distribution is highly influenced by the individuals' judgment on the possible date of exposure, and might lead to significant errors. On the other hand, interval censoring-based methods are able to utilize a much larger set of traveling data but may encounter biased sampling problems. The distribution of generation time is usually approximated by observed serial intervals. However, it may result in a biased estimation of generation time, especially when the disease is infectious during incubation. In this paper, the theory from renewal process is partially adopted by considering the incubation period as the interarrival time, and the duration between departure from Wuhan and onset of symptoms as the mixture of forward time and interarrival time with censored intervals. In addition, a consistent estimator for the distribution of generation time based on incubation period and serial interval is proposed for incubation-infectious diseases. A real case application to the current outbreak of COVID-19 is implemented. We find that the incubation period has a median of 8.50 days (95% confidence interval [CI] [7.22; 9.15]). The basic reproduction number in the early phase of COVID-19 outbreak based on the proposed generation time estimation is estimated to be 2.96 (95% CI [2.15; 3.86]).
Keywords: deconvolution; interval censoring; mixture distribution; renewal process; serial interval.
© 2020 The International Biometric Society.
Figures
Comment on
-
Early Transmission Dynamics in Wuhan, China, of Novel Coronavirus-Infected Pneumonia.N Engl J Med. 2020 Mar 26;382(13):1199-1207. doi: 10.1056/NEJMoa2001316. Epub 2020 Jan 29. N Engl J Med. 2020. PMID: 31995857 Free PMC article.
References
-
- Anastassiou, G. (2000) Handbook of Analytic‐Computational Methods Applied Mathematics. Boca Raton, FL: Chapman & Hall/CRC.
-
- Bi, Q. , Wu, Y. , Mei, S. , Ye, C. , Zou, X. , Zhang, Z. et al. (2020) Epidemiology and transmission of COVID‐19 in 391 cases and 1286 of their close contacts in Shenzhen, China: a retrospective cohort study. The Lancet Infectious Diseases. Available at: 10.1016/S1473-3099(20)30287-5. - DOI - PMC - PubMed
-
- Cowling, B.J. , Muller, M.P. , Wong, I.O. , Ho, L.‐M. , Louie, M. , McGeer, A. et al. (2007) Alternative methods of estimating an incubation distribution: examples from severe acute respiratory syndrome. Epidemiology, 18, 253–259. - PubMed
Publication types
MeSH terms
Grants and funding
LinkOut - more resources
Full Text Sources
Medical
