. 2020 Jul 1;76(Pt 7):302-308.
doi: 10.1107/S2053230X20008201. Epub 2020 Jul 1.

Tartryl-CoA inhibits succinyl-CoA synthetase

Affiliations

Tartryl-CoA inhibits succinyl-CoA synthetase

Ji Huang et al. Acta Crystallogr F Struct Biol Commun. .

Abstract

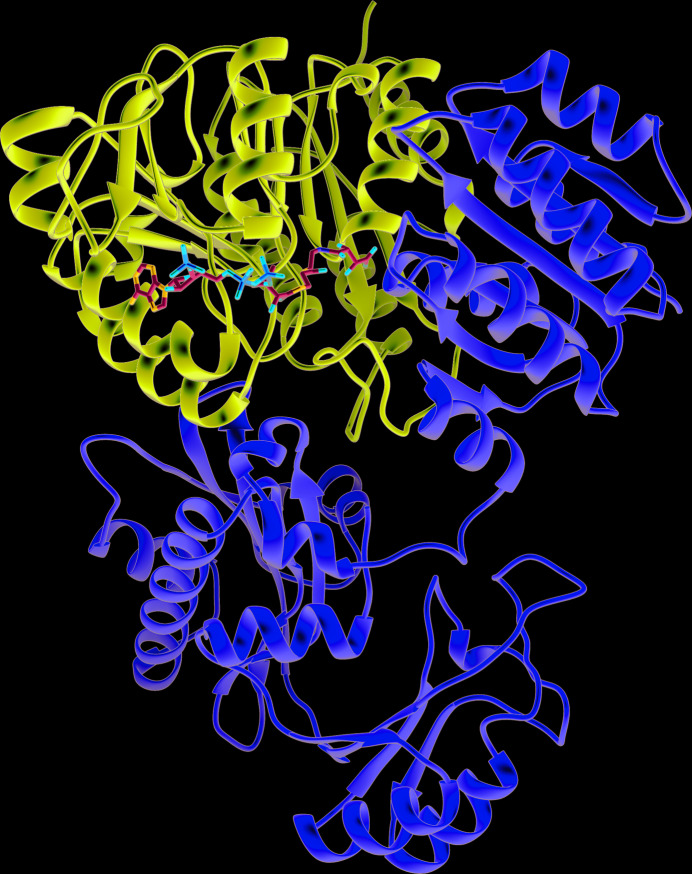
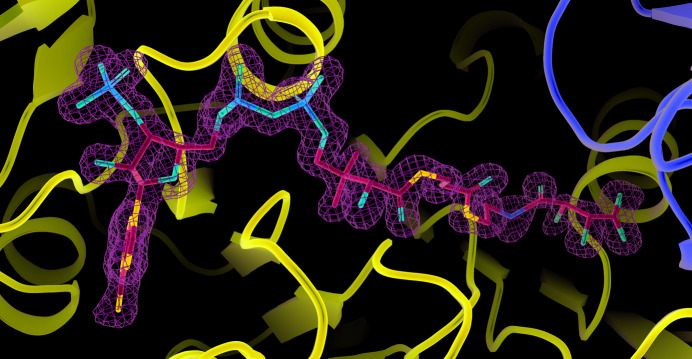
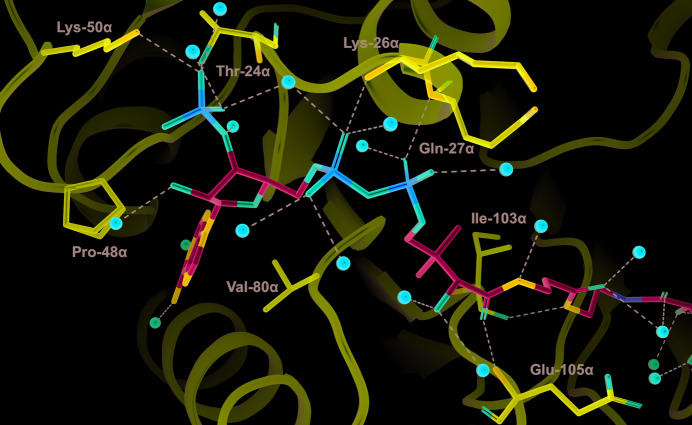
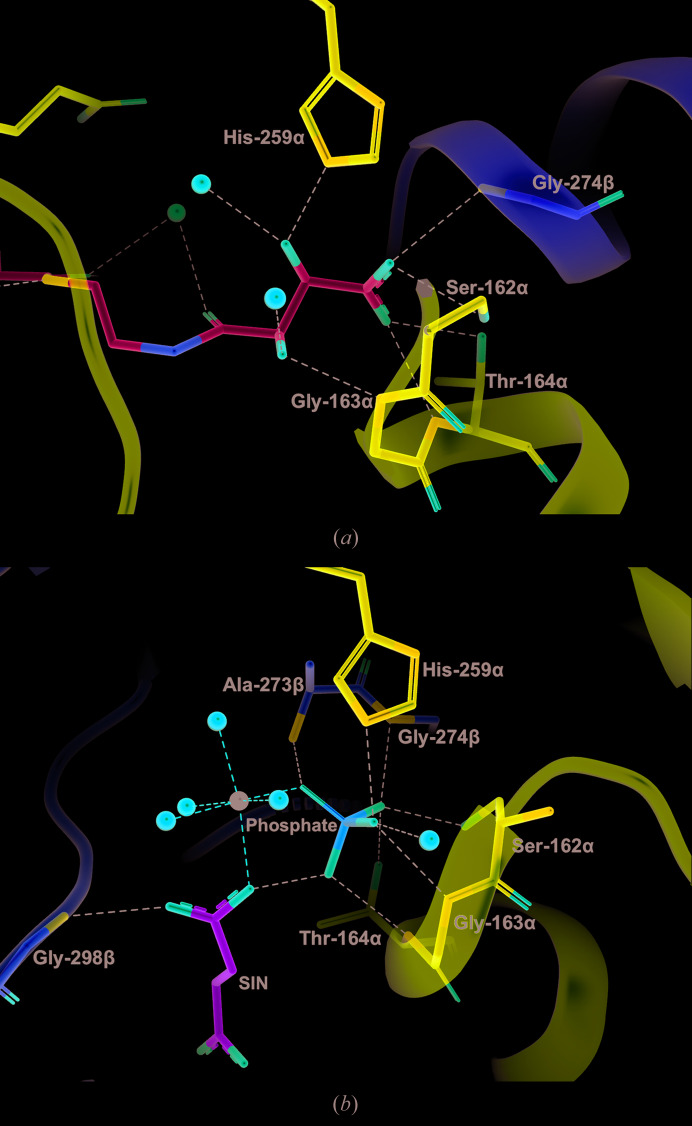
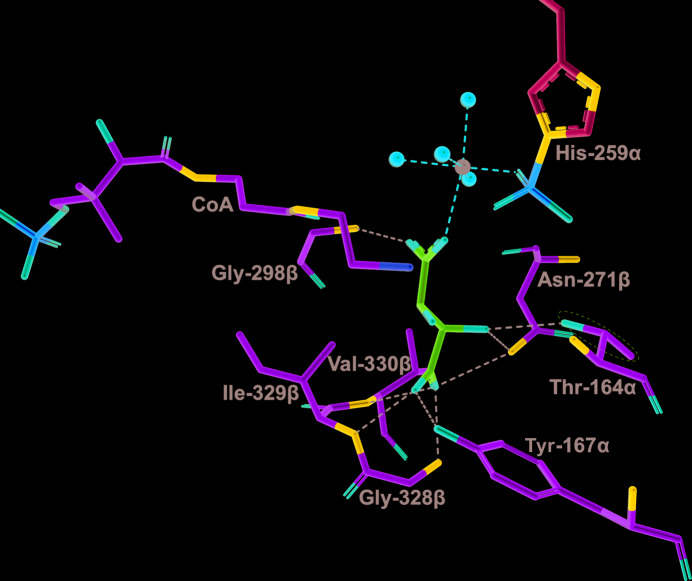
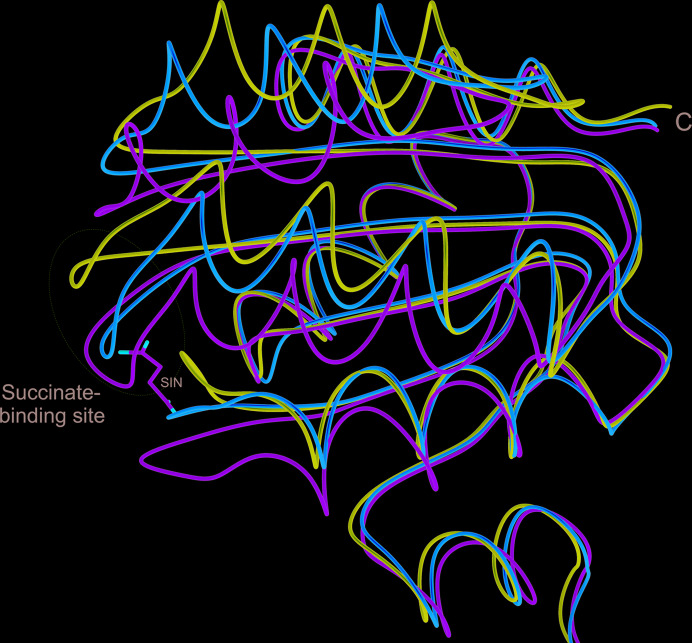
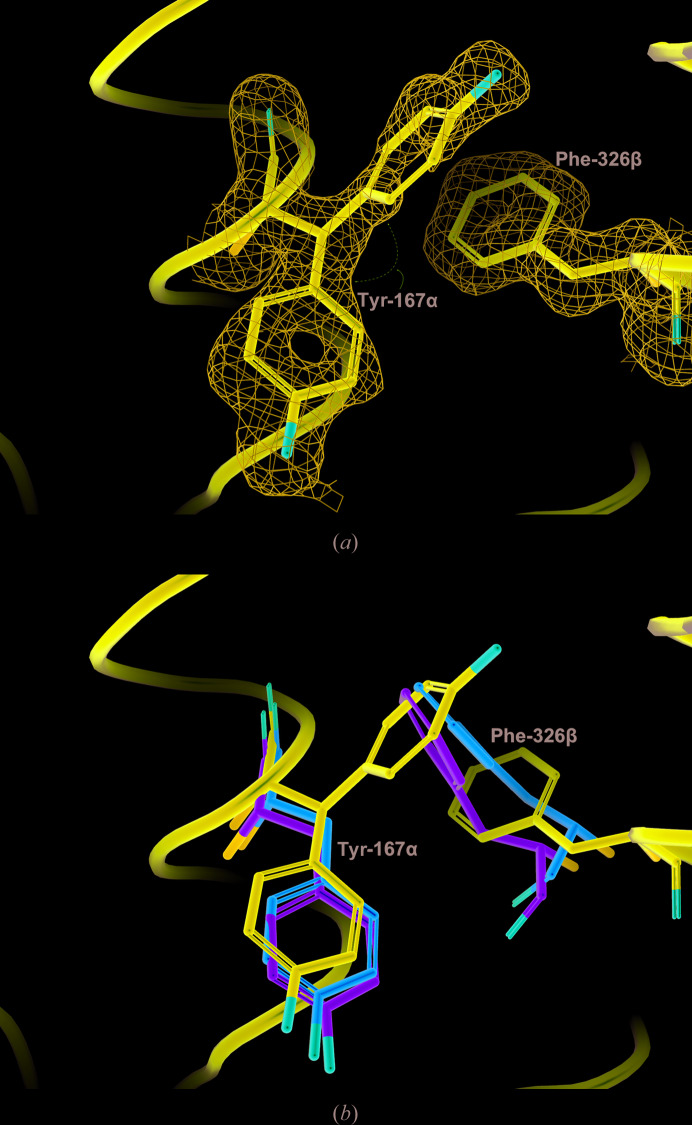
Succinyl-CoA synthetase (SCS) catalyzes the only substrate-level phosphorylation step in the tricarboxylic acid cycle. Human GTP-specific SCS (GTPSCS), an αβ-heterodimer, was produced in Escherichia coli. The purified protein crystallized from a solution containing tartrate, CoA and magnesium chloride, and a crystal diffracted to 1.52 Å resolution. Tartryl-CoA was discovered to be bound to GTPSCS. The CoA portion lies in the amino-terminal domain of the α-subunit and the tartryl end extends towards the catalytic histidine residue. The terminal carboxylate binds to the phosphate-binding site of GTPSCS.

Keywords: catalysis; succinyl-CoA synthetase; thioesters; tricarboxylic acid cycle.


Figures

Figure 1
Figure 1
Overall structure of tartryl-CoA bound to human GTPSCS. Tartryl-CoA is displayed as a stick model coloured by atom type. The α-subunit is shown in purple, while the β-subunit is shown in yellow; both are shown as ribbon diagrams. Figs. 1 ▸ and 6 ▸ were generated using UCSF Chimera (Pettersen et al., 2004 ▸).
Figure 2
Figure 2
Initial electron density for tartryl-CoA. The green net represents electron density from the F oF c map contoured at 3.0 r.m.s.d. Tartryl-CoA is displayed as a stick model coloured by atom type. In the ribbon diagram the α-subunit is in purple, while the β-subunit is in yellow. Figs. 2 ▸, 3 ▸, 4 ▸, 5 ▸ and 7 ▸ were generated using PyMOL version 2.4.0 (Schrödinger).
Figure 3
Figure 3
Interactions between the CoA portion of tartryl-CoA and GTPSCS. Tartryl-CoA is displayed as a stick model coloured by atom type, with the C atoms in cyan. Interacting residues of the α-subunit are displayed as stick models with purple C atoms. Water molecules are represented by red spheres. Black dashed lines represent interactions between tartryl-CoA and the protein or water molecules. The side chain of Pro48α displays two conformations.
Figure 4
Figure 4
Interactions between tartryl-CoA or phosphate and the phosphate-binding site of GTPSCS. (a) Tartryl-CoA and interacting residues are displayed as stick models. C atoms are shown in cyan for tartryl-CoA. (b) Phosphate, succinate and interacting residues of the protein in the structure of Mg2+-succinate-bound GTPSCS (PDB entry 5cae; Huang & Fraser, 2016 ▸) are drawn as stick models. C atoms are shown in green for succinate (abbreviated SIN). The magnesium ion is represented by a black sphere. The orientations are somewhat different to better show the substrates. For both structures, interacting residues of the α-subunit and β-­subunit are shown as stick models with purple and yellow C atoms, respectively, water molecules are represented by red spheres and interactions are represented by dashed lines.
Figure 5
Figure 5
Modelling tartrate in the active site of GTPSCS. The model is based on the structures of Mg2+-succinate-bound GTPSCS (PDB entry 5cae; Huang & Fraser, 2016 ▸) and phosphorylated GTPSCS (PDB entry 1eud; Fraser et al., 2000 ▸). The complex with Mg2+-succinate was superposed on phosphorylated GTPSCS using 300 Cα atoms of the α-subunit (r.m.s.d. 0.309 Å). Tartrate, shown as a stick model with magenta C atoms, was superposed on succinate. The phosphorylated His259α from the structure of phosphorylated GTPSCS is shown with cyan C atoms. The other residues, CoA, water molecules and the magnesium ion are from the structure of the Mg2+-succinate complex of GTPSCS and are shown with green C atoms. The side chain of Thr164α is highlighted since a different conformation was selected in order to form a hydrogen-bonding interaction with tartrate. The magnesium ion and water molecules are represented by black and red spheres, respectively. Black and red dashed lines represent the expected interactions between tartrate and GTPSCS and the expected octahedral coordination of the magnesium ion.
Figure 6
Figure 6
Structural superposition of the tartryl-CoA complex, the Mg2+-succinate complex (PDB entry 5cae) and the dephosphorylated form of GTPSCS (PDB entry 1euc). Superposition of the Mg2+-succinate complex on the tartryl-CoA complex was based on 300 Cα atoms of the α-subunit that were within 1.8 Å (r.m.s.d. of 0.447 Å); superposition of the dephos­phorylated form on the tartryl-CoA complex was based on 300 Cα atoms of the α-subunit that were within 1.8 Å (r.m.s.d. of 0.418 Å). The tube diagrams show the carboxy-terminal domain of the β-subunit of the tartryl-CoA complex in purple, that of the Mg2+-succinate complex in green and that of the dephosphorylated form in orange.
Figure 7
Figure 7
Conformations of Tyr167α and Phe326β in GTPSCS. (a) To show the reliability of the conformation of Phe326β and the alternate conformations of Tyr167α, the 2F oF c electron-density map for tartryl-CoA-bound GTPSCS is contoured around these residues (blue net contoured at 1.0 r.m.s.d.). (b) The tartryl-CoA complex, the Mg2+-succinate complex (PDB entry 5cae; Huang & Fraser, 2016 ▸) and the dephos­phorylated form of GTPSCS (PDB entry 1euc; Fraser et al., 2000 ▸) were superposed as in Fig. 6 ▸. Only portions of the ribbon diagram of the tartryl-CoA complex are drawn in purple. The side chains of Tyr167α and Phe326β are shown as stick models with C atoms coloured purple, green and orange for the tartryl-CoA complex, the Mg2+-succinate complex and the dephos­phorylated form of GTPSCS, respectively.

References

    1. Adler, J., Wang, S.-F. & Lardy, H. A. (1957). J. Biol. Chem. 229, 865–879. - PubMed
    1. Berman, H. M., Westbrook, J., Feng, Z., Gilliland, G., Bhat, T. N., Weissig, H., Shindyalov, I. N. & Bourne, P. E. (2000). Nucleic Acids Res. 28, 235–242. - PMC - PubMed
    1. Bishop, D. F., Tchaikovskii, V., Hoffbrand, A. V., Fraser, M. E. & Margolis, S. (2012). J. Biol. Chem. 287, 28943–28955. - PMC - PubMed
    1. Bruno, I. J., Cole, J. C., Kessler, M., Luo, J., Motherwell, W. D. S., Purkis, L. H., Smith, B. R., Taylor, R., Cooper, R. I., Harris, S. E. & Orpen, A. G. (2004). J. Chem. Inf. Comput. Sci. 44, 2133–2144. - PubMed
    1. Cha, S. & Parks, R. E. Jr (1964). J. Biol. Chem. 239, 1968–1977. - PubMed

MeSH terms

LinkOut - more resources