. 2020 Jul 6;16(7):e1008917.
doi: 10.1371/journal.pgen.1008917. eCollection 2020 Jul.

Genome wide distribution of G-quadruplexes and their impact on gene expression in malaria parasites

Affiliations

Genome wide distribution of G-quadruplexes and their impact on gene expression in malaria parasites

Elodie Gazanion et al. PLoS Genet. .

Abstract

Mechanisms of transcriptional control in malaria parasites are still not fully understood. The positioning patterns of G-quadruplex (G4) DNA motifs in the parasite's AT-rich genome, especially within the var gene family which encodes virulence factors, and in the vicinity of recombination hotspots, points towards a possible regulatory role of G4 in gene expression and genome stability. Here, we carried out the most comprehensive genome-wide survey, to date, of G4s in the Plasmodium falciparum genome using G4Hunter, which identifies G4 forming sequences (G4FS) considering their G-richness and G-skewness. We show an enrichment of G4FS in nucleosome-depleted regions and in the first exon of var genes, a pattern that is conserved within the closely related Laverania Plasmodium parasites. Under G4-stabilizing conditions, i.e., following treatment with pyridostatin (a high affinity G4 ligand), we show that a bona fide G4 found in the non-coding strand of var promoters modulates reporter gene expression. Furthermore, transcriptional profiling of pyridostatin-treated parasites, shows large scale perturbations, with deregulation affecting for instance the ApiAP2 family of transcription factors and genes involved in ribosome biogenesis. Overall, our study highlights G4s as important DNA secondary structures with a role in Plasmodium gene expression regulation, sub-telomeric recombination and var gene biology.


Conflict of interest statement

The authors have declared that no competing interests exist.

Figures
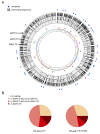
Fig 1
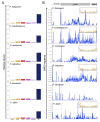
Fig 1. Distribution of G4FS across the P. falciparum 3D7 nuclear genome.
(A) The positions of G4FS using G4Hunter at threshold 1.2 (outer track), 1.5 (middle track) and 1.75 (inner track) are represented as black bars. The 14 chromosomes are represented in white rectangles on the inner track. Blue filled circles represent var genes location. (B) Number of overlapping G4FS sequences between G4Hunter and G4-seq in K+ (left panel) and K++PDS conditions (right panel) [31], according to the G4Hunter score.
Fig 2
Fig 2. Association of G4FS with genome features of P. falciparum.
(A) Fold-enrichment of G4FS in different genome features compared to 1,000 shuffling of G4H1.2 list. The dotted line indicates the fold-enrichment for the whole P. falciparum genome (value = 1.00). TSS: transcription start site. THSS: Tn5 hypersensitive sites. (B) Distribution profile of G4 motifs at threshold 1.2 around THSS peaks. The x-axis is centred on THSS peaks centre ± 1,000 bp. The red and blue lines correspond to G4FS on the coding and non-coding strands, respectively. (C) Boxplot representing the GC content in the different genomic features. The dotted line indicates the mean GC content of the P. falciparum genome. (D) Boxplot showing the G4 sequence length within promoters and in the whole genome. The mean sequence length (black point) of G4 within promoters was found significantly different from all G4 in the genome (two-tailed t-test, **p-value<0.01).
Fig 3
Fig 3. G4FS distribution within var genes in P. falciparum.
(A) Metagene plot of G4FS frequency in the var gene repertoire (middle panel) that displays a two-exon structure (upper panel). The 2-kb promoter region is delimited by dotted red line. The heat map illustrates G4 positions for each gene, from which metagene plot was built (lower panel). The grey boxes represent the four intragenic G4 clusters with high G4FS frequency. (B) Magnified view of the promoter region showing two conserved loci where G4FS are found on either strand. (C) Percent overlap of G4FS with the var exon 1 encoded N-terminal segment (NTS), Duffy binding-like (DBL) domains and Cys-rich inter-domain regions (CIDR). For each region, the total number of G4FS overlapping to the region intervals with a minimum overlap of 1 nt was calculated. A schematic presentation of the four major PfEMP1 domains is presented on top. TM: transmembrane segment; ATS: acidic terminal segment.
Fig 4
Fig 4. G4FS distribution in Laverania species.
(A) Relative density of G4FS for different genome features of various Plasmodium species from Laverania subgenus (G4Hunter, threshold 1.2). Plasmodium species are sorted according to their genetic distance from P. falciparum with the closest species on top. G4FS presented here are the results of G4Hunter analysis after applying a threshold of 1.2. (B) Metagene profiles of G4FS in var genes of Laverania species. The x-axis represents upstream (2 kb) and transcript region (delimited by dotted red line). G4FS frequency is plotted on y-axis. The most significant conserved motifs identified with MEME software [55] are illustrated on the upper right panel. No conserved motif was found for P. blacklocki.
Fig 5
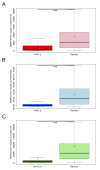
Fig 5. G4FS are associated to recombination events.
(A-C) Boxplots showing the distance from recombination breakpoints to the nearest G4FS for the three applied thresholds: G4H1.2 (A), G4H1.5 (B) and G4H1.75 (C). For comparison, a null dataset with 10 randomizations of recombination sites was generated and one random condition is shown for each threshold. The mean distance to recombination breakpoints of each G4H list (black point) was found significantly different from null dataset (Wilcoxon test, ***p-value <0.001).
Fig 6
Fig 6. Biophysical characterization and transcriptional control of G4FS in var promoters.
(A) Circular dichroism (CD) spectra of the three selected G4FS in var promoters. The measurements were carried out in 100 mM KCl at 6 μM and at 5°C, except PF3D7_0800100_pos which was folded at 3 μM and at 20°C. The G4 oligonucleotide sequences are presented in Table 3. (B) Thermal difference spectra (TDS) of the three G4FS and mPF3D7_0800100_neg, the mutated version of PF3D7_0800100_neg, in 100 mM KCl and at 4 μM. (C) Fluorescence emission spectra of ThT in the presence of selected G4FS. DNA samples were prepared at 1 μM in 100 mM KCl and incubated with 0.5 μM ThT. The c-Myc and dT30 sequences (Table 3) were used as positive and negative controls, respectively. (D) Isothermal difference spectra (IDS) of the G4FS at 20°C. The DNA samples were folded in 100 mM KCl at 4 μM.
Fig 7
Fig 7. Transcriptional control of G4FS in var promoters.
(A) Growth curve analysis and IC50 determination of P. falciparum 3D7 strain treated with PDS using Desjardins experiment [62]. Error bars represent standard deviations of experiments done in triplicate. (B) Promoter-driven luciferase assay performed by transient transfection of P. falciparum at ring stage (dark grey bars) with plasmids that encode the luciferase gene under calmodulin gene promoter with the G4 sequence that was cloned upstream the promoter. Parasites were maintained for 48h before saponin-lysis and luciferase signal measurement. In parallel, parasites were treated with 1 μM pyridostatin (PDS) (light grey bars). Results are the mean of three independent experiments (two-tailed t-test, **p-value<0.01).
Fig 8
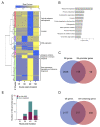
Fig 8. Transcriptome profiling of PDS-treated parasites.
(A) Heat map of RNA-Seq data with hierarchical clustering based on gene expression profiles. Heat map colours ranging from blue to yellow indicate increasing log2 fold-change of expressed genes (rows) in PDS-treated parasites at the different time-points (columns) as compared to untreated parasites (adj. p-value <0.01 and fold-change >2). On the right panel, the gene ontology (GO) enrichment analysis was performed for genes within each cluster using PlasmoDB [46]. (B) GO enrichment analysis of differentially expressed genes during PDS treatment using topGO. The 10 top highly enriched GO Biological Processes categories are shown (p-value < 0.05). (C-D) Venn diagrams showing the number of differentially expressed (DE) genes that overlap with G4-promoter genes (C) and G4-containing genes (D). (E) Number of up- and down-regulated genes that contain a G4 in their promoter at the different time-points.
Fig 9
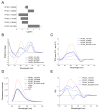
Fig 9. Validation of RNA-Seq data by qRT-PCR and biophysical characterization of selected G4FS.
(A) Relative expression of selected target genes expressed in log2 Fold-change (Log2FC). Error bars correspond to the standard deviation of the ΔΔCT value. (B) CD spectra of four promoter G4FS. For PF3D7_0613300-no-tail, an 8-nt 5’ tail has been removed. The G4 oligonucleotide sequences are shown in Table 3. (C) Thermal difference spectra (TDS) of selected G4FS. For CD and TDS, DNA samples were folded at 20°C in 100 mM KCl at 6 μM, except PF3D7_0613300 with and without tail, which have been folded at 3 μM at 5°C. (D) Fluorescence emission spectra of ThT in the presence of selected G4FS. The c-Myc and dT30 sequences were used as positive and negative controls, respectively. (E) Isothermal difference spectra (IDS) of the four promoter G4FS.

References

    1. WHO. World malaria report 2018. WHO website. 2018. http://www.who.int/malaria/publications/world-malaria-report-2018/report...
    1. Bozdech Z, Llinás M, Pulliam BL, Wong ED, Zhu J, DeRisi JL. The transcriptome of the intraerythrocytic developmental cycle of Plasmodium falciparum. PLoS Biol. 2003;1: E5 10.1371/journal.pbio.0000005 - DOI - PMC - PubMed
    1. van Noort V, Huynen MA. Combinatorial gene regulation in Plasmodium falciparum. Trends Genet. 2006;22: 73–8. 10.1016/j.tig.2005.12.002 - DOI - PubMed
    1. Scherf A, Lopez-Rubio JJ, Riviere L. Antigenic variation in Plasmodium falciparum. Annu Rev Microbiol. 2008;62: 445–470. 10.1146/annurev.micro.61.080706.093134 - DOI - PubMed
    1. Kraemer SM, Kyes SA, Aggarwal G, Springer AL, Nelson SO, Christodoulou Z, et al. Patterns of gene recombination shape var gene repertoires in Plasmodium falciparum: comparisons of geographically diverse isolates. BMC Genomics. 2007;8: 45 10.1186/1471-2164-8-45 - DOI - PMC - PubMed

Publication types