. 2020 Jul 6;15(7):e0235335.
doi: 10.1371/journal.pone.0235335. eCollection 2020.

Enhanced oxidative stress and damage in glycated erythrocytes

Affiliations

Enhanced oxidative stress and damage in glycated erythrocytes

Chloé Turpin et al. PLoS One. .

Abstract

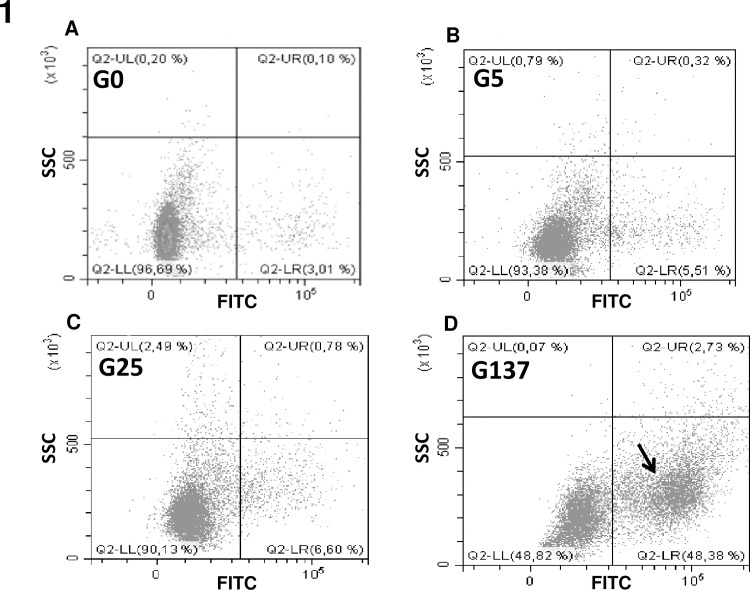
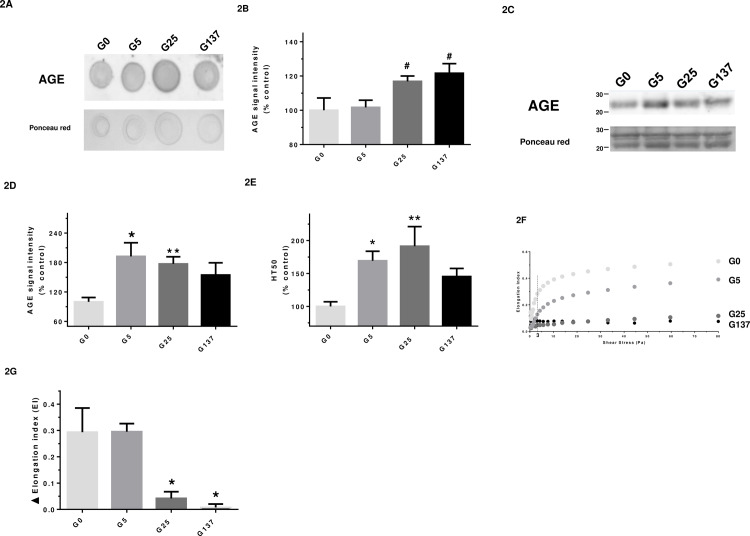
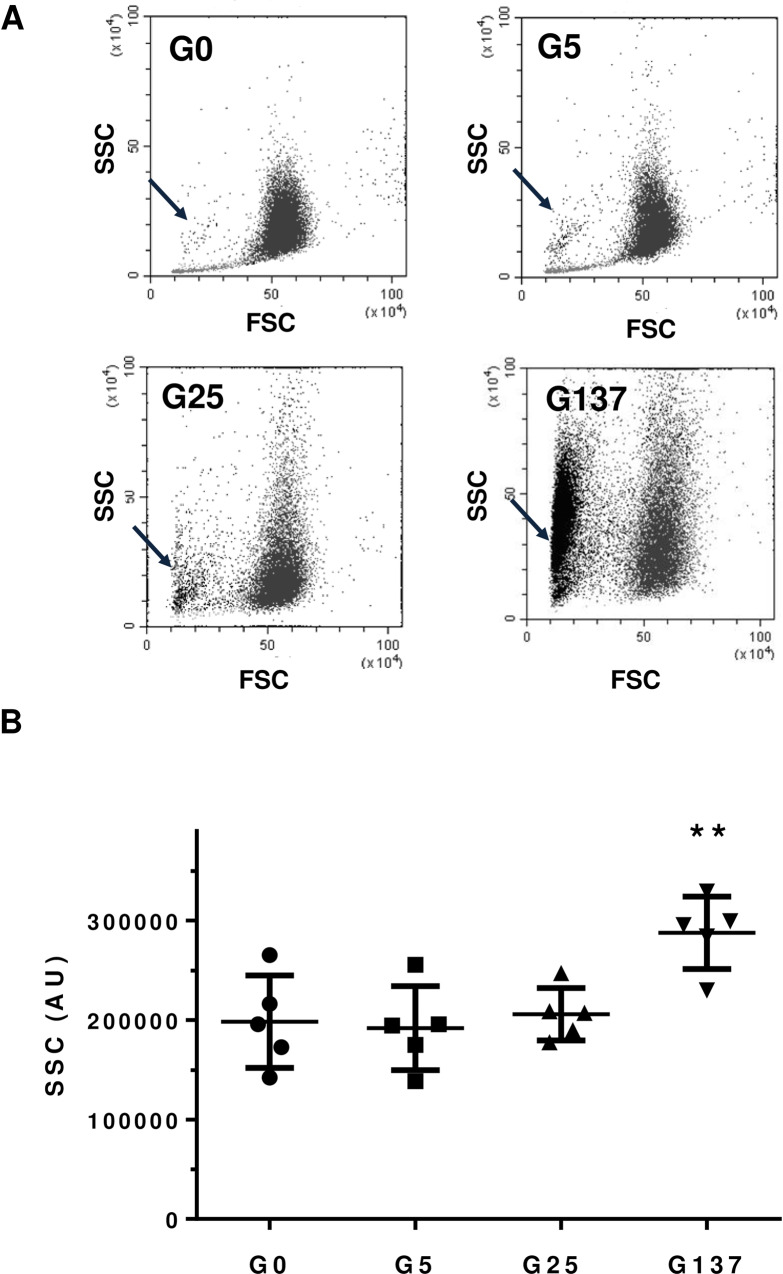
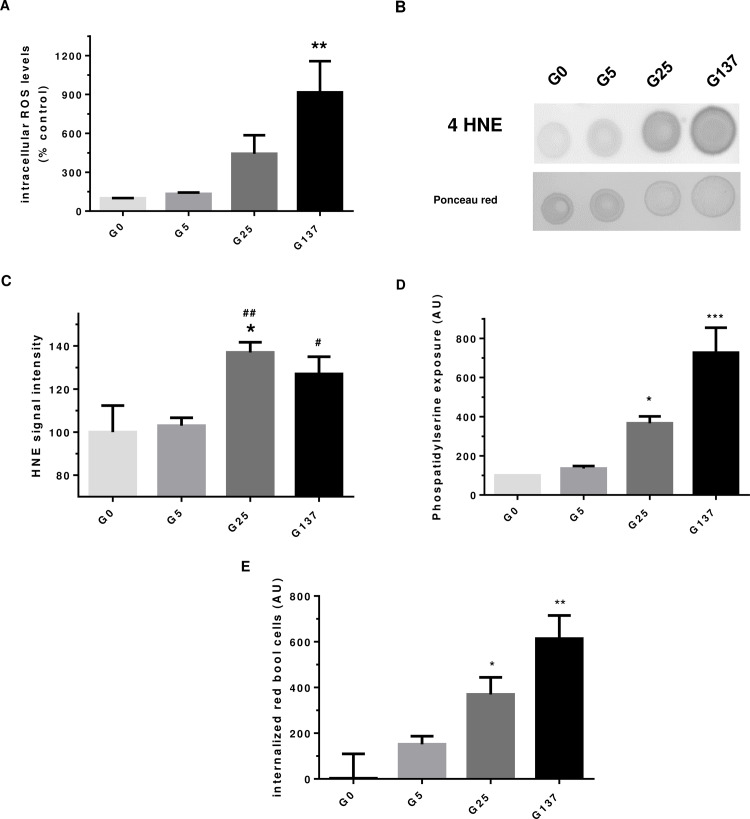
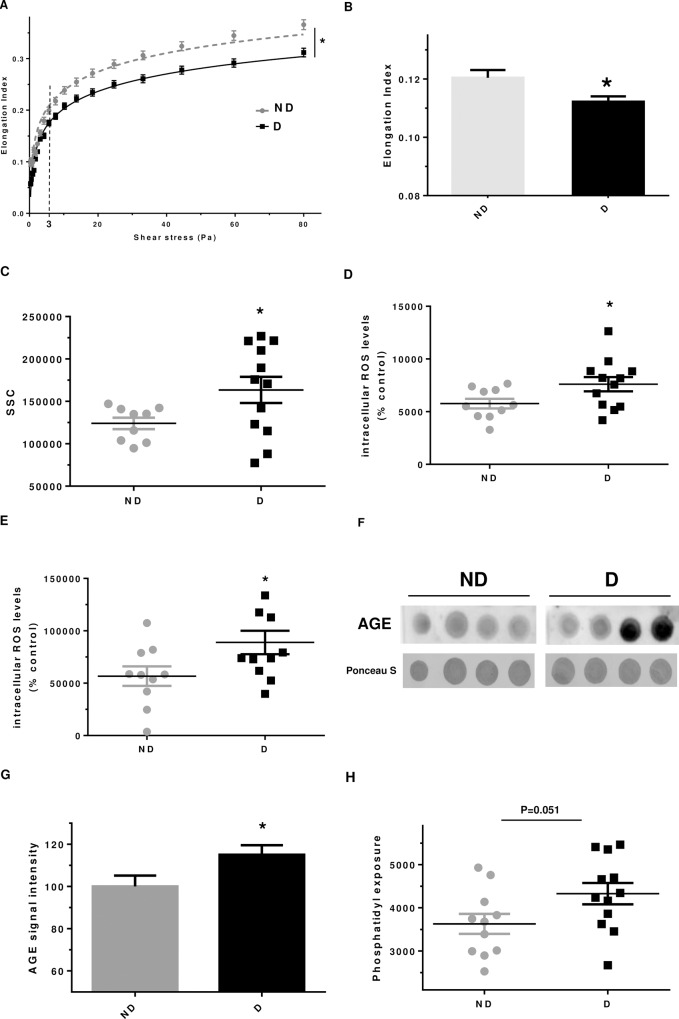
Diabetes is associated with a dramatic mortality rate due to its vascular complications. Chronic hyperglycemia in diabetes leads to enhanced glycation of erythrocytes and oxidative stress. Even though erythrocytes play a determining role in vascular complications, very little is known about how erythrocyte structure and functionality can be affected by glycation. Our objective was to decipher the impact of glycation on erythrocyte structure, oxidative stress parameters and capacity to interact with cultured human endothelial cells. In vitro glycated erythrocytes were prepared following incubation in the presence of different concentrations of glucose. To get insight into the in vivo relevance of our results, we compared these data to those obtained using red blood cells purified from diabetics or non-diabetics. We measured erythrocyte deformability, susceptibility to hemolysis, reactive oxygen species production and oxidative damage accumulation. Altered structures, redox status and oxidative modifications were increased in glycated erythrocytes. These modifications were associated with reduced antioxidant defence mediated by enzymatic activity. Enhanced erythrocyte phagocytosis by endothelial cells was observed when cultured with glycated erythrocytes, which was associated with increased levels of phosphatidylserine-likely as a result of an eryptosis phenomenon triggered by the hyperglycemic treatment. Most types of oxidative damage identified in in vitro glycated erythrocytes were also observed in red blood cells isolated from diabetics. These results bring new insights into the impact of glycation on erythrocyte structure, oxidative damage and their capacity to interact with endothelial cells, with a possible relevance to diabetes.


Conflict of interest statement

The authors have declared that no competing interests exist.

Figures

Fig 1
Fig 1. Early glycation product detection by using fluorescent boronic acids.
Cytometry analysis of our erythrocyte preparations was performed as described in material and method section. Following probing with fluorescent boronic acids, erythrocyte populations were gated according to cell location in a side scatter (SSC) parameter vs. FITC fluorescence. Black arrow evidences the specific population of glycated positive erythrocytes that become predominant when they were incubated with increasing concentrations of glucose.
Fig 2
Fig 2. Glycated erythrocytes exhibit an impaired deformability capacity.
In this figure, G0, G5, G25 and G137 represent the four conditions of incubation to which erythrocytes were subjected: 0, 5, 25 and 137 mmol/l glucose, respectively. (A) Representative AGE dot blot performed on lysate preparations (n = 4); (B) Quantification of AGE signal normalized with Ponceau S signal in the different erythrocyte preparations. Results are expressed as mean ± SEM of 3 to 4 experiments performed independently. #p<0.05 vs. G5 (Student’s t test, n = 3 to 4); (C) Representative AGE western blot performed on lysate preparations (n = 4); (D) Quantification of AGE signal normalized with ponceau red signal in the different erythrocyte preparations. Results are expressed as mean ± SEM of 4 experiments performed independently. *p<0.05, **p<0.01 vs. G0 (Student’s t test, n = 4). (E) HT50 was measured by the free-radical hemolysis test as described in method section. Results are expressed as mean ± SEM of 5 to 8 experiments performed independently. *p<0.05, **p< 0.01 indicates a significant difference vs. G0 (One-way ANOVA followed by Dunnett’s test) n = 5 independent analyses; (F) Curves correspond to the elongation index of erythrocytes determined by LORRCA measurement as a function of shear stress intensity (Pa); (G) Histograms correspond to the calculated variation in elongation index (delta EI) reflecting capacity of erythrocytes to deform when submitted to a shear stress ranking from 0 to 80 Pa. Results are expressed as mean ± SEM. *p<0.05 indicates a significant difference as compared to G0 (One-way ANOVA followed by Dunnett’s test) n = 3 independent replicates.
Fig 3
Fig 3. Glycation alters erythrocyte morphology.
Cytometry analysis of our erythrocytes preparation was performed as described in material and method section. GX corresponds to erythrocytes incubated with X mM glucose and G0 corresponds to erythrocytes incubated in the absence of glucose. (A) Erythrocyte populations were gated according to cell location in a forward scatter (FSC) versus a side scatter (SSC) parameter. Black arrow evidences the specific population of glycated altered erythrocytes that become predominant when they were incubated with increasing concentrations of glucose. (B) SSC parameters of our erythrocytes preparation were performed as described in material and method section **p<0,01 indicates a significant difference vs. G0 (Student’s t test).
Fig 4
Fig 4. Enhanced oxidative stress and damages in glycated erythrocytes.
In this figure, G0, G5, G25 and G137 represent the four conditions of incubation to which erythrocytes were subjected: 0, 5, 25 and 137 mmol/l glucose, respectively. (A) Intracellular ROS formation levels in erythrocyte preparation was determined using DHE probe by cytometry. Results are expressed as mean ± SEM (n = 4), **p<0.01 indicates a significant difference vs. G0 (one way ANOVA followed by Dunnet’s test). (B) 4-HNE dot blot image is representative of four dot blot experiments. (C) 4-HNE signal quantification was expressed as mean ± SEM (n = 4), *p<0.05 (vs. G0), #p<0.05, ##p<0.01 (vs. G5) using Student’s t test. (D) Phosphatidyl serine (PS) exposure in erythrocytes preparations was evaluated by cytometry as described in method section. Data are expressed as mean ± SEM, *p< 0.05, ***p< 0.001 vs. G0 (one-way ANOVA followed by Dunnett’s test, n = 4). (E) Internalized red blood cell in cultured EA.hy926 cell lines was determined by DAF assay and are expressed in arbitrary unit as mean ± SEM (n = 3), *p < 0.05, **p< 0.01 (one-way ANOVA followed by Dunnett’s test).
Fig 5
Fig 5. Erythrocytes from diabetics exhibit altered morphology and enhanced oxidative stress.
(A) Curves correspond to the elongation index of erythrocytes determined by LORRCA measurement as a function of the shear stress intensity (in Pascal unit). (B) Delta elongation index, results are mean ± SEM (n = 9 ND and 12 D), *p<0.05 (Student’s t test). (C) Geo mean Side Scatter (SSC) value of erythrocytes analysed by flow cytometry, *p<0.05 (Student’s t test). (D) Intracellular ROS formation level in erythrocyte evaluated using DHE probe by cytometry, *p<0.05 (Student’s t test). (E) Intracellular ROS formation in erythrocyte preparation was evaluated using DCFDA probe by cytometry. Results are expressed as mean ± SEM, *p<0.05 (Student’s t test). (FE) Phosphatidylserine exposure in erythrocytes preparations was quantified by cytometry as described in method section. (G) Representative AGE dot blot performed on lysate preparations of erythrocytes isolated from diabetic and non-diabetic individuals. (HF) AGE quantification by dot blot, n = 9 ND and 12 D, *p<0.05 (Student’s t test).

References

    1. Hu FB, Satija A, Manson JE (2015) Curbing the Diabetes Pandemic: The Need for Global Policy Solutions. JAMA 313: 2319–2320. 10.1001/jama.2015.5287 - DOI - PMC - PubMed
    1. Cooper ME, El-Osta A, Allen TJ, Watson AMD, Thomas MC, et al. (2018) Metabolic Karma-The Atherogenic Legacy of Diabetes: The 2017 Edwin Bierman Award Lecture. Diabetes 67: 785–790. 10.2337/dbi18-0010 - DOI - PubMed
    1. Sarwar N, Gao P, Seshasai SR, Gobin R, Kaptoge S, et al. (2010) Diabetes mellitus, fasting blood glucose concentration, and risk of vascular disease: a collaborative meta-analysis of 102 prospective studies. Lancet 375: 2215–2222. 10.1016/S0140-6736(10)60484-9 - DOI - PMC - PubMed
    1. Sies H (2015) Oxidative stress: a concept in redox biology and medicine. Redox Biol 4: 180–183. 10.1016/j.redox.2015.01.002 - DOI - PMC - PubMed
    1. Jaisson S, Gillery P (2010) Evaluation of nonenzymatic posttranslational modification-derived products as biomarkers of molecular aging of proteins. Clin Chem 56: 1401–1412. 10.1373/clinchem.2010.145201 - DOI - PubMed

Publication types