Randomized Controlled Trial
. 2020 Jul 6;16(7):e1008036.
doi: 10.1371/journal.pcbi.1008036. eCollection 2020 Jul.

Is mammography screening beneficial: An individual-based stochastic model for breast cancer incidence and mortality

Affiliations
Randomized Controlled Trial

Is mammography screening beneficial: An individual-based stochastic model for breast cancer incidence and mortality

Thuy T T Le et al. PLoS Comput Biol. .

Abstract

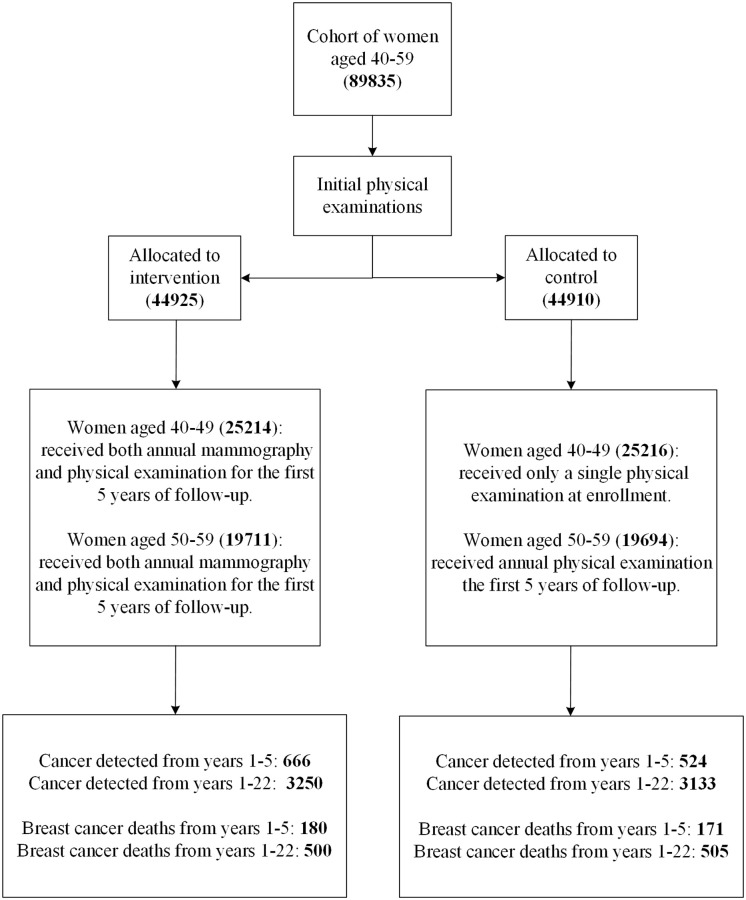
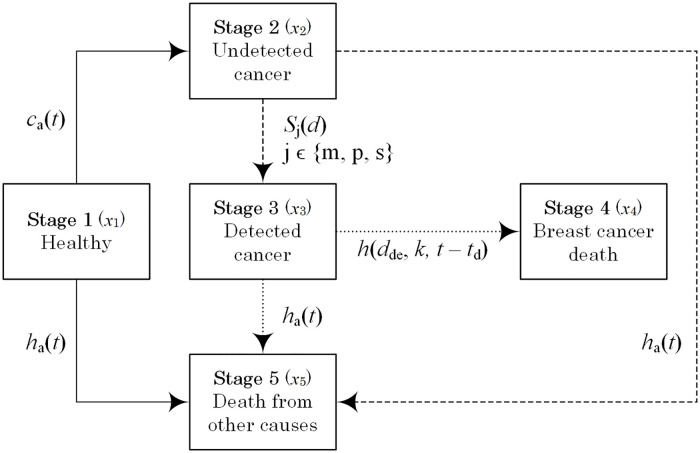
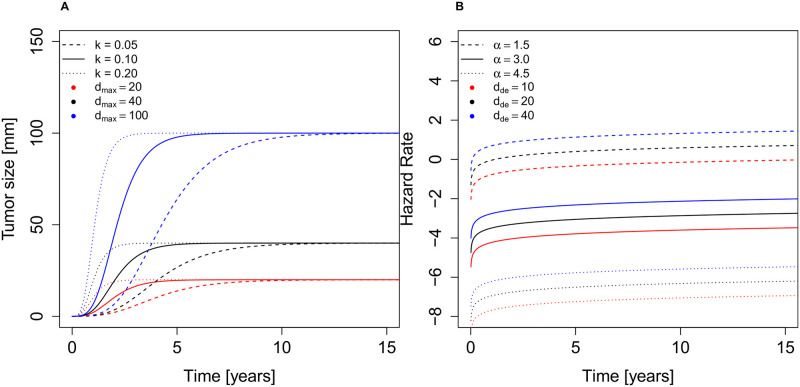
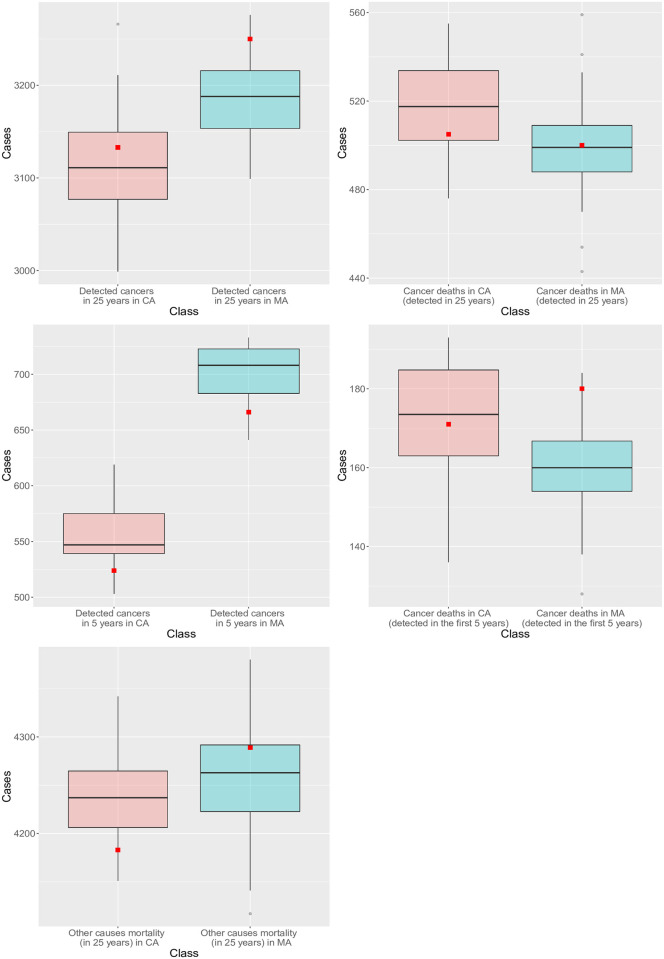
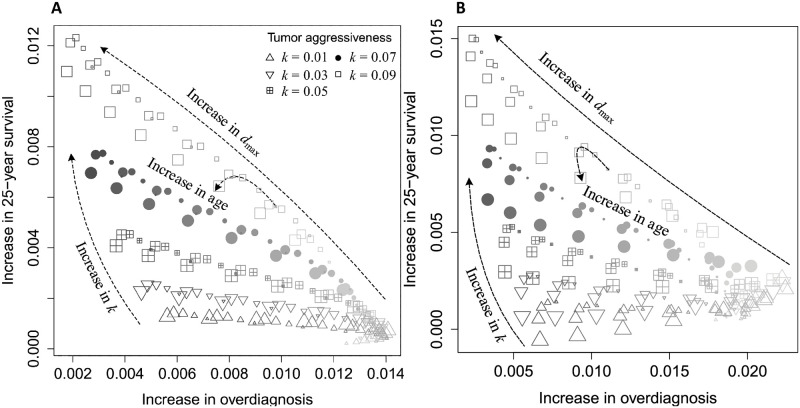
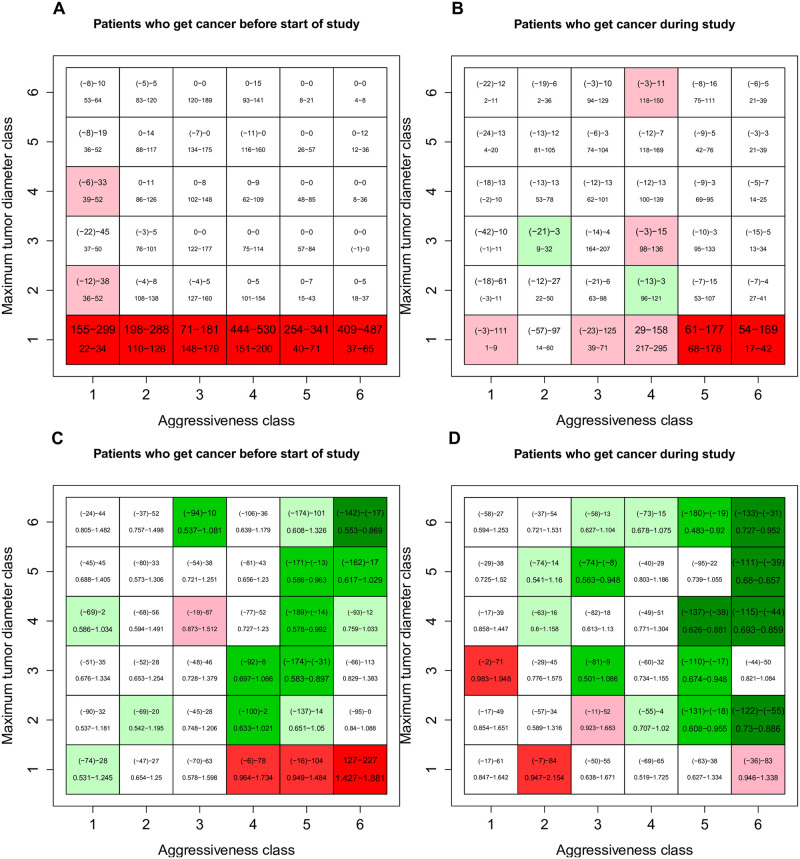
The benefits of mammography screening have been controversial, with conflicting findings from various studies. We hypothesize that unmeasured heterogeneity in tumor aggressiveness underlies these conflicting results. Based on published data from the Canadian National Breast Screening Study (CNBSS), we develop and parameterize an individual-based mechanistic model for breast cancer incidence and mortality that tracks five stages of breast cancer progression and incorporates the effects of age on breast cancer incidence and all-cause mortality. The model accurately reproduces the reported outcomes of the CNBSS. By varying parameters, we predict that the benefits of mammography depend on the effectiveness of cancer treatment and tumor aggressiveness. In particular, patients with the most rapidly growing or potentially largest tumors have the highest benefit and least harm from the screening, with only a relatively small effect of age. However, the model predicts that confining mammography to populations with a high risk of acquiring breast cancer increases the screening benefit only slightly compared with the full population.


Conflict of interest statement

The authors have declared that no competing interests exist.

Figures

Fig 1
Fig 1. Flow diagram of the CNBSS [19].
Values in parentheses indicate the number of individuals in each compartment.
Fig 2
Fig 2. Diagram of the stages of breast cancer incidence and mortality in BCHAM.
Solid arrows indicate transitions from the healthy state, long-dashed arrows from the undetected state, and short-dashed arrows from the detected state.
Fig 3
Fig 3
A) Effects of tumor aggressiveness k and maximum tumor diameter dmax on Gompertz growth. B) Effects of treatment effectiveness α and tumor size at detection dde on the hazard rate in a semi-log graph where k is kept fixed at 0.1.
Fig 4
Fig 4. The number of simulated (box-plots) versus recorded (red square, CNBSS) breast cancers diagnosed and deaths from breast cancer in mammography arm (MA) and control arm (CA).
Fig 5
Fig 5. Simulated (box-plots) versus recorded (red square, CNBSS) number of breast cancers diagnosed in mammography arm (MA) and control arm (CA) by study year.
Fig 6
Fig 6. Survivorship as a function of the treatment effectiveness parameter α.
Fig 7
Fig 7. Benefit (increase in probability of surviving patients after 25 years of follow-up) and harm (increase in probability of patients diagnosed with cancers that would not have been the cause of death) of mammography screening.
Size of dots indicates age, the size increases with age. Color saturation increases with value of dmax. Markers indicate value of k, triangle (square) corresponds to the smallest (largest) value of k. A) The baseline case, and B) the high risk case with an increase of breast cancer incidence by a factor of 5 in comparison with the baseline case presented.
Fig 8
Fig 8. Comparison of simulated mammography and control arms after bootstrap analysis.
The aggressiveness class indicates the value of the tumor aggressiveness parameter k (1 represents k < 0.0275, 2 from 0.0275–0.0400, 3 from 0.040–0.0543, 4 from 0.0543–0.0726, 5 from 0.0726–0.104 and 6 values greater than 0.104). The maximum tumor diameter class indicates the parameter dmax, with all values in mm (1 represents dmax < 22.36, 2 from 22.36–43.36, 3 from 43.36–64.16, 4 from 64.16–85.05, 5 from 85.05–106.4 and 6 values greater than 106.4). Ranges are from 500 bootstrap replicates of the simulated data. Panels A) and B) show the difference in the number of patients per thousand diagnosed (top number) and the difference in the number per thousand who would have died first of other causes with ineffective treatment (bottom number, α = 2.5). Colors indicate the significance of the difference in probability of diagnosis in the two arms (red for higher in mammography arm, green for lower). Panels C) and D) show the difference in the number of patients per thousand who died of any cause (top number) and the hazard ratio associated with mammography (bottom number) and colors indicate the significance of the effect of mammography on survival (red for higher hazard in the mammography arm, green for lower).

References

    1. Siegel RL, Miller KD, Jemal A. Cancer statistics, 2018. CA: A Cancer Journal for Clinicians. 2018;68(1):7–30. - PubMed
    1. Shapiro S, Strax P, Venet L. Periodic breast cancer screening in reducing mortality from breast cancer. Jama. 1971;215(11):1777–1785. - PubMed
    1. Roberts M, Alexander F, Anderson T, Forrest A, Hepburn W, Huggins A, et al. The Edinburgh randomised trial of screening for breast cancer: description of method. British journal of cancer. 1984;50(1):1 10.1038/bjc.1984.132 - DOI - PMC - PubMed
    1. Alexander F, Anderson T, Brown H, Forrest A, Hepburn W, Kirkpatrick A, et al. The Edinburgh randomised trial of breast cancer screening: results after 10 years of follow-up. British journal of cancer. 1994;70(3):542 10.1038/bjc.1994.342 - DOI - PMC - PubMed
    1. Miller AB, Wall C, Baines CJ, Sun P, To T, Narod SA. Twenty five year follow-up for breast cancer incidence and mortality of the Canadian National Breast Screening Study: randomised screening trial. Bmj. 2014;348:g366 10.1136/bmj.g366 - DOI - PMC - PubMed

Publication types