. 2020 Aug 12;20(8):6135-6141.
doi: 10.1021/acs.nanolett.0c02280. Epub 2020 Jul 8.

In Vivo Single-Molecule Detection of Nanoparticles for Multiphoton Fluorescence Correlation Spectroscopy to Quantify Cerebral Blood Flow

Affiliations

In Vivo Single-Molecule Detection of Nanoparticles for Multiphoton Fluorescence Correlation Spectroscopy to Quantify Cerebral Blood Flow

Xu Fu et al. Nano Lett. .

Abstract

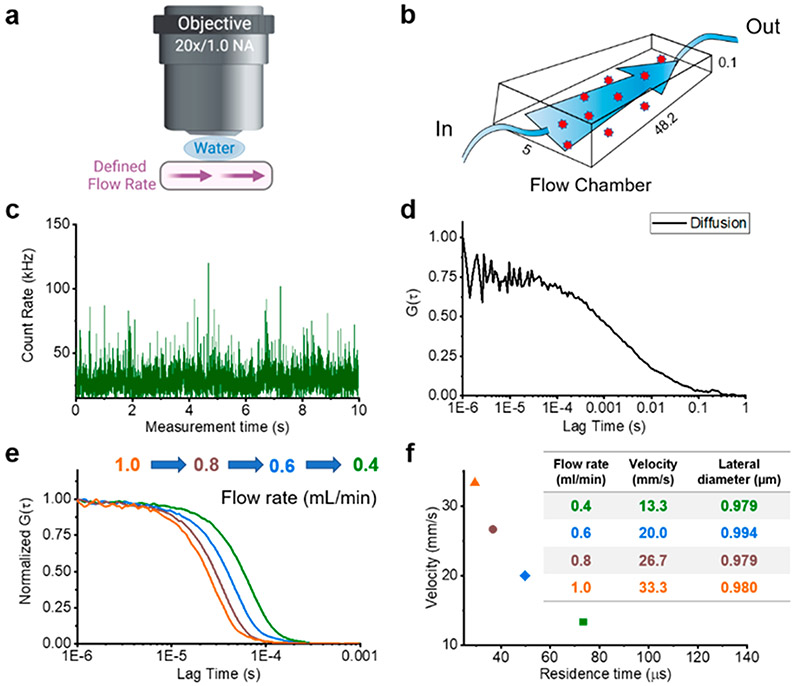
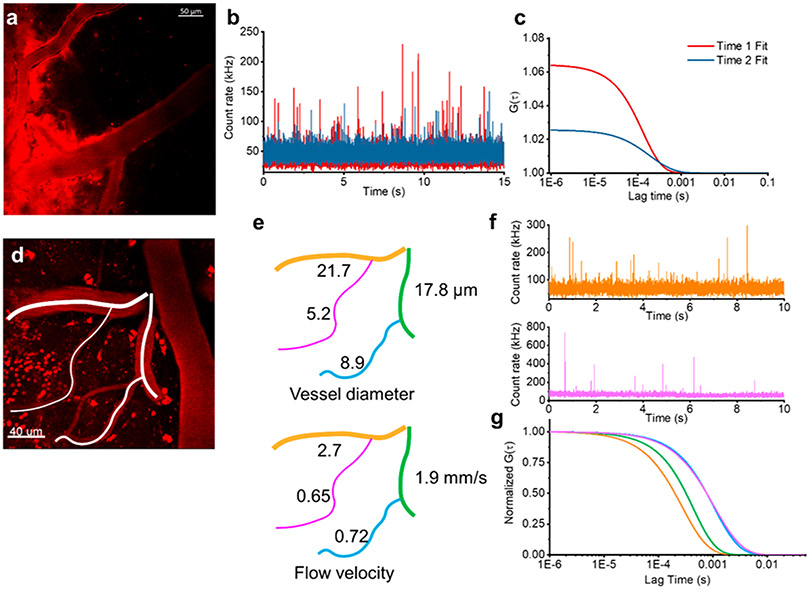
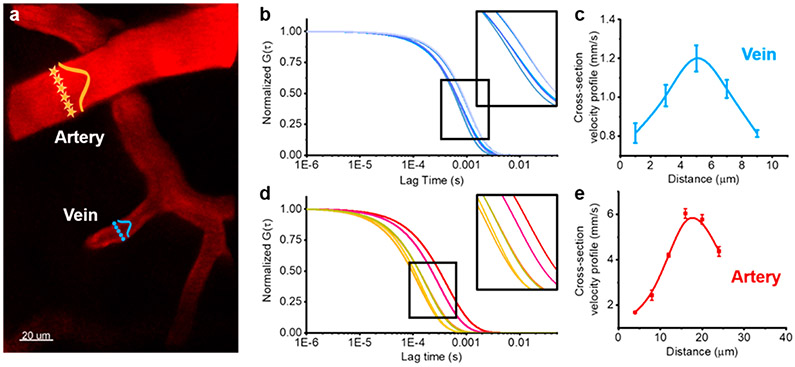
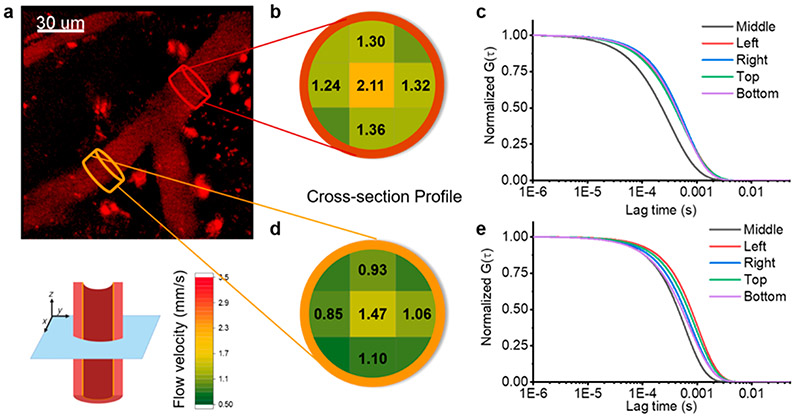
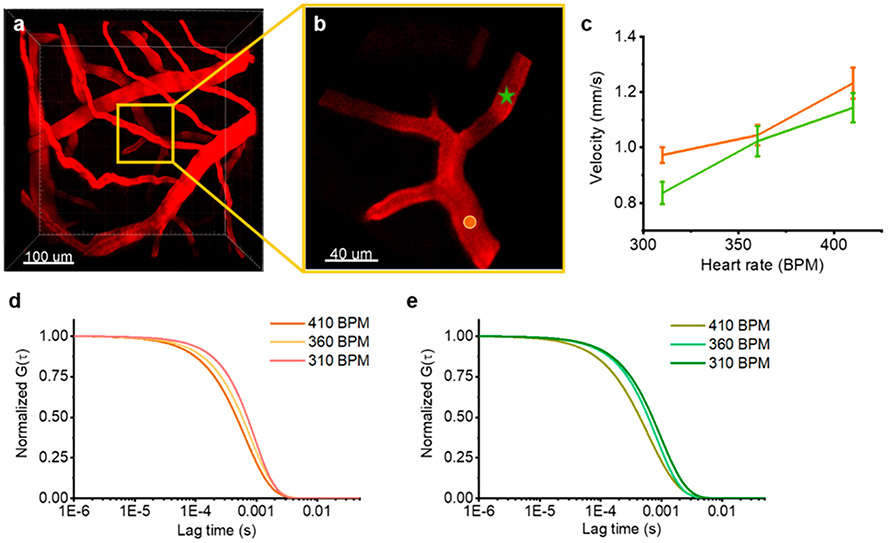
We present the application of multiphoton in vivo fluorescence correlation spectroscopy (FCS) of fluorescent nanoparticles for the measurement of cerebral blood flow with excellent spatial and temporal resolution. Through the detection of single nanoparticles within the complex vessel architecture of a live mouse, this new approach enables the quantification of nanoparticle dynamics occurring within the vasculature along with simultaneous measurements of blood flow properties in the brain. In addition to providing high resolution blood flow measurements, this approach enables real-time quantification of nanoparticle concentration, degradation, and transport. This method is capable of quantifying flow rates at each pixel with submicron resolution to enable monitoring of dynamic changes in flow rates in response to changes in the animal's physiological condition. Scanning the excitation beam using FCS provides pixel by pixel mapping of flow rates with subvessel resolution across capillaries 300 μm deep in the brains of mice.

Keywords: Multiphoton in vivo imaging; cerebral blood flow (CBF); fluorescence correlation spectroscopy (FCS); nanoparticles.


Figures

Figure 1.
Figure 1.
Two-photon fluorescence correlation spectroscopy (FCS) calibration. (a) Schematic drawing of the multiphoton in vivo FCS setup through a glass slide covered flow chamber. (b) Schematic and dimensions of the microfluidic device. (c) Fluorescence intensity time trace recorded from freely diffusing CF488-Dextran 250 kDa. (d) The corresponding autocorrelation function (ACF) (G(τ)) reveals the diffusion properties of CF488-Dextran 250 kDa. (e) Normalized ACFs resulting from different rates of flow in the microfluidic device which was used to calibrate the optical setup. We tested a series of flow rates (0.4, 0.6, 0.8, and 1.0 mL/min) with CF488-Dextran 250 kDa to extract the residence times. (f) Flow velocities with measured flow residence times show a linear relationship, which yields a calculated focal lateral diameter of 0.98 μm for the optical setup.
Figure 2.
Figure 2.
Nanoparticle concentration and flow rates in the brain. (a) Representative image of fluorescent nanoparticle leakage out of the vasculature after 1 h. (b) Merged fluorescence intensity time traces recorded in the same vessel showing an initial time trace directly after injection (red) and 1 h later (blue). (c) The corresponding ACFs (G(τ)) show the different concentrations of fluorescent nanoparticles at two time points (color matched to part b). (d) 2P image of fluorescently labeled cerebral vasculature from a thinned-skull preparation. (e) Diameter and blood flow velocity measurements of the vascular network traced from part d. We observed the expected scaling of the flow rate with the diameter of the vessel. (f) Two representative fluorescence intensity time traces recorded from a large vessel (21.7 mm diameter, orange) and a capillary (5.2 mm diameter, pink) from part d. (g) The corresponding ACFs (G(τ)) show the different flow velocities in different vessels (color matched to part e).
Figure 3.
Figure 3.
2P-FCS measurements of subvessel resolution blood flow velocities. (a) 2P-FCS enables measurements of subvessel resolution blood flow velocity. A cross-section profile of the flow velocity of an artery or vein is generated by sequentially measuring across the vessel with the FCS detection pixels indicated with orange stars (artery) or blue circles (vein). (b) Corresponding ACFs (G(τ)) at five points across the vein. Similarly, part d shows corresponding ACFs (G(τ)) at six points across the artery. Parts c and e show blood velocity profiles across the width of blood vessels. Velocities were determined at five points across the width of a vein (c, blue) and six points across an artery (e, red). Error bars are standard errors of mean (SEM) calculated from six measurements at the same position.
Figure 4.
Figure 4.
2D cross-sections of flow velocity profiles. (a) Representative 2P image of a blood vessel with a branch. (b and d) Results of two-dimensional cross-section blood flow velocity profiles. Brown and orange plots corresponding to 2D blood flow velocity profiles before and after the branch. The heat map corresponds to the flow velocity (see key: green to red, 0.5 to 3.5 mm/s). (c and e) Corresponding ACFs (G(τ)) show the different flow velocities in the cross-section of the vessel.
Figure 5.
Figure 5.
Dynamic changes of blood flow velocity. (a) Representative 3D reconstruction of the vascular network. (b) The zoomed-in version of the yellow box from the full field of view 3D image. The boxed area is the vessel that can be seen 30 μm below the bright vessel in the 3D image. (c) Representative blood flow dynamics due to changes in heart rate at two locations indicated in part b. Parts d and e show representative ACFs for different heart rates. The orange and green figures correspond to the two locations indicated in part b.

References

    1. Jacob M; Chappell D; Becker BF Regulation of blood flow and volume exchange across the microcirculation. Critical Care 2016, 20 (1), 319. - PMC - PubMed
    1. Kisler K; Nelson AR; Montagne A; Zlokovic BV Cerebral blood flow regulation and neurovascular dysfunction in Alzheimer disease. Nat. Rev. Neurosci 2017, 18 (7), 419–434. - PMC - PubMed
    1. Iturria-Medina Y; Sotero RC; Toussaint PJ; Mateos-Perez JM; Evans AC Early role of vascular dysregulation on late-onset Alzheimer’s disease based on multifactorial data-driven analysis. Nat. Commun 2016, 7, 11934. - PMC - PubMed
    1. Kisler K; Lazic D; Sweeney MD; Plunkett S; El Khatib M; Vinogradov SA; Boas DA; Sakadži S; Zlokovic BV In vivo imaging and analysis of cerebrovascular hemodynamic responses and tissue oxygenation in the mouse brain. Nat. Protoc 2018, 13 (6), 1377–1402. - PMC - PubMed
    1. Rungta RL; Osmanski B-F; Boido D; Tanter M; Charpak S Light controls cerebral blood flow in naive animals. Nat. Commun 2017, 8 (1), 14191. - PMC - PubMed