

Systemic iron overload exacerbates osteoarthritis in the strain 13 guinea pig
- PMID: 32629162
- PMCID: PMC7484276
- DOI: 10.1016/j.joca.2020.06.005
Systemic iron overload exacerbates osteoarthritis in the strain 13 guinea pig
Abstract
Objective: Iron is emerging as a key player in aging-associated diseases due to its propensity for driving free radical formation. Studies examining the role of iron in the pathogenesis of primary osteoarthritis (OA) are limited. Our objective was to establish a direct relationship between excess iron and OA by administering iron dextran to a guinea pig strain with decreased propensity for developing this disease.
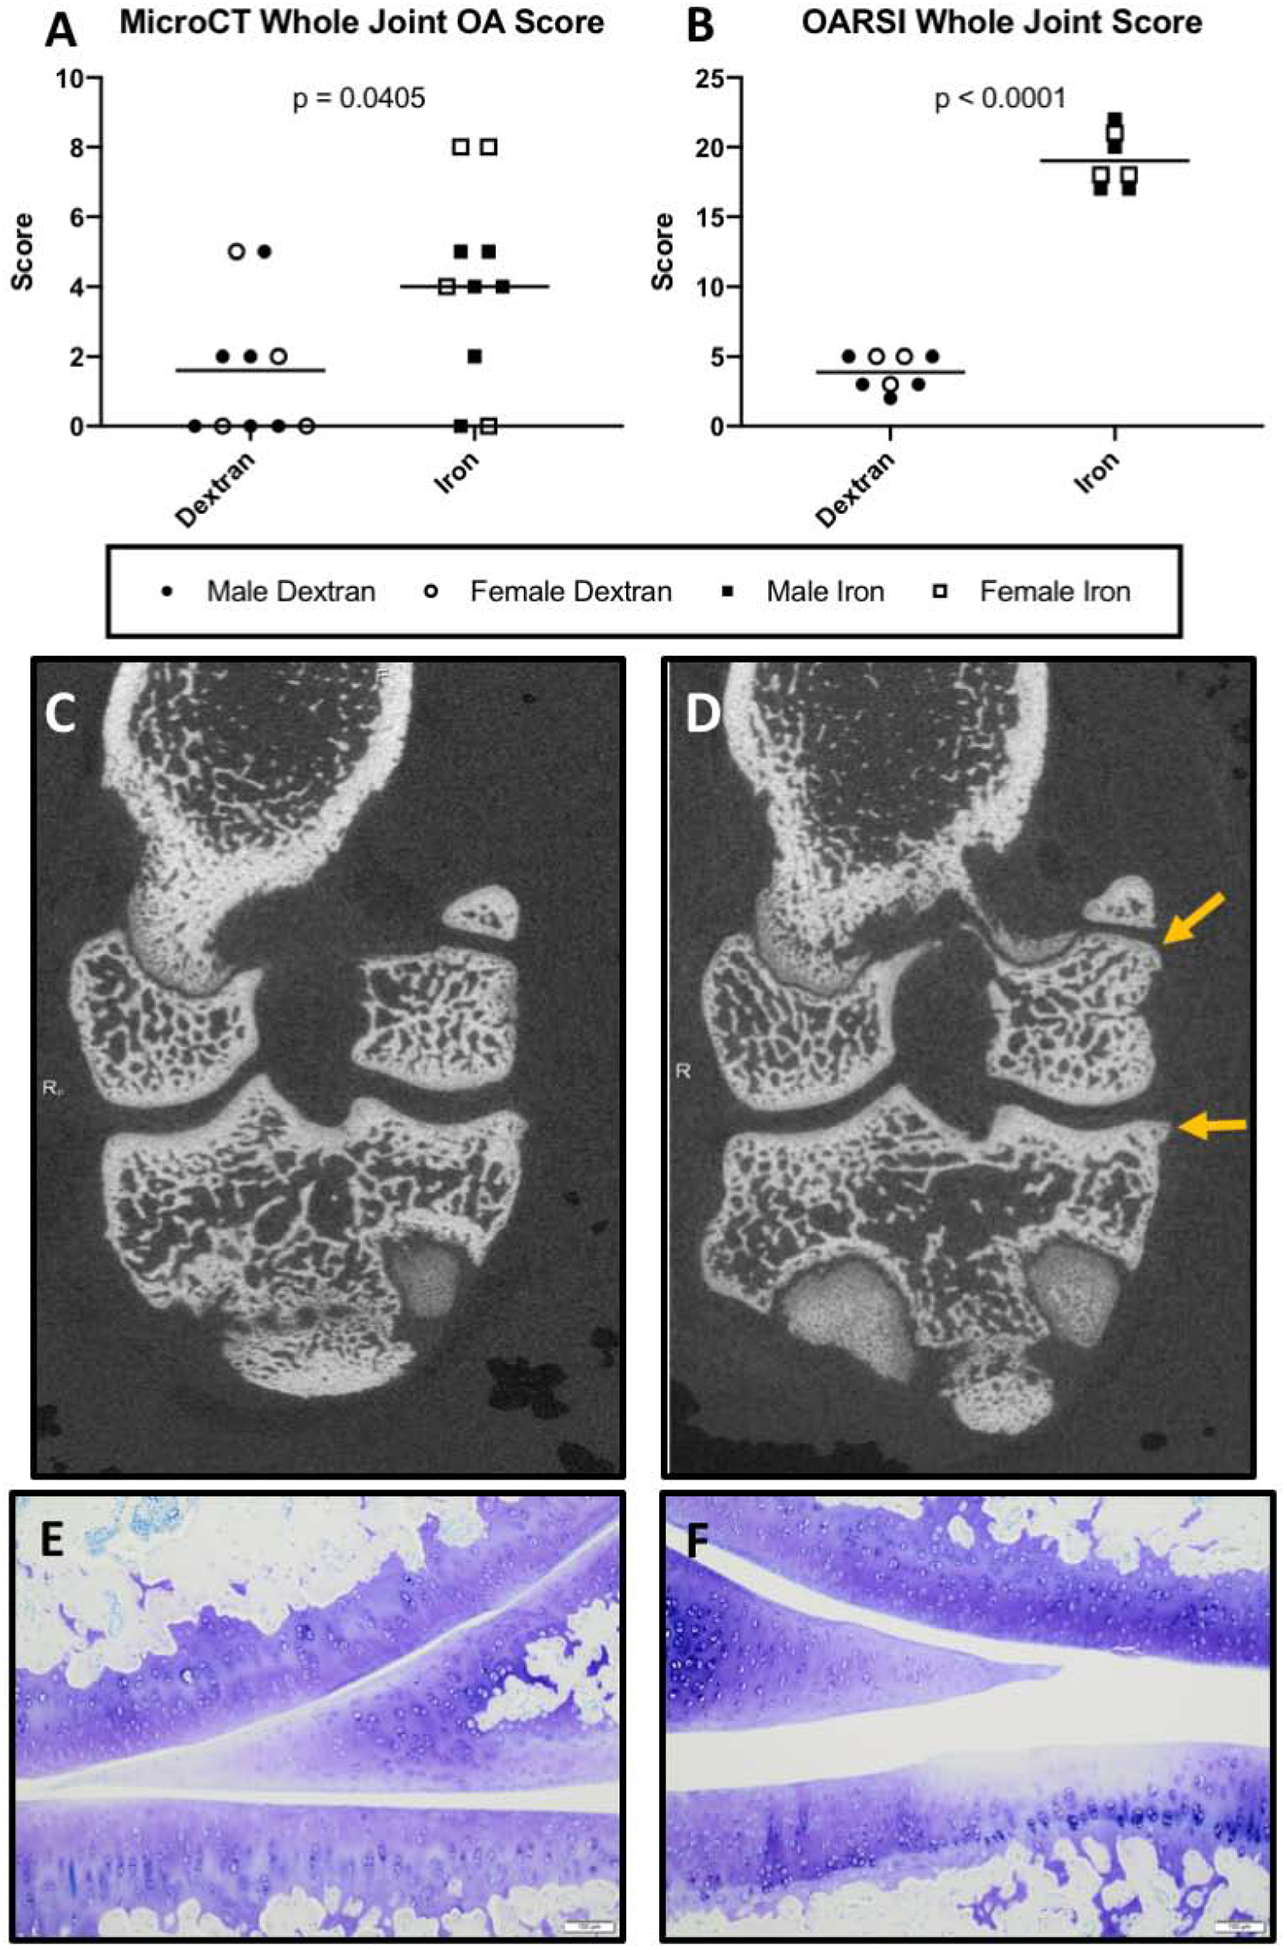
Design: Twenty, 12-week-old Strain 13 guinea pigs received either iron dextran or dextran control intraperitoneally once weekly for 4 weeks; termination occurred at 16 weeks of age. Iron levels were determined systemically (serum and liver) and within diarthrodial joints [femoral head articular cartilage and infrapatellar fat pads (IFPs) of knee joints]. One knee was collected to score structural changes associated with OA via microcomputed tomography (microCT) and histology using published grading schemes. Articular cartilage and IFPs were harvested from contralateral knees for gene expression analyses.
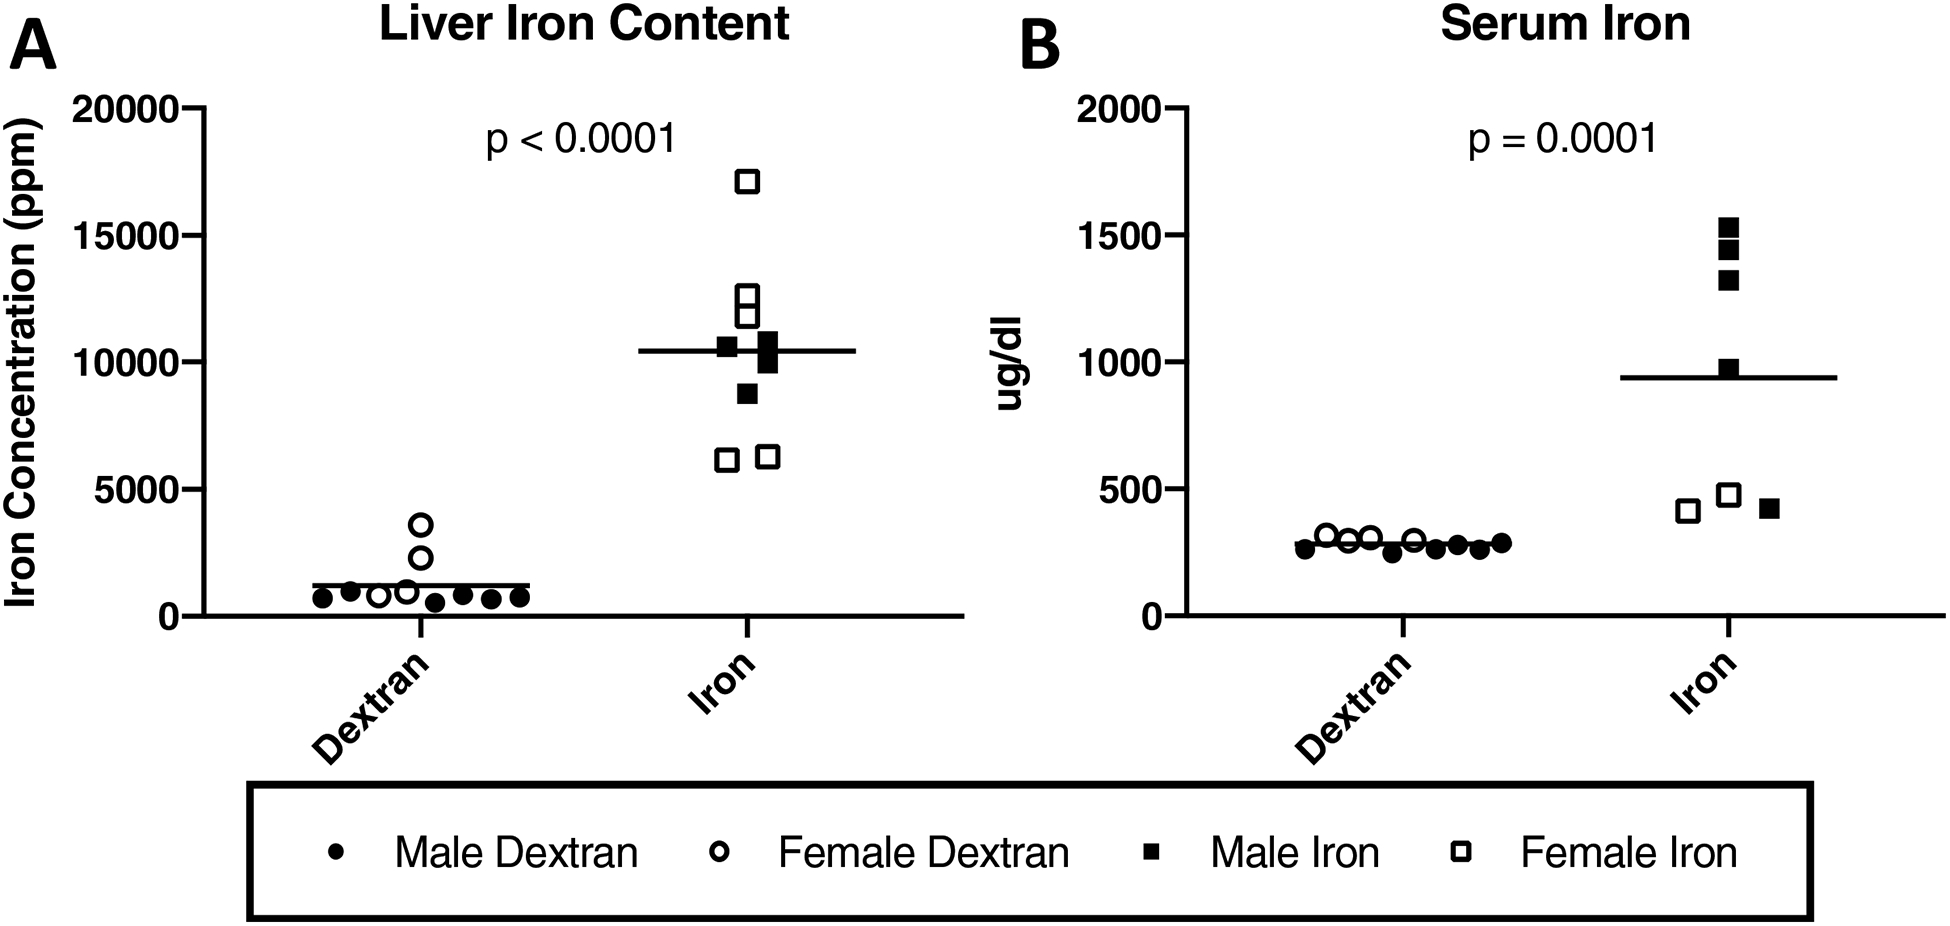
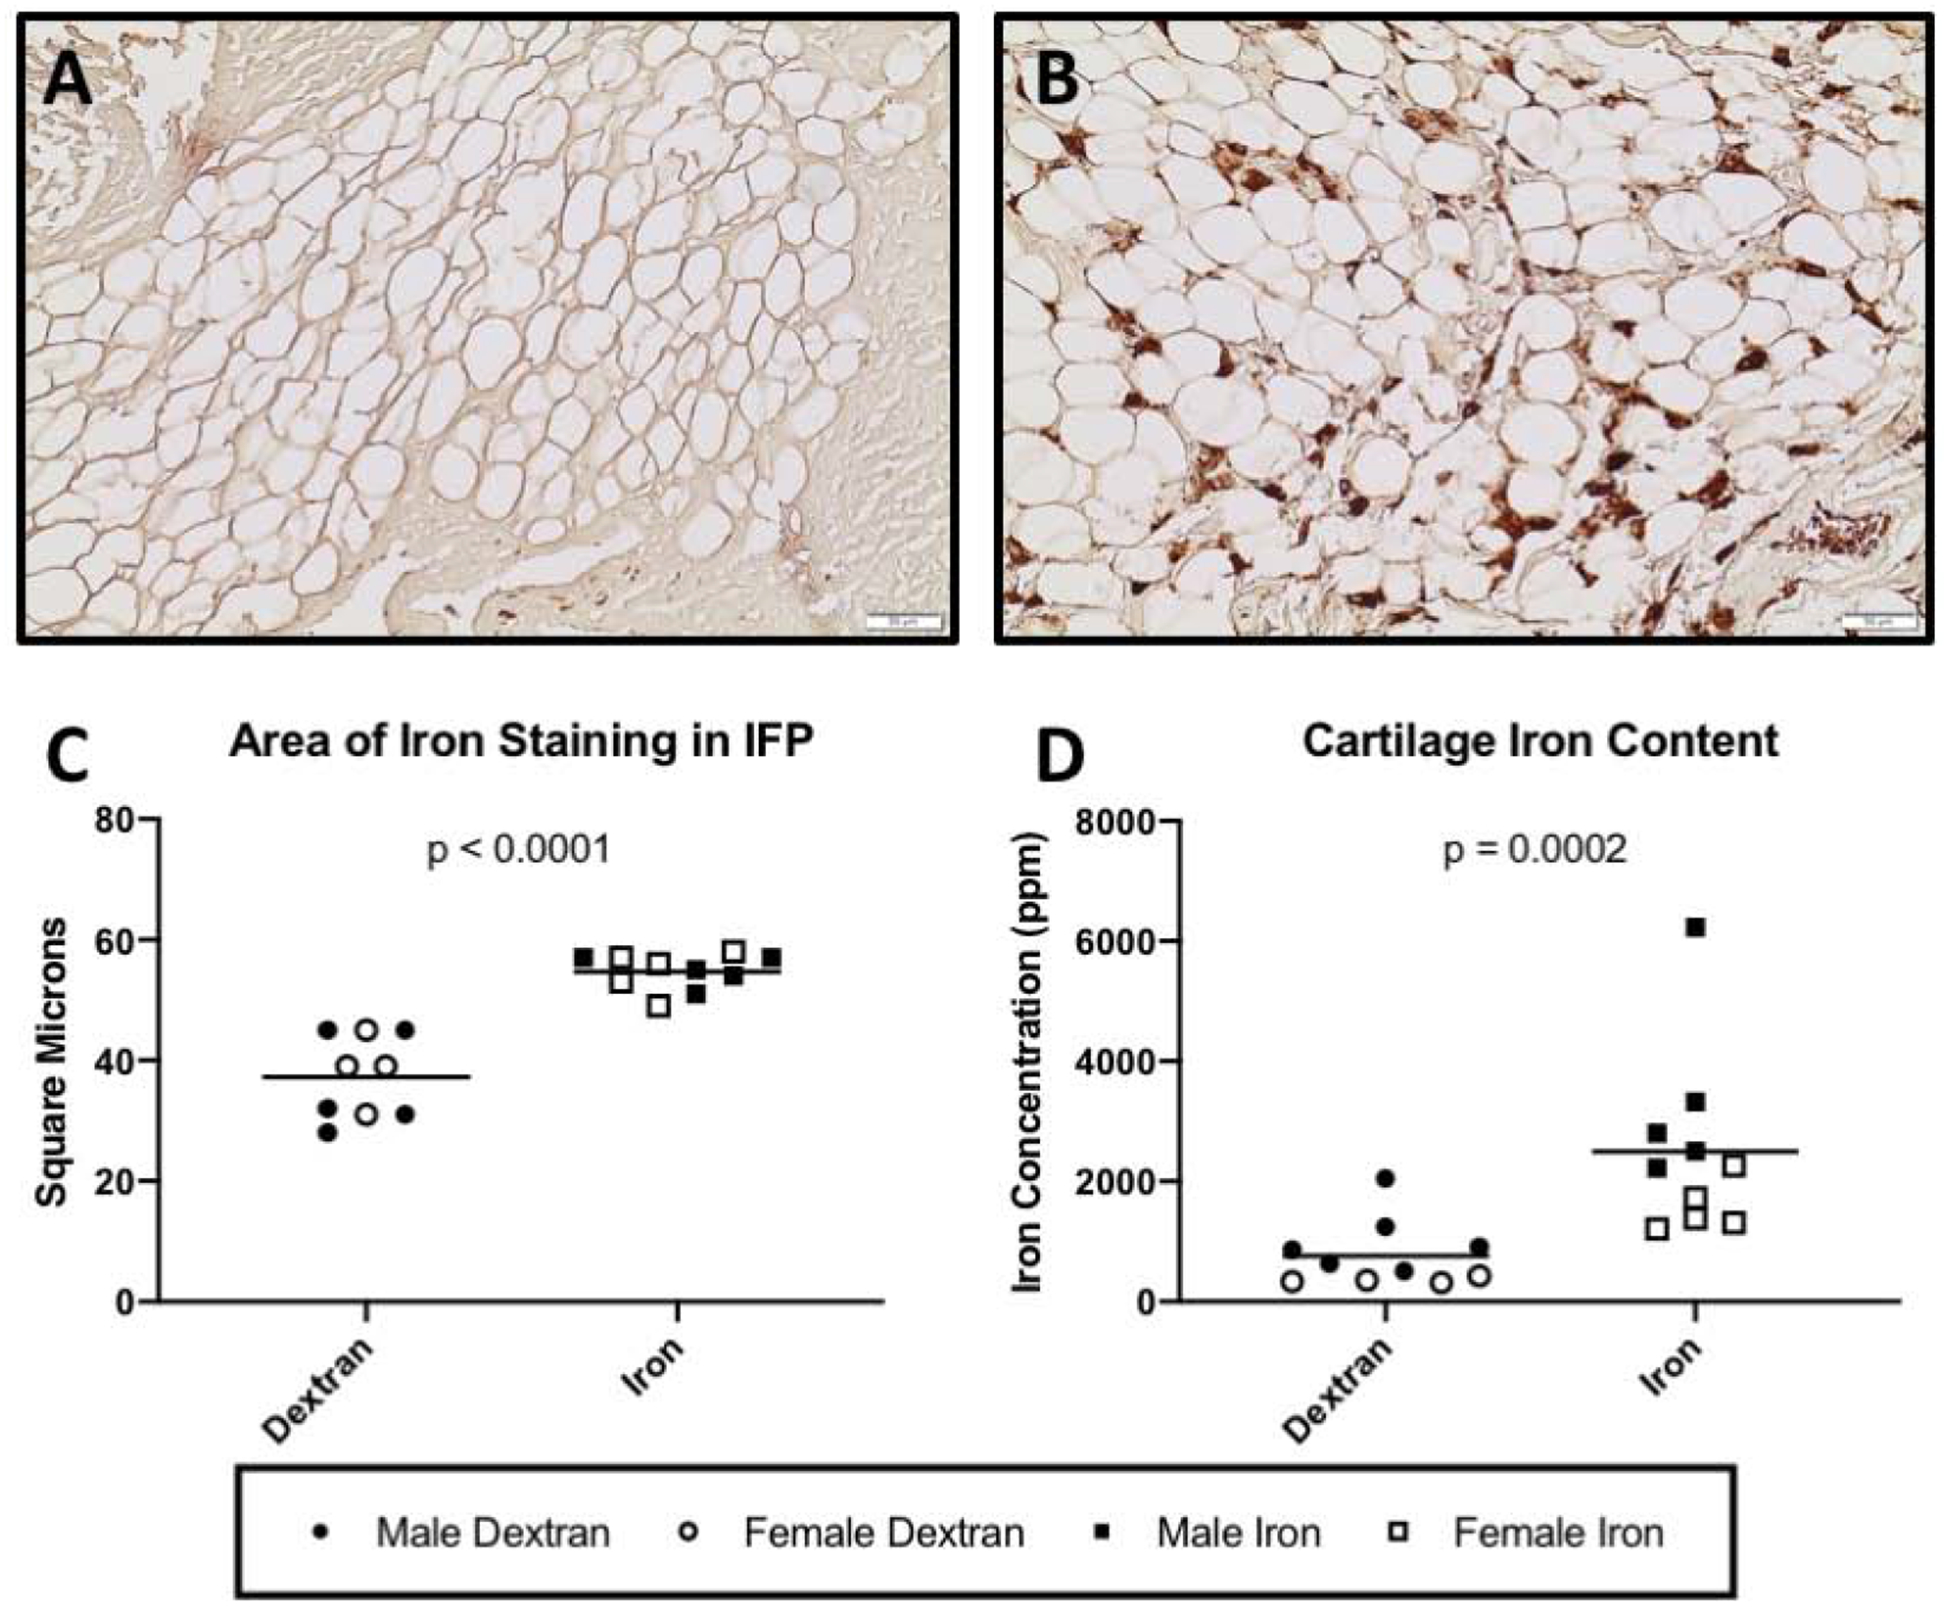
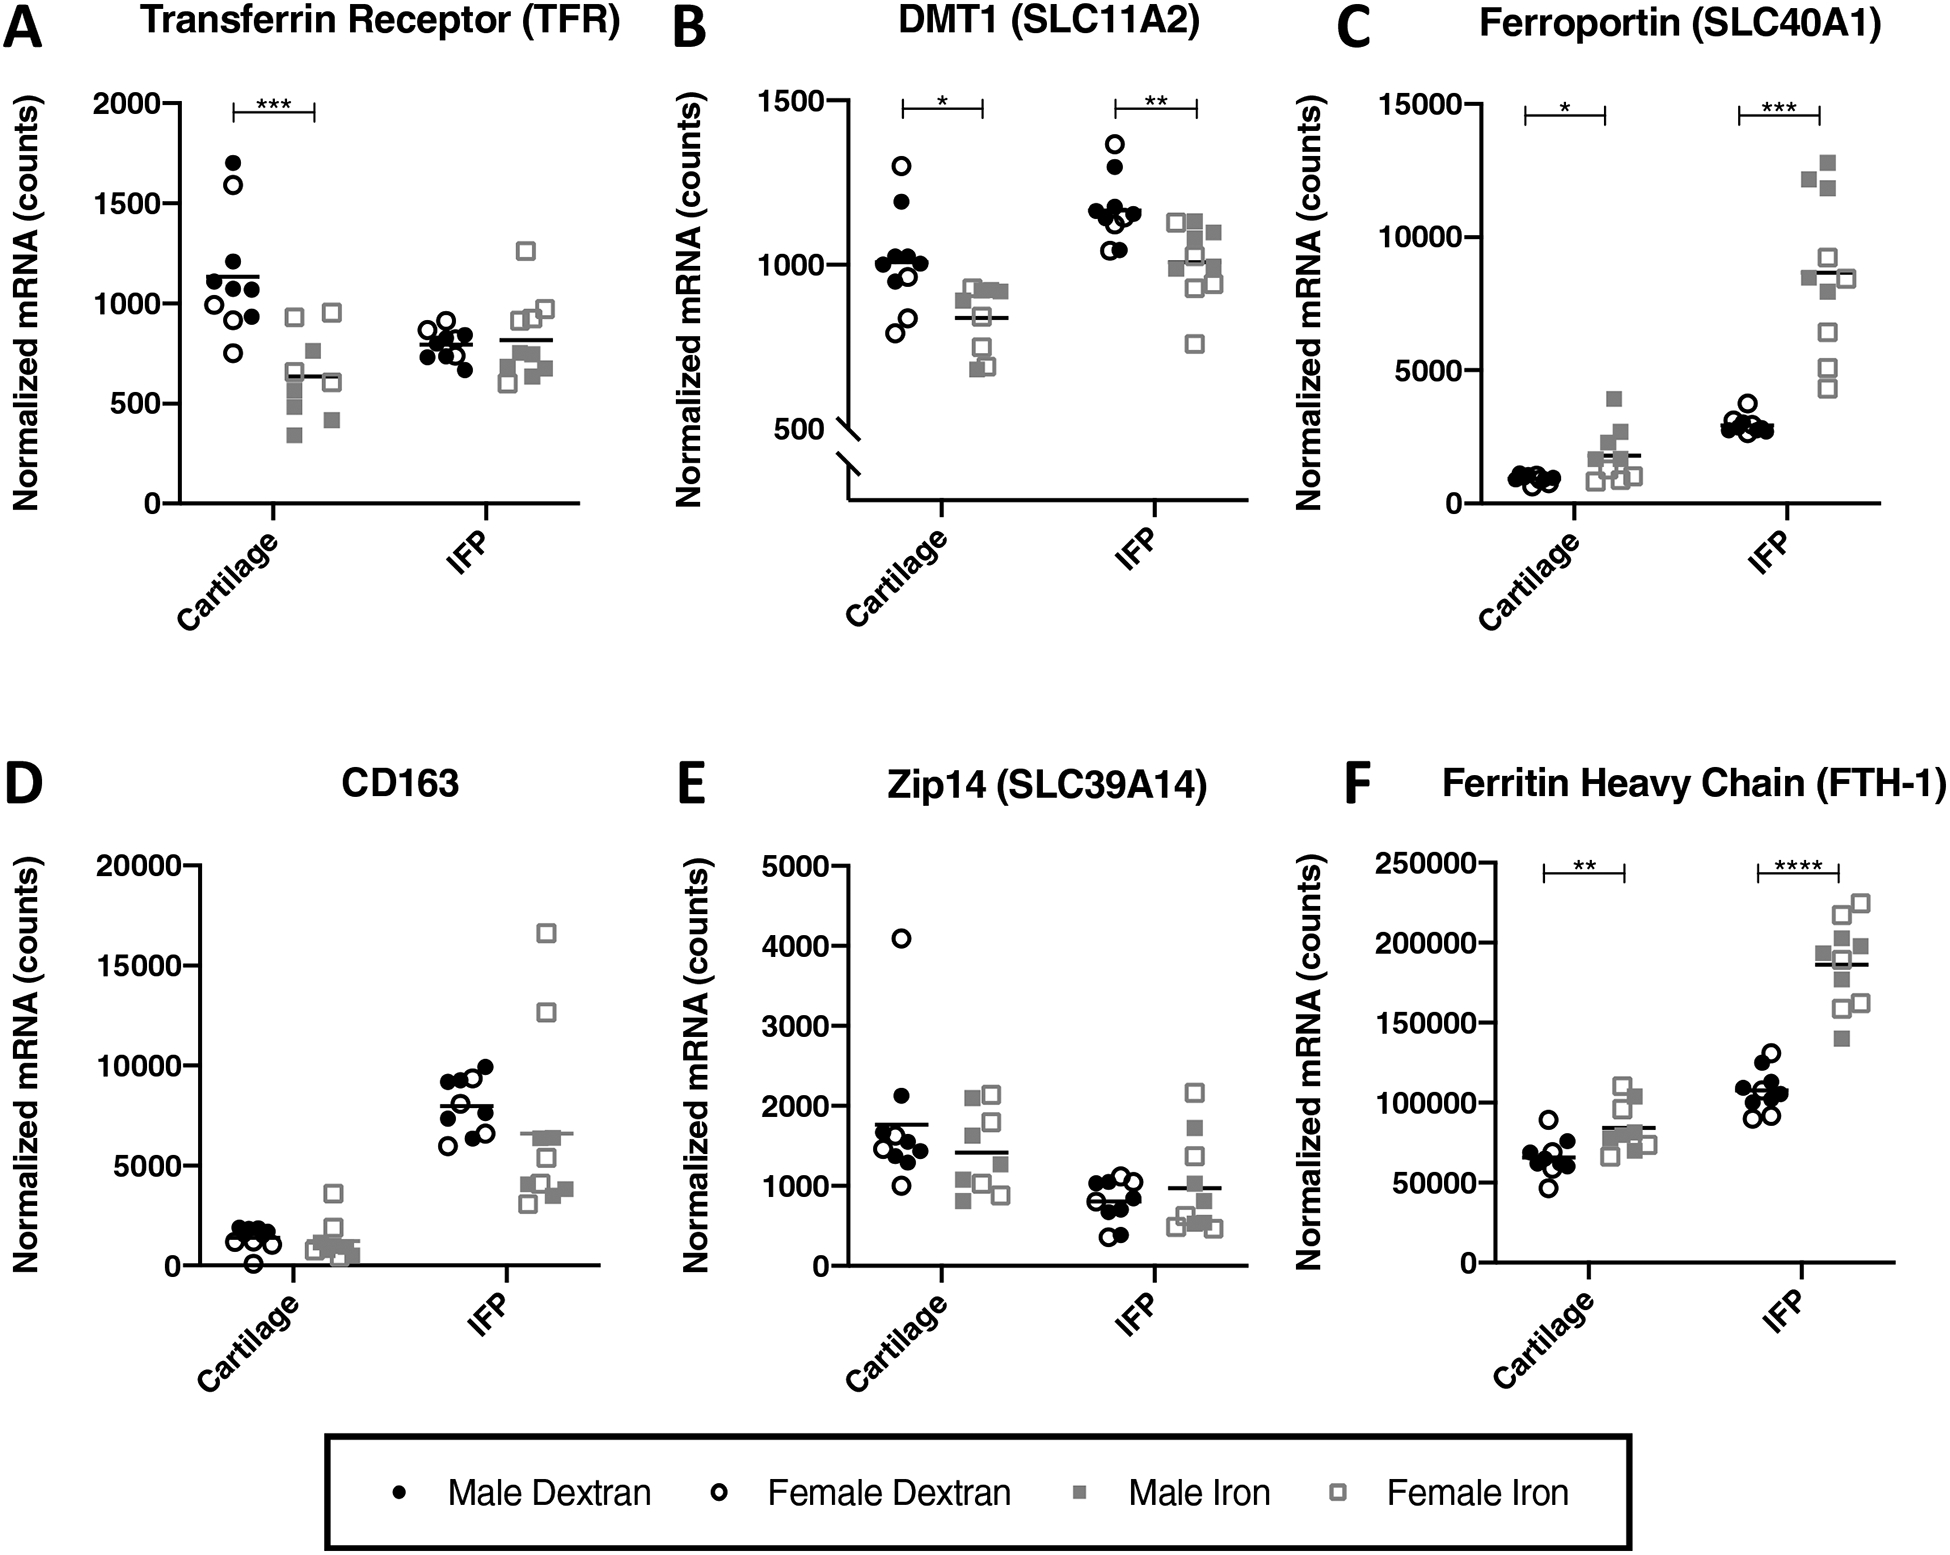
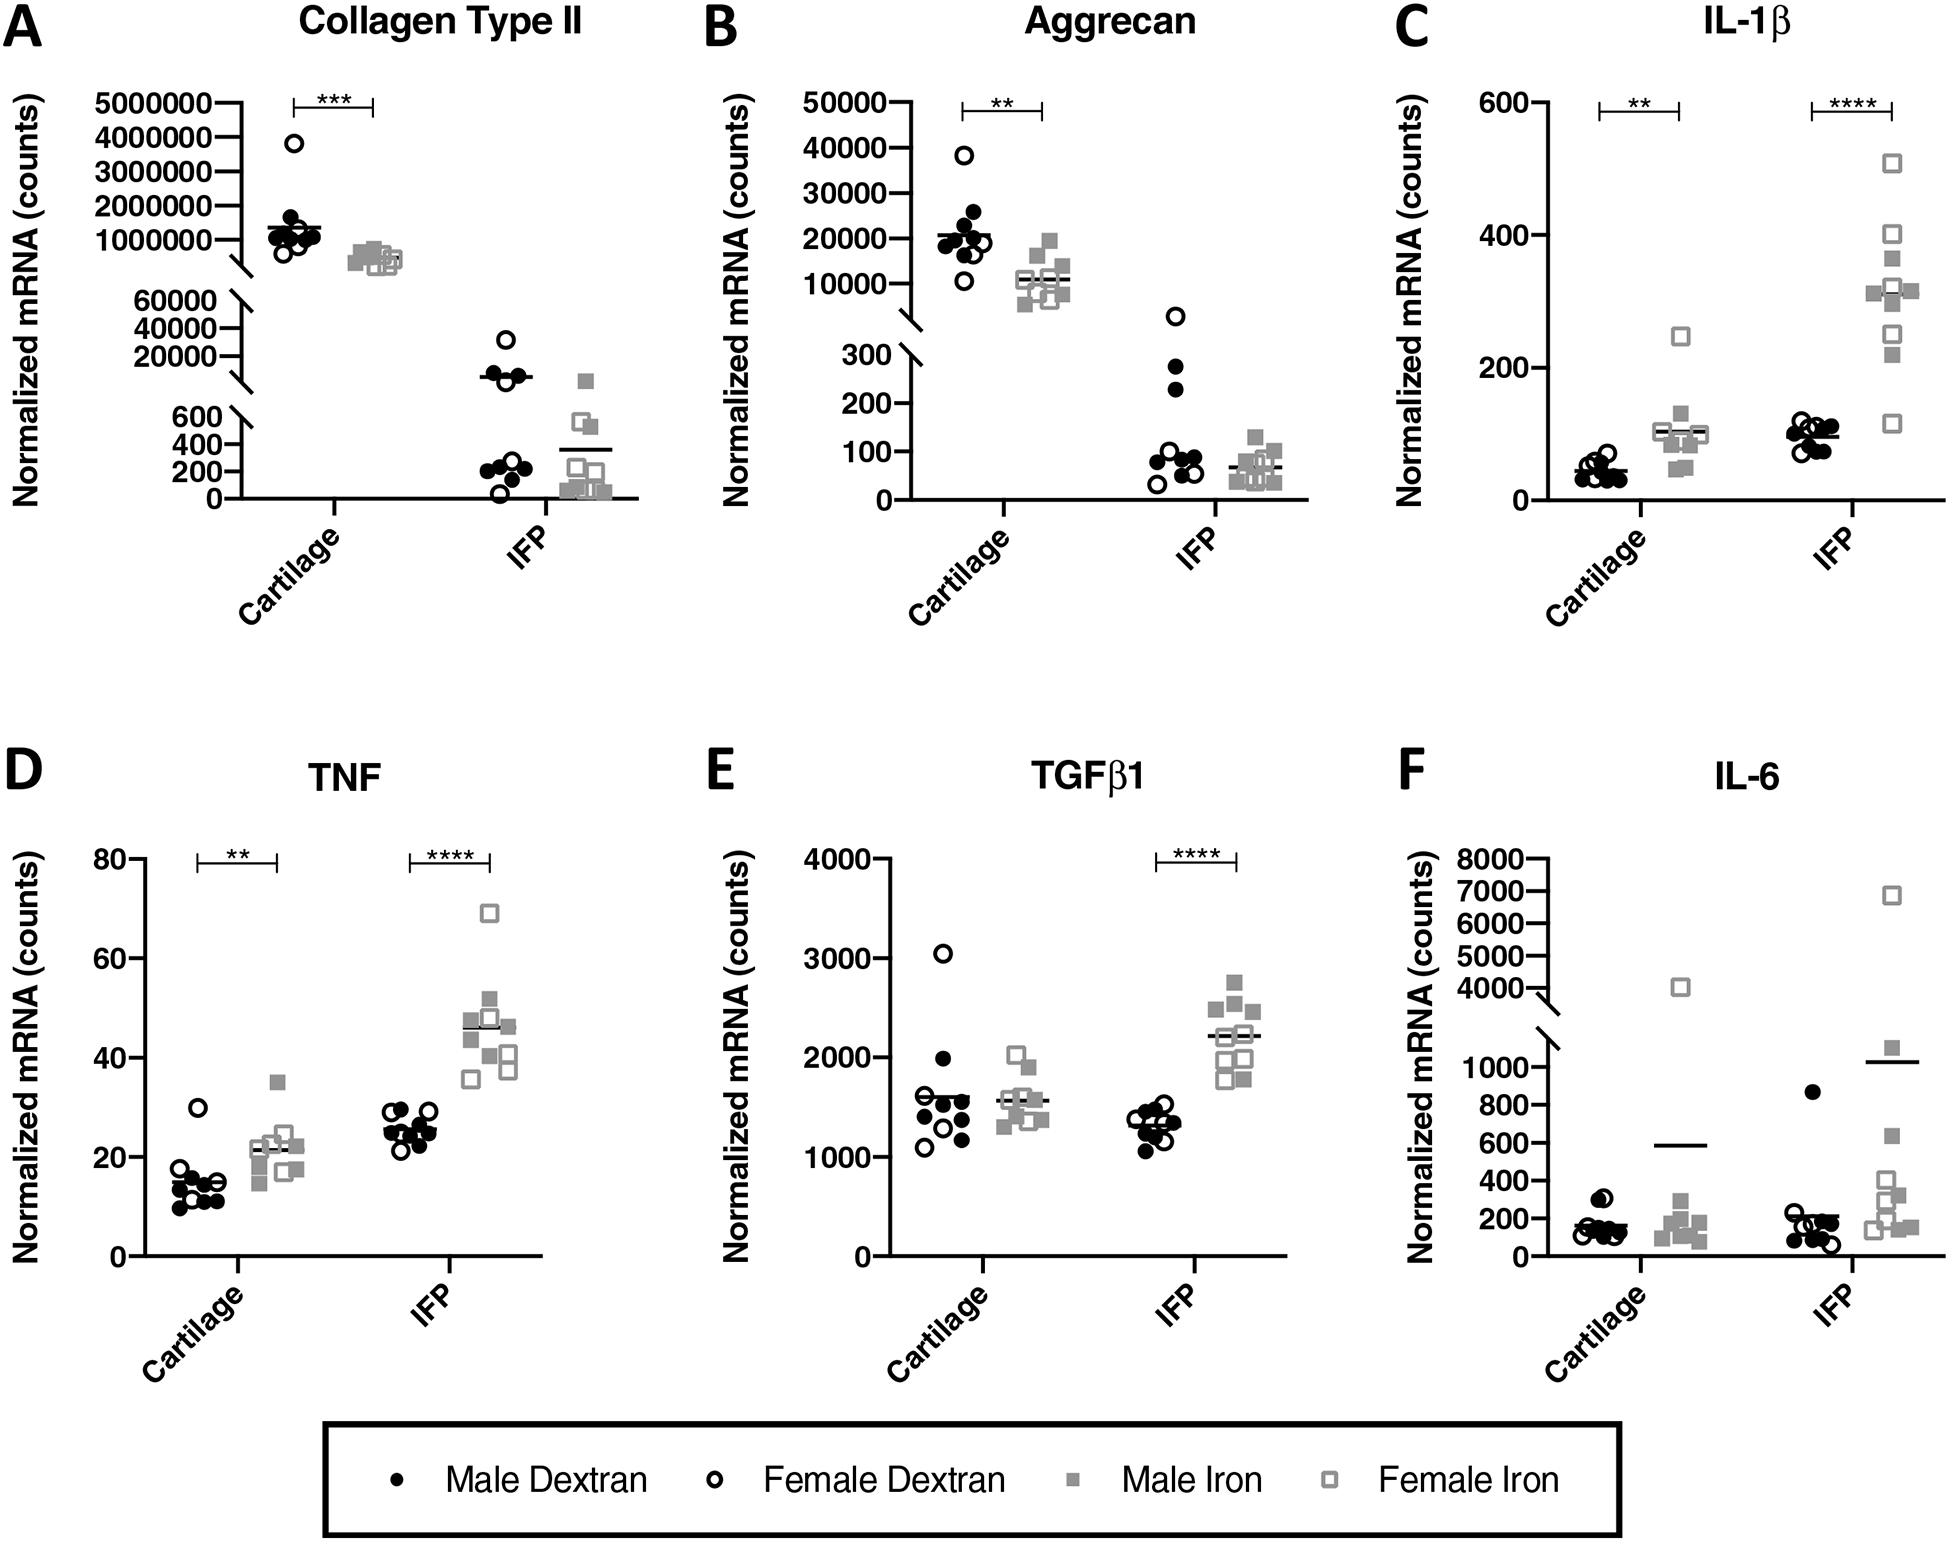
Results: Iron overload was confirmed systemically via increased serum iron and liver iron concentration. Articular cartilage and IFPs in the iron dextran group also had higher levels of iron. Excess iron worsened knee OA using both microCT and histologic scoring systems. Gene analyses revealed that exogenous iron altered the expression of iron trafficking proteins, select cytokines, and structural components of cartilage.
Conclusion: These results demonstrate that systemic iron overload caused cellular iron accumulation in the knee joint. This excess iron is associated with increased expression of local inflammatory mediators and early onset and progression of knee joint OA in Strain 13 animals.
Keywords: Aging; Guinea pig; Iron; Strain 13.
Copyright © 2020 Osteoarthritis Research Society International. Published by Elsevier Ltd. All rights reserved.
Conflict of interest statement
Competing Interests.
No authors have any conflicts of interest to disclose for this work.
Figures
Similar articles
-
Human Infrapatellar Fat Pad Mesenchymal Stem Cell-derived Extracellular Vesicles Purified by Anion Exchange Chromatography Suppress Osteoarthritis Progression in a Mouse Model.Clin Orthop Relat Res. 2024 Jul 1;482(7):1246-1262. doi: 10.1097/CORR.0000000000003067. Epub 2024 Apr 19. Clin Orthop Relat Res. 2024. PMID: 38662932 Free PMC article.
-
Calorie restriction with regular chow, but not a high-fat diet, delays onset of spontaneous osteoarthritis in the Hartley guinea pig model.Arthritis Res Ther. 2019 Jun 13;21(1):145. doi: 10.1186/s13075-019-1925-8. Arthritis Res Ther. 2019. PMID: 31196172 Free PMC article.
-
Development of a microcomputed tomography scoring system to characterize disease progression in the Hartley guinea pig model of spontaneous osteoarthritis.Connect Tissue Res. 2018 Nov;59(6):523-533. doi: 10.1080/03008207.2017.1409218. Epub 2017 Dec 11. Connect Tissue Res. 2018. PMID: 29226725 Free PMC article.
-
Celecoxib for osteoarthritis.Cochrane Database Syst Rev. 2017 May 22;5(5):CD009865. doi: 10.1002/14651858.CD009865.pub2. Cochrane Database Syst Rev. 2017. PMID: 28530031 Free PMC article.
-
Mobile bearing vs fixed bearing prostheses for posterior cruciate retaining total knee arthroplasty for postoperative functional status in patients with osteoarthritis and rheumatoid arthritis.Cochrane Database Syst Rev. 2015 Feb 4;2015(2):CD003130. doi: 10.1002/14651858.CD003130.pub3. Cochrane Database Syst Rev. 2015. PMID: 25650566 Free PMC article.
Cited by
-
Quercetin Modulates Ferroptosis via the SIRT1/Nrf-2/HO-1 Pathway and Attenuates Cartilage Destruction in an Osteoarthritis Rat Model.Int J Mol Sci. 2024 Jul 7;25(13):7461. doi: 10.3390/ijms25137461. Int J Mol Sci. 2024. PMID: 39000568 Free PMC article.
-
Effect of Parental Age, Parity, and Pairing Approach on Reproduction in Strain 13/N Guinea Pigs (Cavia porcellus).Animals (Basel). 2023 Mar 1;13(5):895. doi: 10.3390/ani13050895. Animals (Basel). 2023. PMID: 36899751 Free PMC article.
-
Dysregulation of Iron Homeostasis Mediated by FTH Increases Ferroptosis Sensitivity in TP53-Mutant Glioblastoma.Neurosci Bull. 2025 Apr;41(4):569-582. doi: 10.1007/s12264-024-01322-y. Epub 2024 Dec 12. Neurosci Bull. 2025. PMID: 39666195
-
Ferroptosis is involved in PGPS-induced otitis media in C57BL/6 mice.Cell Death Discov. 2022 Apr 21;8(1):217. doi: 10.1038/s41420-022-01025-1. Cell Death Discov. 2022. PMID: 35449198 Free PMC article.
-
Arctiin alleviates knee osteoarthritis by suppressing chondrocyte oxidative stress induced by accumulated iron via AKT/NRF2/HO-1 signaling pathway.Sci Rep. 2024 Dec 30;14(1):31935. doi: 10.1038/s41598-024-83383-7. Sci Rep. 2024. PMID: 39738432 Free PMC article.
References
-
- Walling C Fenton’s reagent revisited. Acc Chem Res. 1975;8(4):125–31. doi:10.1021/ar50088a003. - DOI
Publication types
MeSH terms
Substances
Grants and funding
LinkOut - more resources
Full Text Sources
Medical
