

Air pollution in Ontario, Canada during the COVID-19 State of Emergency
- PMID: 32629257
- PMCID: PMC7321656
- DOI: 10.1016/j.scitotenv.2020.140516
Air pollution in Ontario, Canada during the COVID-19 State of Emergency
Abstract
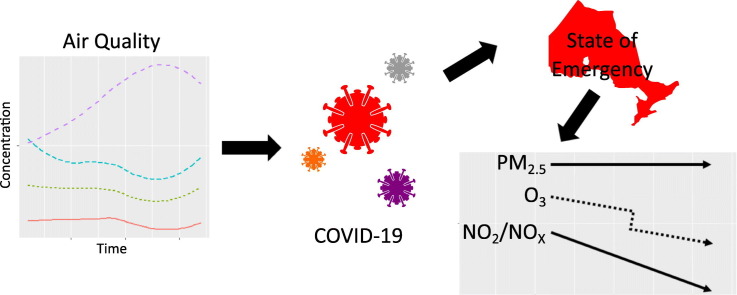
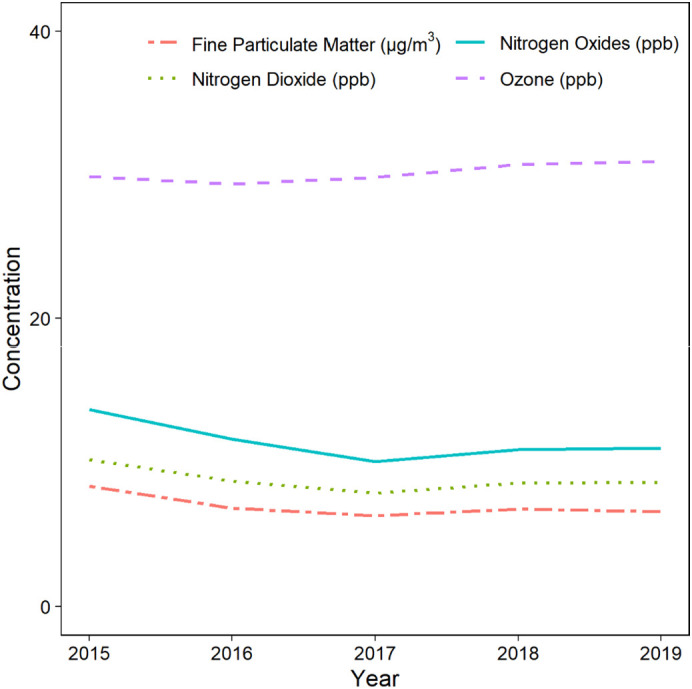
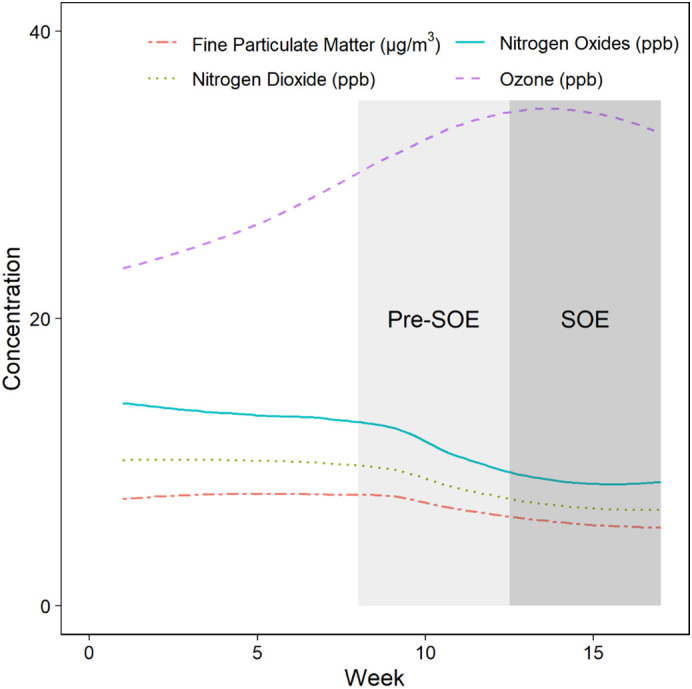
In March of 2020, the province of Ontario declared a State of Emergency (SOE) to reduce the spread of severe acute respiratory syndrome coronavirus 2 (SARS-CoV-2), which causes the coronavirus disease (COVID-19). This disruption to the economy provided an opportunity to measure change in air pollution when the population spends more time at home with fewer trips. Hourly air pollution observations were obtained for fine particulate matter, nitrogen dioxide, nitrogen oxides and ozone from the Ontario air monitoring network for 2020 and the previous five years. The analysis is focused on a five-week period during the SOE with a previous five-week period used as a control. Fine particulate matter did not show any significant reductions during the SOE. Ozone concentrations at 12 of the 32 monitors were lower than any of the previous five-years; however, four locations were above average. Average ozone concentrations were 1 ppb lower during the SOE, but this ranged at individual monitors from 1.5 ppb above to 4.2 ppb below long-term conditions. Nitrogen dioxide and nitrogen oxides demonstrated a reduction across Ontario, and both pollutants displayed their lowest concentrations for 22 of 29 monitors. Individual monitors ranged from 1 ppb (nitrogen dioxide) and 5 ppb (nitrogen oxides) above average to 4.5 (nitrogen dioxide) and 7.1 ppb (nitrogen oxides) below average. Overall, both nitrogen dioxide and nitrogen oxides demonstrated a reduction across Ontario in response to the COVID-19 SOE, ozone concentrations suggested a possible reduction, and fine particulate matter has not varied from historic concentrations.
Keywords: Ambient air pollution; COVID-19; Fine particulate matter; Nitrogen dioxide; Nitrogen oxides; Ozone.
Copyright © 2020 Elsevier B.V. All rights reserved.
Conflict of interest statement
Declaration of competing interest The authors declare that they have no known competing financial interests or personal relationships that could have appeared to influence the work reported in this paper.
Figures
References
-
- Dabek-zlotorzynska E., Celo V., Ding L., Herod D., Jeong C., Evans G., Hilker N. Characteristics and sources of PM 2.5 and reactive gases near roadways in two metropolitan areas in Canada. Atmos. Environ. 2019;218 doi: 10.1016/j.atmosenv.2019.116980. - DOI
-
- Google Canada April 17, 2020 mobility changes [WWW document] 2020. https://www.gstatic.com/covid19/mobility/2020-04-17_CA_Mobility_Report_e... URL.
MeSH terms
Substances
LinkOut - more resources
Full Text Sources
Medical
Miscellaneous
