. 2020 Jul:57:102854.
doi: 10.1016/j.ebiom.2020.102854. Epub 2020 Jul 3.

Facets of individual-specific health signatures determined from longitudinal plasma proteome profiling

Affiliations

Facets of individual-specific health signatures determined from longitudinal plasma proteome profiling

Tea Dodig-Crnković et al. EBioMedicine. 2020 Jul.

Abstract

Background: Precision medicine approaches aim to tackle diseases on an individual level through molecular profiling. Despite the growing knowledge about diseases and the reported diversity of molecular phenotypes, the descriptions of human health on an individual level have been far less elaborate.

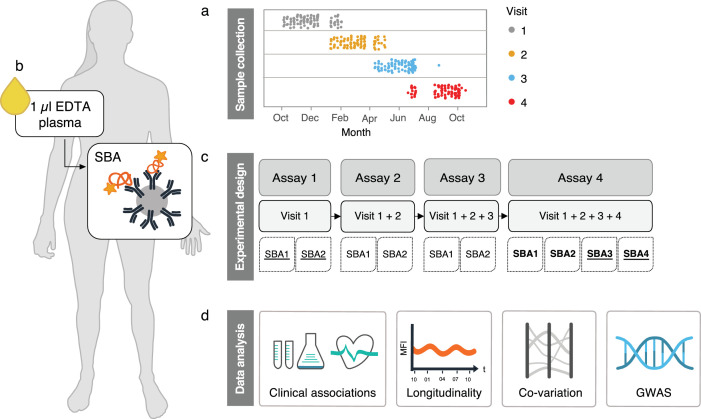
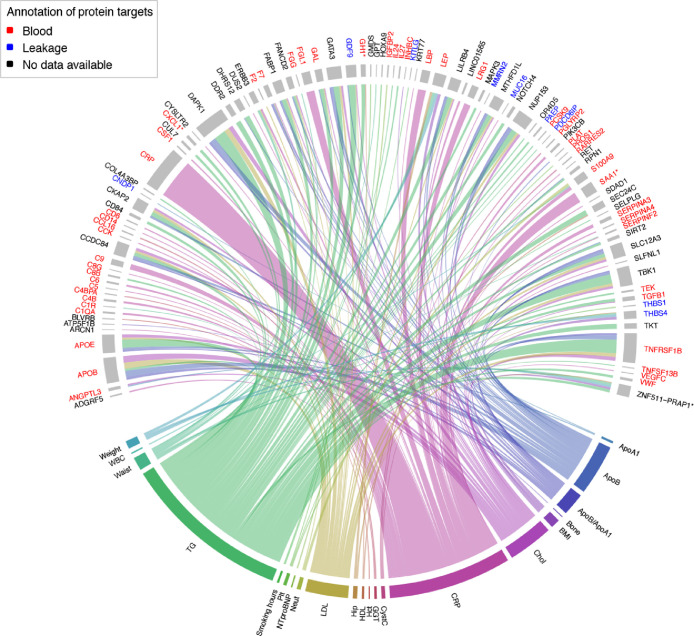
Methods: To provide insights into the longitudinal protein signatures of well-being, we profiled blood plasma collected over one year from 101 clinically healthy individuals using multiplexed antibody assays. After applying an antibody validation scheme, we utilized > 700 protein profiles for in-depth analyses of the individuals' short-term health trajectories.

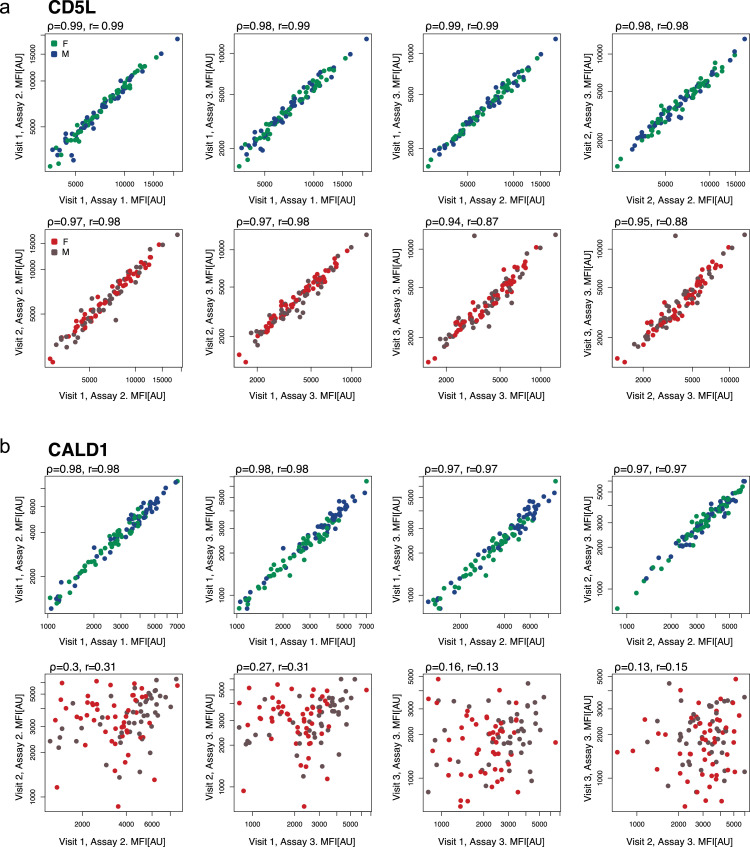
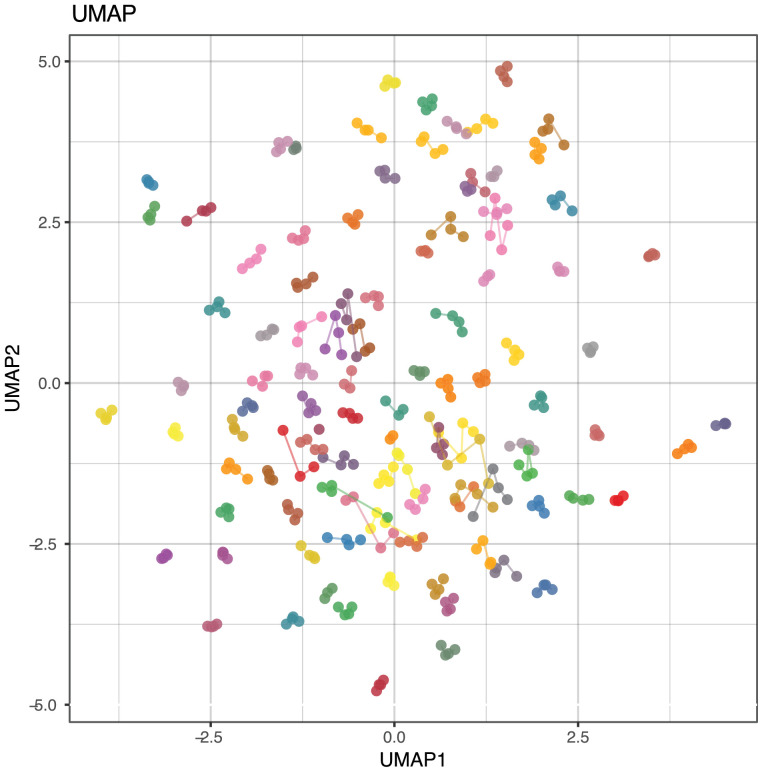
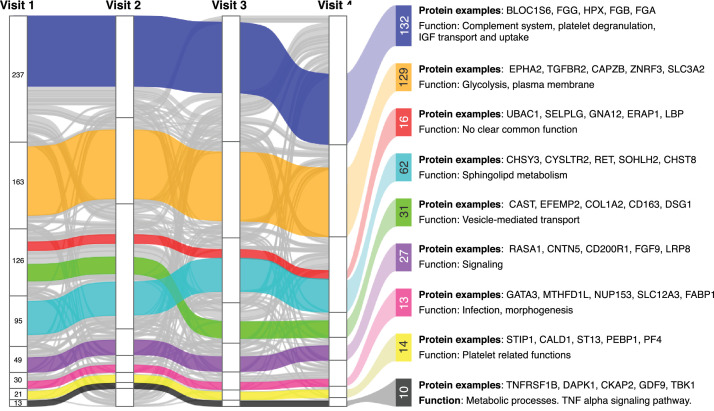
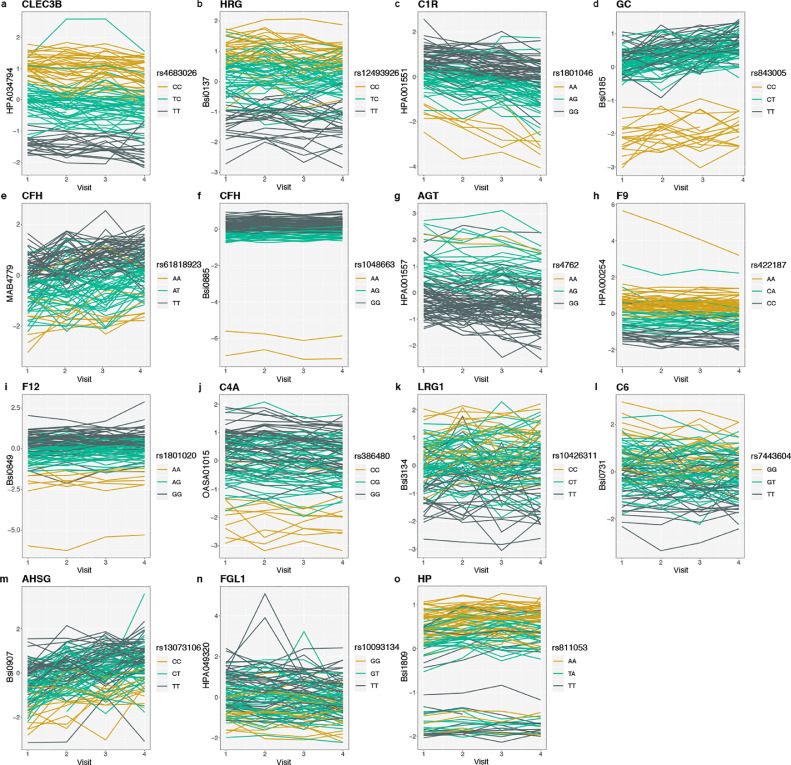
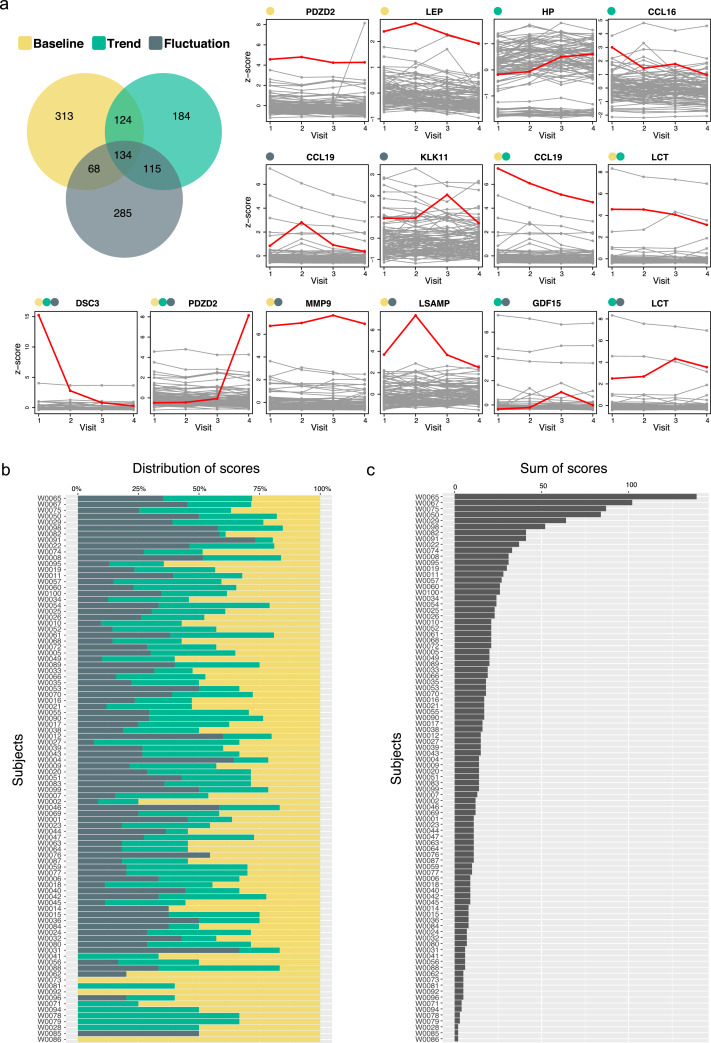
Findings: We found signatures of circulating proteomes to be highly individual-specific. Considering technical and longitudinal variability, we observed that 49% of the protein profiles were stable over one year. We also identified eight networks of proteins in which 11-242 proteins covaried over time. For each participant, there were unique protein profiles of which some could be explained by associations to genetic variants.

Interpretation: This observational and non-interventional study identifyed noticeable diversity among clinically healthy subjects, and facets of individual-specific signatures emerged by monitoring the variability of the circulating proteomes over time. To enable more personal hence precise assessments of health states, longitudinal profiling of circulating proteomes can provide a valuable component for precision medicine approaches.

Funding: This work was supported by the Erling Persson Foundation, the Swedish Heart and Lung Foundation, the Knut and Alice Wallenberg Foundation, Science for Life Laboratory, and the Swedish Research Council.

Keywords: Affinity proteomics; Longitudinal profiling; Plasma proteomics; Precision medicine; pQTLs.


Figures

Fig 1
Fig. 1
Experimental design and data analysis pipeline. (A) Over the course of one year, samples from 101 individuals were collected at four different visits to the clinic. (B) Plasma proteins were measured from 1 µl EDTA plasma with antibodies conjugated to beads. (C) Following each completed visit, samples were randomized within an assay and analysed together with all previously collected visits. In total, four SBAs were created and incubated with the samples as indicted in the flowchart. (D) Protein profiles were tested for associations to clinical traits, longitudinal stability, networks of co-regulation and GWAS. The underlined labels correspond to assays where the complete set of samples were analysed in duplicate. Labels in bold correspond to assays where the SBA was incubated with 96 replicated samples for technical validation. SBA, suspension bead array; GWAS, genome wide association study
Fig. 2
Fig. 2
Association map of proteomics and clinical traits. Chord diagram of associations (FDR P < 0•001) between protein profiles and clinical traits obtained from linear mixed effect models. Line thickness is proportional to -log10(P-value) and coloured by clinical trait. Protein features that represent a family of several proteins are denoted with one gene name followed by “*”. Feature names are coloured red if predicted to be actively secreted into blood, or blue if they appear in blood due to cell leakage [9,40] (For interpretation of the references to color in this figure legend, the reader is referred to the web version of this article.).
Fig 3
Fig. 3
Inter-assay and inter-visit variability. Shown are correlations of technical (inter-assay, upper panel) and longitudinal (inter-visit, lower panel) profiles. (A) CD5 antigen-like (CD5L) represents a both technically and longitudinally stable protein, while levels of (B) Caldesmon 1 (CALD1) vary between visit but not repeated assays. Each dot represents one individual, coloured by sex (F, female; M, male), MFI relates to median fluorescent intensity and AU are arbitrary units. Correlations are indicated by ρ (Spearman's Rho) and r (Pearson correlation coefficient).
Fig 4
Fig. 4
Diversity of individual-specific protein profiles. UMAP analysis of 734 protein features and samples from four visits, coloured by subject (N = 101). Coloured lines indicate which samples belong to the same individual. UMAP, Uniform Manifold Approximation and Projection.
Fig 5
Fig. 5
Networks of co-varying proteins. WGCNA was used to determine co-varying proteins per visit (stacked groups) and across visits (horizontal bands). Each vertical line represents one protein and its mega module membership in each visit. Proteins are coloured according to the core pattern they belong to. Proteins that do not belong to any core pattern are grey. Each core pattern is annotated to the right with the number of proteins it contains, a summary of associated pathways and GO terms, and examples of proteins following the given pattern. The examples of proteins given are the five proteins with the highest correlation to the core pattern eigengene.
Fig 6
Fig. 6
Longitudinal characteristics of plasma protein genotypes. The line plots show plasma proteins associated to genetic variants where z-scores were used to represent protein levels. Each line represented one individual and colour codes the genotypes. Only individuals with data from all four visits were included for visualization.
Fig 7
Fig. 7
Facets of longitudinal protein variability. Protein profiles were stratified by their longitudinal profiles. (A) Venn Diagram indicates the number of observations (protein per individual) that was deviating (± 3xSD) from the population mean in terms of protein baseline, trend and fluctuations. Here, we selected 14 protein profile examples. Each grey line represents one individual. One selected individual with a particular protein profile is highlighted in red, and the category of the red profile is marked on the left side of the protein name. (B) Distribution of the three annotation criteria per subject, and (C) the sum of the three annotation criteria per individual (For interpretation of the references to color in this figure legend, the reader is referred to the web version of this article.).

References

    1. Piening BD, Zhou W, Contrepois K. Integrative personal omics profiles during periods of weight gain and loss. Cell Syst. 2018;6(2):157–170. e8. - PMC - PubMed
    1. Price ND, Magis AT, Earls JC. A wellness study of 108 individuals using personal, dense, dynamic data clouds. Nat Biotechnol. 2017;35(8):747–756. - PMC - PubMed
    1. Williams SA, Kivimaki M, Langenberg C. Plasma protein patterns as comprehensive indicators of health. Nat Med. 2019;25(12):1851–1857. - PMC - PubMed
    1. Hu JX, Thomas CE, Brunak S. Network biology concepts in complex disease comorbidities. Nat Rev Genet. 2016;17(10):615–629. - PubMed
    1. Spitzer MH, Nolan GP. Mass cytometry: single cells, many features. Cell. 2016;165(4):780–791. - PMC - PubMed