Clinical Trial
. 2020 Jul:57:102862.
doi: 10.1016/j.ebiom.2020.102862. Epub 2020 Jul 4.

Hematopoietic stem-cell senescence and myocardial repair - Coronary artery disease genotype/phenotype analysis of post-MI myocardial regeneration response induced by CABG/CD133+ bone marrow hematopoietic stem cell treatment in RCT PERFECT Phase 3

Affiliations
Clinical Trial

Hematopoietic stem-cell senescence and myocardial repair - Coronary artery disease genotype/phenotype analysis of post-MI myocardial regeneration response induced by CABG/CD133+ bone marrow hematopoietic stem cell treatment in RCT PERFECT Phase 3

Markus Wolfien et al. EBioMedicine. 2020 Jul.

Abstract

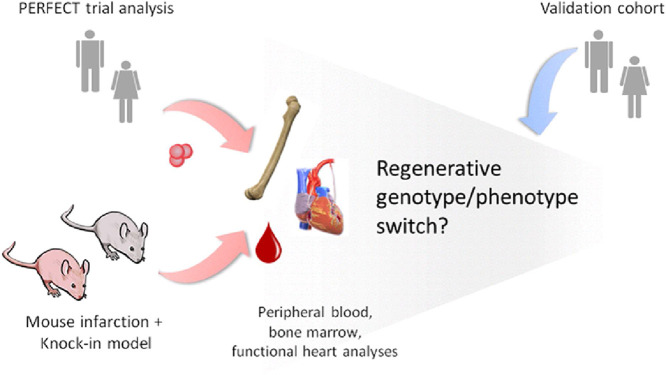
Background: Bone marrow stem cell clonal dysfunction by somatic mutation is suspected to affect post-infarction myocardial regeneration after coronary bypass surgery (CABG).

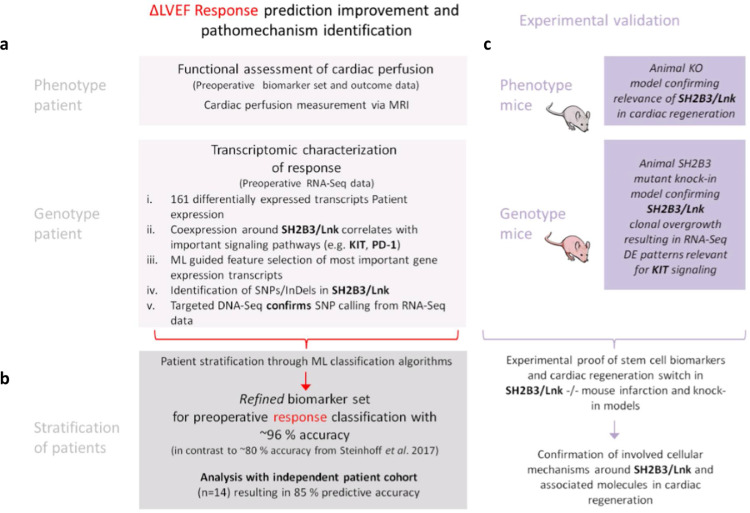
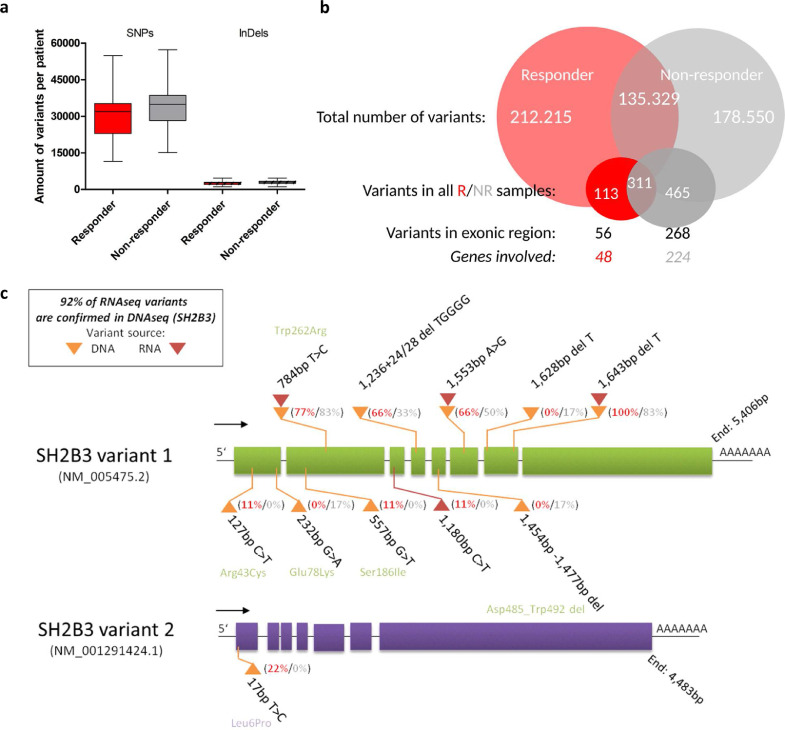
Methods: Transcriptome and variant expression analysis was studied in the phase 3 PERFECT trial post myocardial infarction CABG and CD133+ bone marrow derived hematopoetic stem cells showing difference in left ventricular ejection fraction (∆LVEF) myocardial regeneration Responders (n=14; ∆LVEF +16% day 180/0) and Non-responders (n=9; ∆LVEF -1.1% day 180/0). Subsequently, the findings have been validated in an independent patient cohort (n=14) as well as in two preclinical mouse models investigating SH2B3/LNK antisense or knockout deficient conditions.

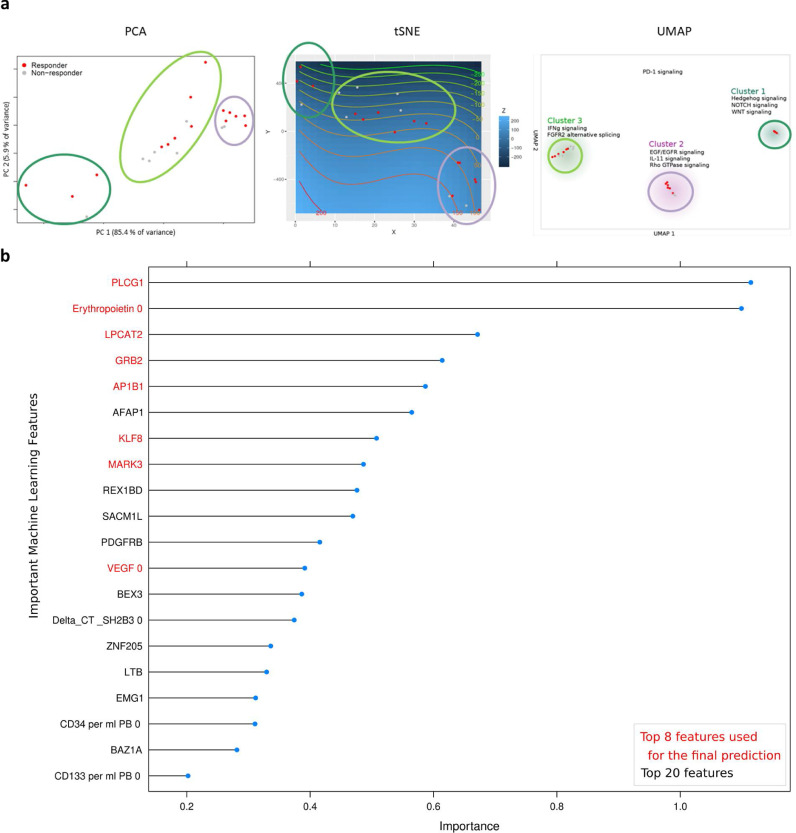
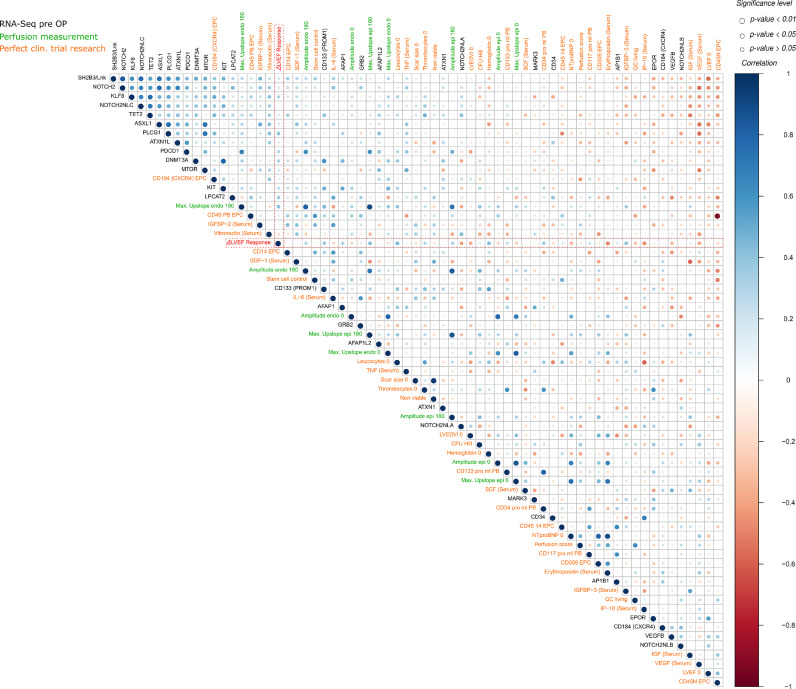
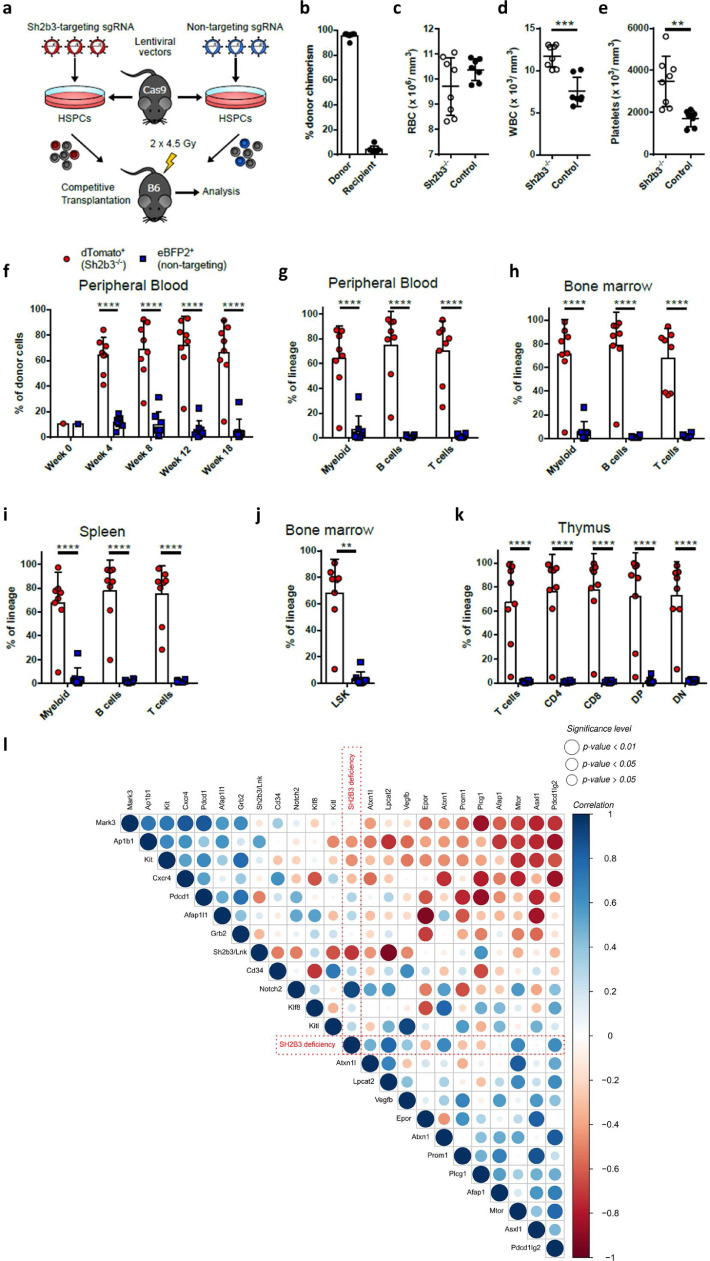
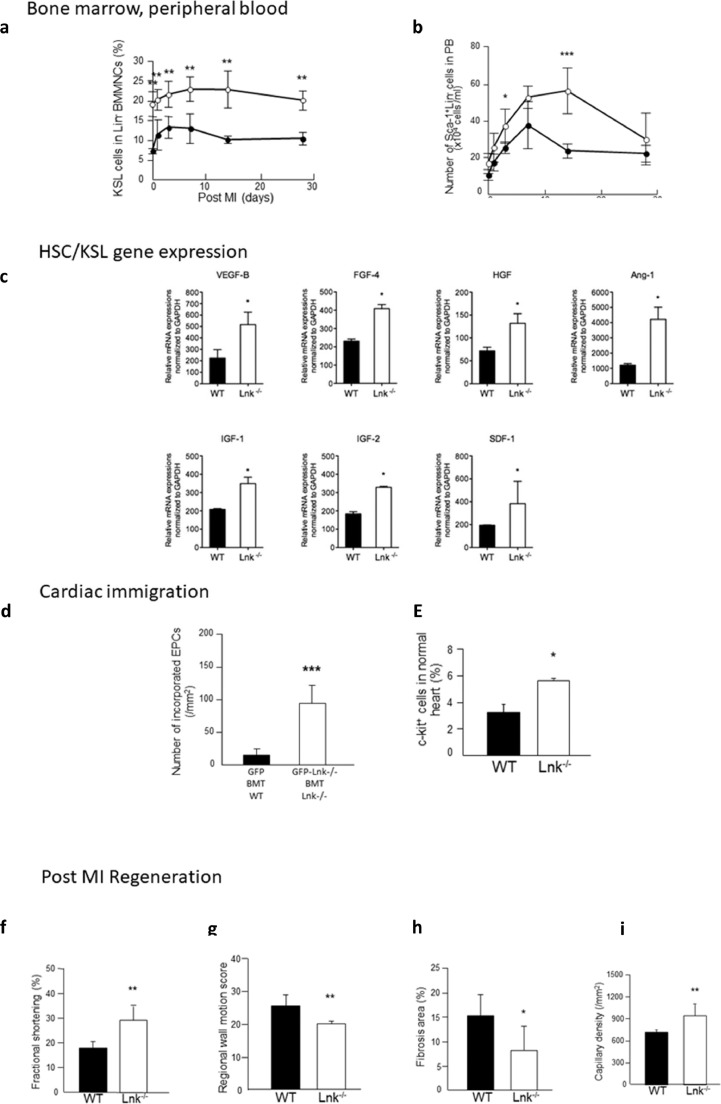
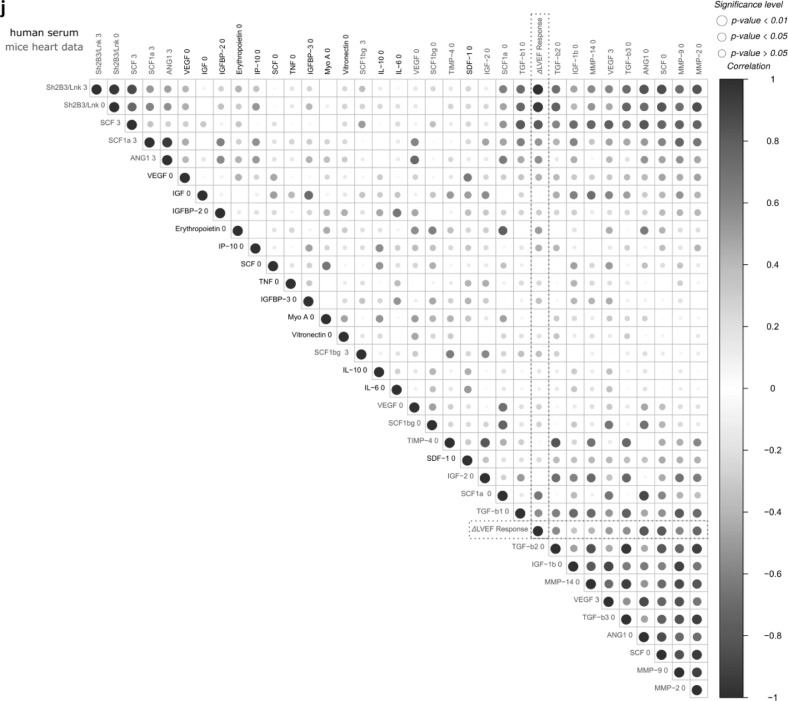
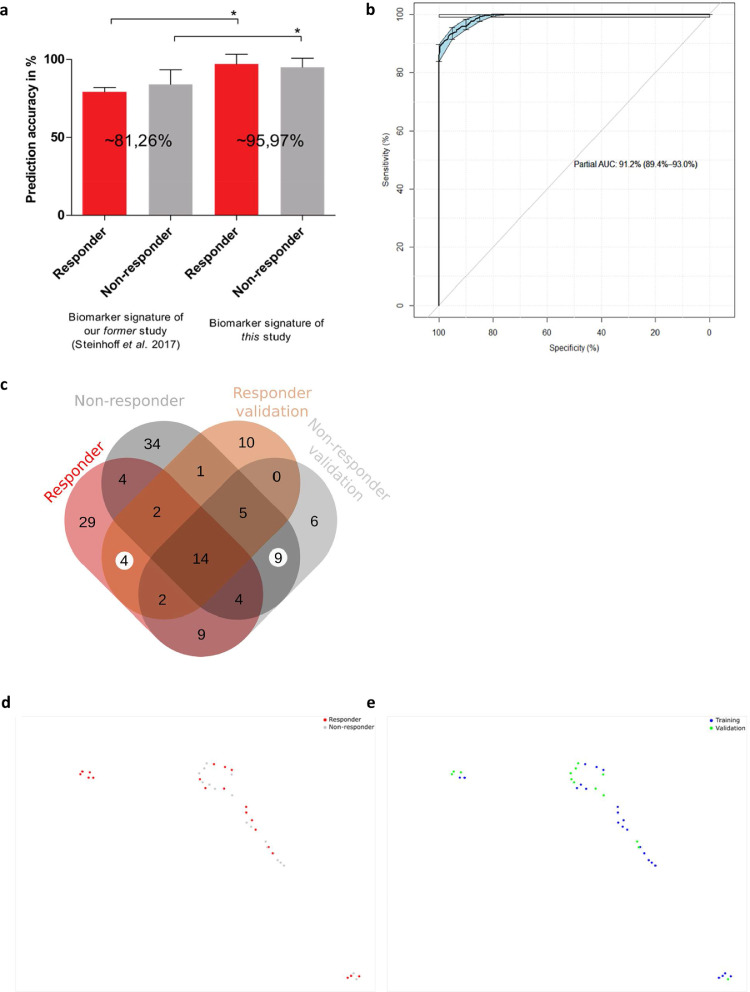
Findings: 1. Clinical: R differed from NR in a total of 161 genes in differential expression (n=23, q<0•05) and 872 genes in coexpression analysis (n=23, q<0•05). Machine Learning clustering analysis revealed distinct RvsNR preoperative gene-expression signatures in peripheral blood acorrelated to SH2B3 (p<0.05). Mutation analysis revealed increased specific variants in RvsNR. (R: 48 genes; NR: 224 genes). 2. Preclinical:SH2B3/LNK-silenced hematopoietic stem cell (HSC) clones displayed significant overgrowth of myeloid and immune cells in bone marrow, peripheral blood, and tissue at day 160 after competitive bone-marrow transplantation into mice. SH2B3/LNK-/- mice demonstrated enhanced cardiac repair through augmenting the kinetics of bone marrow-derived endothelial progenitor cells, increased capillary density in ischemic myocardium, and reduced left ventricular fibrosis with preserved cardiac function. 3.

Validation: Evaluation analysis in 14 additional patients revealed 85% RvsNR (12/14 patients) prediction accuracy for the identified biomarker signature.

Interpretation: Myocardial repair is affected by HSC gene response and somatic mutation. Machine Learning can be utilized to identify and predict pathological HSC response.

Funding: German Ministry of Research and Education (BMBF): Reference and Translation Center for Cardiac Stem Cell Therapy - FKZ0312138A and FKZ031L0106C, German Ministry of Research and Education (BMBF): Collaborative research center - DFG:SFB738 and Center of Excellence - DFG:EC-REBIRTH), European Social Fonds: ESF/IV-WM-B34-0011/08, ESF/IV-WM-B34-0030/10, and Miltenyi Biotec GmbH, Bergisch-Gladbach, Germany. Japanese Ministry of Health : Health and Labour Sciences Research Grant (H14-trans-001, H17-trans-002) TRIAL REGISTRATION: ClinicalTrials.gov NCT00950274.

Keywords: Angiogenesis induction; CABG; CHIP; Cardiac stem cell therapy; Clonal hematopoiesis of indeterminate pathology; Coronary bypass surgery; Machine learning; Myocardial regeneration; Post myocardial infarction heart failure; SH2B3.


Figures

Image, graphical abstract
Graphical abstract
Fig 1:
Fig. 1
Overview of utilized integrative analysis approach integrating clinical patient data with murine pre-clinical models: Genotype/phenotype analysis in randomised clinical trial PERFECT cardiac regeneration outcome and knock-out animal disease model verification of regulatory genes.
Fig 2:
Fig. 2
a: ML subgroup clusters of cohort study (Responder, n=14, red points; Non-responder, n=9, grey points). b: Machine learning feature selection on clinical trial research data and RNA-Seq data. Accuracy comparison for the supervised prediction of the patient responsiveness using only preoperative data. Results are obtained after feature selection and subsequent prediction with two independent classifiers. The graph shows the true positive prediction weights of the ML model (RF for feature selection and SVM for final prediction). Combinations and subsets of these features have been subsequently used to train the final model. The importance indicates a hierarchy of the most relevant features needed for a classification.
Fig. 3:
Fig. 3
Integration of RNA-Seq, perfusion, and clinical trial research data for Pearson correlation analysis. Comparison of peripheral blood (PB) circulating cells and biomarkers (orange), MRI myocardial perfusion parameters (green), and human PB gene expression data (RNA-Seq) (black). The ΔLVEF response (red) is highlighted for an improved visual analysis of important correlations. The color scale, ranging from 1 to -1 in the upper panel (blue to red), represents the correlation between the different factors. The size of the dots represents the significance (p<0,01, p<0,05, and p>0,05; Pearson correlation) of the respective correlation (For interpretation of the references to color in this figure legend, the reader is referred to the web version of this article.).
Fig. 4:
Fig. 4
Summary of genetic mutation signature analysis in PERFECT patients via sequencing analysis. a: Transcriptomic variants identified through RNA-Seq data analysis. Plot shows the average number of variants (SNPs and InDels) per patient that have been identified by applying our customized transcriptomic variant calling pipeline and filtering approaches. SNPs and InDels are considered as successfully called, if at least five independent reads support the individual variant. b: Venn diagram for the RvsNR variant comparison, exonic region association, and unique gene identification. c: Targeted DNA-Seq (yellow triangle) and RNA-Seq (red triangle) variant summary of SH2B3. The plot shows the ratio of SNP/del sites that are identified in Responders (red) and Non-responders (grey) as well as the possible amino acid transfer from its origin to its potential replacement (For interpretation of the references to color in this figure legend, the reader is referred to the web version of this article.).
Fig. 5:
Fig. 5
Influence of SH2B3 on HSC clonal overgrowth by using competitive bone marrow transplantation of Sh2b3−/− HSPCs. a: Scheme of the competitive transplantation assay is shown. HSPCs, which are derived from a SpCas9 transgenic mouse model (GFP+), were transduced with a lentiviral vector carrying a sgRNA against Sh2b3 and a dTomato fluorescent reporter. As competitor cells, HSPCs were transduced with a non-targeting sgRNA and an eBFP2 fluorescent reporter. After transduction, the Sh2b3−/− and Sh2b3-intact competitor cells were transplanted in a 1:1 mixture into irradiated C57BL/6 (B6, GFP) recipient mice. Irradiation was performed using a fractionated dose of 2 × 4.5 Gy. b: Percentage of donor (GFP+) and recipient (GFP) cells of total CD45+ cells in the bone marrow of mice at week 18 after transplantation. c: Red blood cell (RBC) count in Sh2b3−/− transplanted mice and untreated control animals at week 18 after transplantation. d: White blood cell (WBC) count in Sh2b3−/− transplanted mice and untreated control animals at week 18 after transplantation. e: Platelet count in Sh2b3−/− transplanted mice and untreated control animals at week 18 after transplantation. f: Presence of Sh2b3−/- (dTomato+) and competitor (eBFP2+) cells in the donor cell population in the peripheral blood at week 4, 8, 12, and 18 after transplantation. Week 0 shows the presence of dTomato+ and eBFP2+ cells in the transplanted cell population. g-k: Presence of Sh2b3−/- (dTomato+) and Sh2b3-intact competitor (eBFP2+) cells in the indicated lineage of donor cells in the peripheral blood g:, in the bone marrow h:, in the spleen i:, in Lineage Sca1+ cKIT+ (LSK) HSPCs of the bone marrow j:, and in T cells of the thymus k: at week 18 after transplantation. l: Pearson correlation analysis of RNA-Seq data derived from murine Sh2b3 HSC clonal overgrowth model. The Sh2b3 deficiency (red) is highlighted for an improved visual analysis of important correlations. The color scale, ranging from 1 to -1 in the upper panel (blue to red), represents the correlation between the different factors. The size of the dots represents the significance (p<0.01, p<0.05, and p>0.05, Pearson correlation) of the respective correlation. Transplanted mice: n=8. Control mice: n=7. All graphs represent mean ± SD. Statistics: c-e: Unpaired t-test after normality test (D'Agostino & Pearson omnibus normality test) was passed; f-i:, k: Two-way ANOVA. j: Kolmogorov-Smirnov test. Significance level: ** p<0. 01, *** p<0.001, and **** p<0.0001 (For interpretation of the references to color in this figure legend, the reader is referred to the web version of this article.).
Fig. 6:
Fig. 6
Experimental SH2B3 mouse MI-model Bone marrow, peripheral blood kinetics of KSL cells in BM and SL cells in PB in WT vs. SH2B3/LNK−/- mice following MI. SH2B3/LNK−/− leads to increased EPC in bone marrow and circulation post MI a: Percent of KSL cells in Lin BMMNCs before and after MI significantly increased in SH2B3/LNK−/− mice (open circles) compared with WT mice (closed circles). Two-way ANOVA followed by Tukey's multiple comparisons test **, p<0.01 vs. WT (n=3-4). b: Number of Sca-1+/Lin (SL) cells in PB in SH2B3/LNK−/− mice (open circles) and WT mice (closed circles) before (Pre) and one day, 3, 7, 14, and 28 days after MI. Two-way ANOVA followed by Tukey's multiple comparisons test *, p<0.05 and ***, p<0.01 vs. WT (n=3-4). c: HSC/KSL gene expression - Growth Factor and Chemokine mRNA expressions in WT BM-KSL cells vs. SH2B3/LNK−/− BM-KSL cells. KSL cells were sorted from freshly isolated BMMNCs by FACS, and were analysed the expressions of VEGF-B, FGF-4, HGF, Ang-1, IGF-1, IGF-2, and SDF-1 by quantitative real-time RT-PCR. Each relative mRNA expression was normalized to GAPDH and compared between WT BM-KSL cells (solid bar) and SH2B3/LNK−/− BM-KSL cells (open bar). Bonferroni post hoc test *, p<0.05. (n=3). d: Effect of SH2B3/LNK gene deficiency on recruitment of BM-derived progenitors to ischemic myocardium. d: Double fluorescent immunostaining for GFP (green) and isolectin B4 (red) in heart sections in WT mice transplanted with GFP+ BM and in SH2B3/LNK−/− mice transplanted with GFP+- SH2B3/LNK−/− BM 7 days following MI. Number of recruited BM-derived cells into vasculature in ischemic myocardium 28 days following MI were counted and averaged. Mann-Whitney comparison test **, p<0.01 and ***, p<0.001 vs. WT mice transplanted with GFP BM. (n=3). e: Assessment for proliferation activity in CSCs/CPCs and cardiomyocytes in ischemic myocardium. Double fluorescent immunostaining for BrdU (red) and c-KIT (green) in heart sections in WT mice and in SH2B3/LNK−/− mice 7 days following MI. Number of BrdU+/c-KIT+ cells in ischemic myocardium 7 days following MI were counted and averaged. Mann-Whitney comparison test *, p<0.05 vs. WT mice (WT: n=4 and SH2B3/LNK−/−: n=3). f-i: Post MI regeneration: physiological and histological assessment for LV function in WT vs. SH2B3/LNK−/- mice following MI. M-mode echocardiography in WT mice and SH2B3/LNK−/− mice 28 days following MI. Fractional shortening (f) and regional wall motion score (g) were significantly great in SH2B3/LNK−/− mice than that in WT mice. Hemodynamic study using a micro-tip catheter in WT mice and SH2B3/LNK−/− mice 28 days following MI. +dP/dt, -dP/dt and EDP were significantly preserved in SH2B3/LNK−/− mice than those in WT mice. Mann-Whitney comparison test *, p<0.05 and **, p<0.01 vs. WT. (n=11) (+dP/dt: WT, 5,942.1±823.7 vs. SH2B3/LNK−/−, 8,901.6±1,147.9 mmHg/sec, p<0.01; -dP/dt: WT, -4,675.9±615.9 vs. SH2B3/LNK−/−, -6,201.4±875.4 mmHg/sec, p<0.01; EDP: WT, 8.6±2.1 vs. SH2B3/LNK−/−, 4.4±1.2 mmHg, p<0.05) (h) Representative Masson's trichrome stained heart sections in WT mice and SH2B3/LNK−/− mice 28 days following MI. Percent of fibrosis area in entire LV area on cross-sections. Histological analysis was performed on day 28 post MI. The percentage of fibrosis area was less in SH2B3/LNK−/− mice than WT mice (WT, 15.2±4.3 vs. SH2B3/LNK−/−, 8.0±5.0 %, p<0.05). Fibrosis area was significantly reduced in SH2B3/LNK−/− mice compared with WT mice. Bonferroni post hoc test * p<0,05 vs. WT. (WT: n=6 and SH2B3/LNK−/−: n=10) (i) Immunostaining for isolectin B4 (brown) in WT and SH2B3/LNK−/− mice 28 days following MI. Capillary density in ischemic border zone in infarcted myocardium of WT mice and SH2B3/LNK−/− mice. Bonferroni post hoc test **, p<0.01 vs. WT. (WT: n=5 and SH2B3/LNK−/−: n=9) capillary density in infarction border zone was significantly greater in SH2B3/LNK−/− mice than WT mice (WT, 713±28 vs. SH2B3/LNK−/−, 937±157/mm2, p<0.01). On the other hand, there was no significant difference in LV function and capillary density between WT mice and SH2B3/LNK−/− mice without ischemic injury. j: Pearson correlation analysis between the mouse infarction model (SH2B3/LNK -/−vs. WT) and human phase 3 PERFECT trial (ΔLVEF Responder vs. Non-responder). The human ΔLVEF response is highlighted for an improved visual analysis of important correlations. The color scale, ranging from 1 to -1 in the upper panel (blue to red), represents the correlation between the different factors. The size of the dots represents the significance (p<0.01, p<0.05, and p>0.05; Pearson correlation) of the respective correlation. Comparison of peripheral blood (PB) circulating cells and biomarkers between mice (purple) and human (serum) (black) (For interpretation of the references to color in this figure legend, the reader is referred to the web version of this article.).
Fig. 6:
Fig. 6
(Continued).
Fig. 7:
Fig. 7
Patient stratification to responder and non-responder. Clustering and SNP signature comparison for the analysis and validation cohort. a: Machine learning accuracy comparison for the supervised prediction of the patient responsiveness using only preoperative data. Results are obtained after feature selection and subsequent prediction with two independent classifiers. The graph shows the true positive prediction results of two ML models (AdaBoost for feature selection and RF for final prediction for the former study and RF and SVM for the current study).The error bars indicate the respective accuracy standard deviation for the constructed models that have been obtained after 100 iterations. * indicates that the 100 model iterations are significant different according to Bonferroni post-hoc test (p<0.01). b: Receiver Operating Characteristics (ROC) curve for the random forest machine learning model. The plot represents the sensitivity (true positive rate) and the specificity (false positive rate) of the model. The area under the ROC curve (AUC) represents the entire area underneath the ROC curve and the confidence intervals (95%CI) are indicated in blue. c: Venn diagram summarizing the identified SNPs in RvsNR for the analysis and validation cohort. d-e: Validation for the clustering with primary cohort (n=23, blue, Rostock trial center biomarker cohort) and independent validation cohort (n=14, green, Hannover center). UMAP representation with k=4 and 2,000 epochs (For interpretation of the references to color in this figure legend, the reader is referred to the web version of this article.).

Comment in

References

    1. Blau HM, Brazelton TR, Weimann JM. The evolving concept of a stem cell: entity or function? Cell. 2001;105:829–841. - PubMed
    1. Korbling M, Estrov Z. Adult stem cells for tissue repair - a new therapeutic concept? N Engl J Med. 2003;349:570–582. - PubMed
    1. Weissman IL. Stem cells: units of development, units of regeneration, and units in evolution. Cell. 2000;100:157–168. - PubMed
    1. Moehrle BM, Geiger H. Aging of hematopoietic stem cells: DNA damage and mutations? Exp Hematol. 2016; Oct;44(10):895–901. doi: 10.1016/j.exphem.2016.06.253. Epub 2016 Jul 8. - DOI - PMC - PubMed
    1. Jaiswal S, Natarajan P, Silver AJ. Clonal Hematopoiesis and Risk of Atherosclerotic Cardiovascular Disease. N Engl J Med. 2017;377(2):111–121. doi: 10.1056/NEJMoa1701719. Epub 2017 Jun 21. - DOI - PMC - PubMed

Publication types

MeSH terms

Associated data