Review
. 2020 Jul 2;10(7):1300.
doi: 10.3390/nano10071300.

Direct Ink Writing Technology (3D Printing) of Graphene-Based Ceramic Nanocomposites: A Review

Affiliations
Review

Direct Ink Writing Technology (3D Printing) of Graphene-Based Ceramic Nanocomposites: A Review

Nestor Washington Solís Pinargote et al. Nanomaterials (Basel). .

Abstract

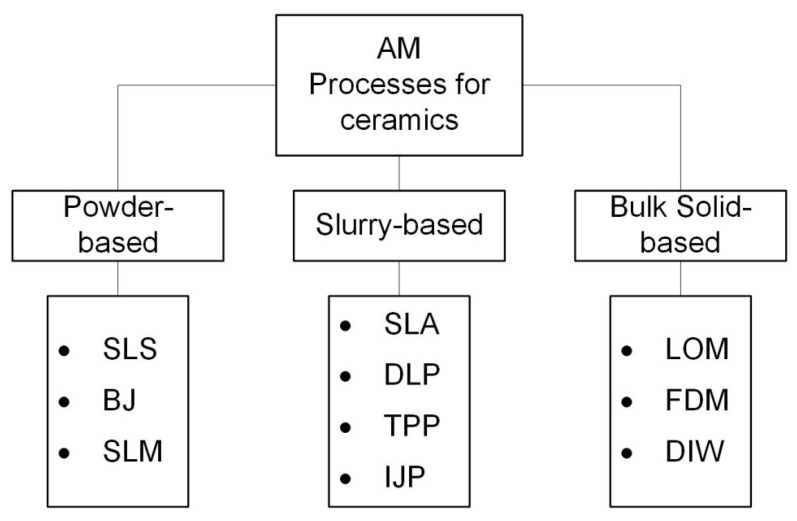
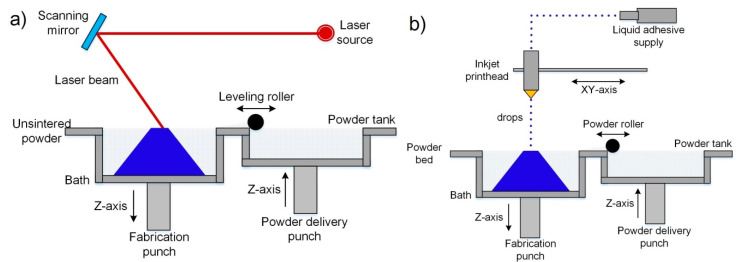
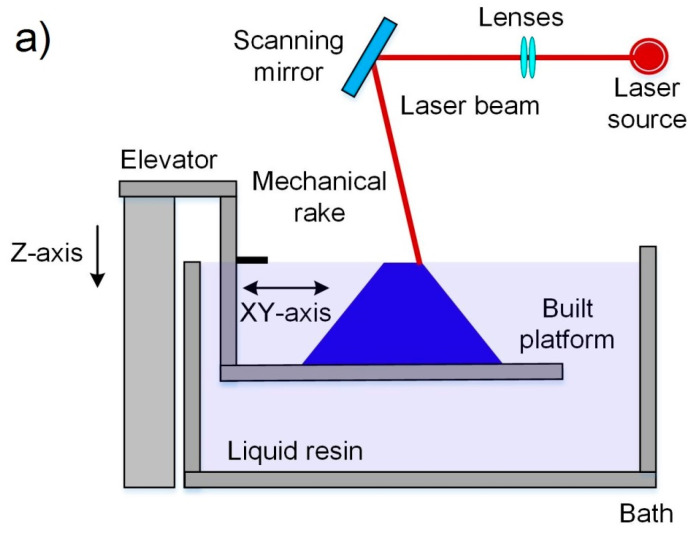
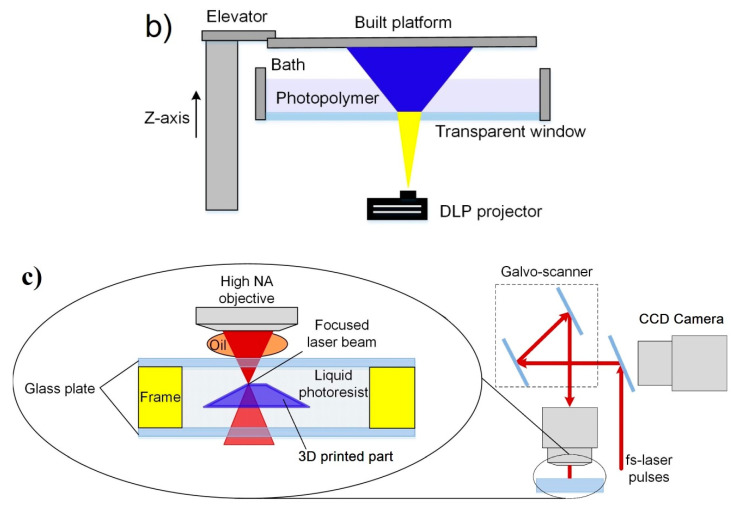
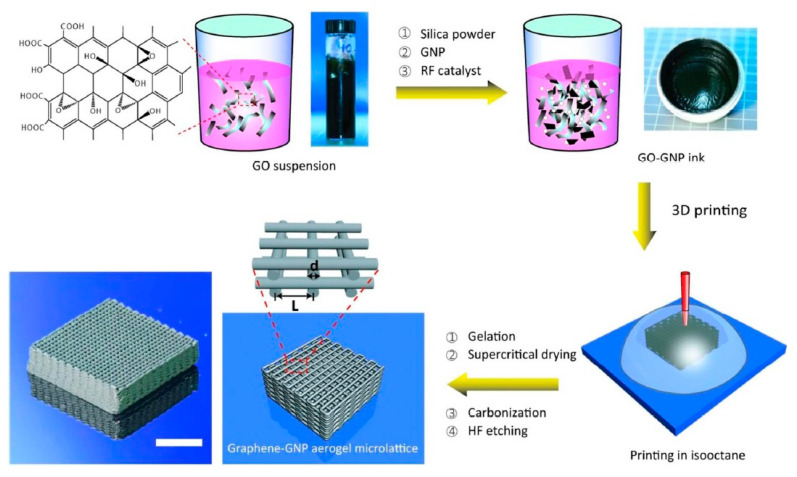
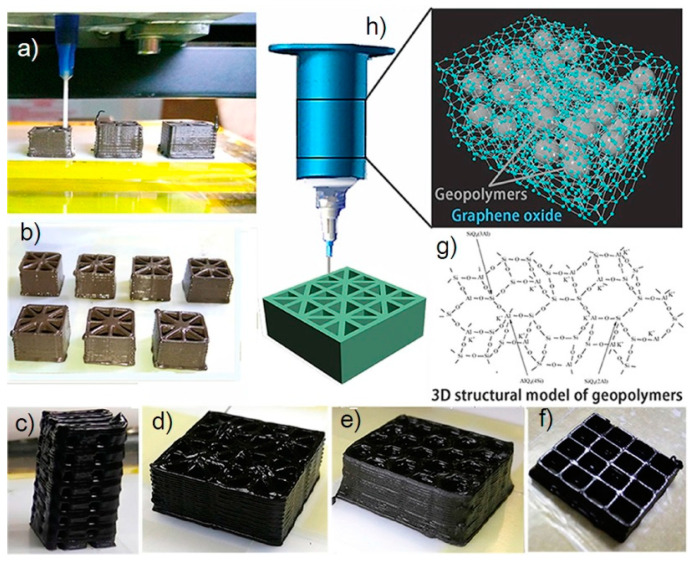
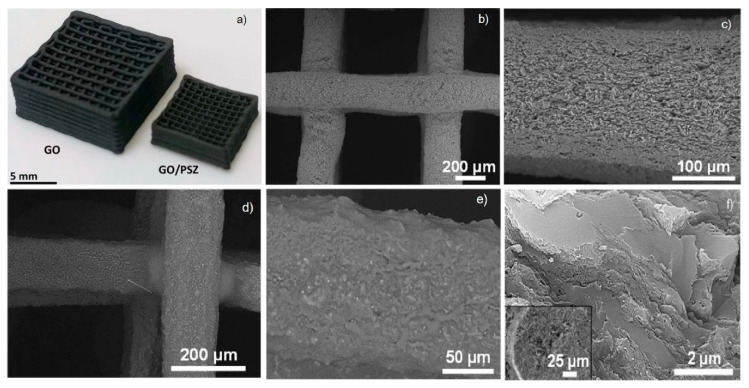
In the present work, the state of the art of the most common additive manufacturing (AM) technologies used for the manufacturing of complex shape structures of graphene-based ceramic nanocomposites, ceramic and graphene-based parts is explained. A brief overview of the AM processes for ceramic, which are grouped by the type of feedstock used in each technology, is presented. The main technical factors that affect the quality of the final product were reviewed. The AM processes used for 3D printing of graphene-based materials are described in more detail; moreover, some studies in a wide range of applications related to these AM techniques are cited. Furthermore, different feedstock formulations and their corresponding rheological behavior were explained. Additionally, the most important works about the fabrication of composites using graphene-based ceramic pastes by Direct Ink Writing (DIW) are disclosed in detail and illustrated with representative examples. Various examples of the most relevant approaches for the manufacturing of graphene-based ceramic nanocomposites by DIW are provided.

Keywords: additive manufacturing; ceramic nanocomposites; direct ink writing; graphene oxide; graphene-based paste.


Conflict of interest statement

The authors declare no conflict of interest.

Figures

Figure 1
Figure 1
Classification of AM technologies for ceramics by the type of feedstock used: SLS–Selective Laser Sintering; BJ–Binder Jetting; SLM–Selective Laser Melting; SLA–Stereolithography; DLP–Digital Light Processing; TPP–Two-Photon Polymerization; IJP–Ink Jet printing; LOM–Laminated Object Manufacturing; FDM–Fused Deposition Modeling and DIW–Direct Ink Writing.
Figure 2
Figure 2
Schematic diagrams of powder-based additive manufacturing (AM) technologies main methods: (a) SLS and SLM; (b) BJ. Adapted from [44], with permission from Wiley-VCH Verlag GmbH and Co. KGaA, Weinheim, 2018.
Figure 3
Figure 3
Schematic diagrams of slurry-based AM technologies main methods: (a) SLA; (b) DLP; (c) two-photon polymerization (TPP). Figure 3a,b adapted from [44], with permission from Wiley-VCH Verlag GmbH & Co. KGaA, Weinheim, 2018.
Figure 3
Figure 3
Schematic diagrams of slurry-based AM technologies main methods: (a) SLA; (b) DLP; (c) two-photon polymerization (TPP). Figure 3a,b adapted from [44], with permission from Wiley-VCH Verlag GmbH & Co. KGaA, Weinheim, 2018.
Figure 4
Figure 4
Schematic diagrams of printing methods used in Inkjet printing: (a) continuous inkjet (CIJ); (b) drop-on-demand (DOD).
Figure 5
Figure 5
Schematic diagrams of bulk solid-based AM technology main methods: (a) LOM; (b) FDM; (c) direct ink writing (DIW). Figure 5a,b adapted from [44], with permission from Wiley-VCH Verlag GmbH & Co. KGaA, Weinheim, 2018.
Figure 6
Figure 6
(A) Tensile strength comparison of casted and 3D-printed parts; SLA-printed complex-shaped graphene oxide (GO) nanocomposites: (B) nested dodecahedron and (C) diagrid ring. Reproduced from [171], with permission from American Chemical Society, 2017.
Figure 7
Figure 7
Pictures of (a,c) monolithic UV-cured resin and (b,d) graphene-reinforced nanocomposite jawbone with a square architecture and gyroid scaffold for bone tissue engineering, respectively. Reproduced from [172], with permission from Zuying Feng et al., 2019.
Figure 8
Figure 8
(A) Four “Green” MAG parts of differing unit-cell structures before pyrolysis from left to right: octet-truss, gyroid, cubo-octahedron, and Kelvin foam; (B) optical image of pyrolyzed gyroid; (C) SEM image of pyrolyzed gyroid with intricate overhang structures (D) zoomed image of pyrolyzed gyroid in (C); (E) optical image of pyrolyzed MAG octet-truss, of a different design than shown in (A) supported by a single strawberry blossom filament; (F) SEM image of pyrolyzed octet-truss MAG in (E); (G) zoomed image of octet-truss in (E) showing the very high 10 micron resolution achievable in our process. Reproduced from [173], with permission from the Royal Society of Chemistry, 2018.
Figure 9
Figure 9
Diagram of the IJP process of graphene-based inks for e-textile manufacturing. Reproduced from [193], with permission from the Royal Society of Chemistry, 2017.
Figure 10
Figure 10
The different conductive paths, which were IJP on the untreated and treated areas of the cotton fabric with NP1. (a,c) show the SEM images of the untreated cotton fabric coated with 6 layers of IJP silver ink (×2000), and the IJP silver conductive path (6 layers) onto treated cotton fabric with 12 layers of NP1 (×1000), respectively. (b,e) show 3 different areas of the cotton fabric for silver and rGO ink, respectively: (1) area printed with 12 layers of NP1; (2) 6 layers of IJP silver (or rGO) conductive path onto NP1; and (3) untreated cotton fabric coated with 6 layers of IJP silver (or rGO) ink. (d,f) show the SEM images of the untreated cotton fabric coated with 6 layers of IJP rGO ink (×1000), and the IJP rGO conductive path (6 layers) onto treated cotton fabric with 12 layers of NP1 (×500), respectively. Reproduced from [193], with permission from the Royal Society of Chemistry, 2017.
Figure 11
Figure 11
(A) DOD printer for the printing of graphene suspension; (B) SEM image of printed pattern cross-sectional view; (C) image of printed graphene suspension a contour in which the average height was measured through the white line. (D) Sample print section (20× magnification). (E) height vs. distance of the sample line in (C). (F) SEM image of the printed graphene suspension top view after annealing. Reproduced from [187], with permission from the authors, 2020.
Figure 12
Figure 12
96 h cell culture results of NIH3T3 cells on 3D printed TPU/PLA with different GO loadings: (a) 0 wt% GO, (b) 0.5 wt% GO, (c) 2 wt% GO, (d) 5 wt% GO. Green color indicates live cells, whereas red color indicates dead cells. Adapted from [198], with permission from American Chemical Society, 2017.
Figure 13
Figure 13
Physiochemical characterization. (a) Optical image of the 3D printing process, (b) 3D printed electrode used throughout the study. (c) FESEM image of 3DE/Au electrode, and (d) corresponding magnified cross-sectional area. Reproduced from [202], with permission from Springer Nature, 2018.
Figure 14
Figure 14
(a) Simplified schematics depicting the process of graphene-based 3D printing by FDM; (b) two units of 3D printed paper-based flexible circuits pattern; (c) LED circuit with a bunch of 3D printed filaments; (d) 3D printed flexible circuits. Reproduced from [201], with permission from Elsevier, 2016.
Figure 15
Figure 15
Storage (filled squares) and loss moduli (open squares) of graphene oxide suspensions and the schematic illustrations of the liquid crystal (LC) phase changes upon the increasing concentration of the graphene oxide suspensions. (a) At extremely low concentration. (b,c) Some nematic ordering begins to appear when the concentration increases to 0.25 mg/mL. (d) In the dispersion single-phase nematic LC starts to form. (e) The increase of the nematic phase packing is higher with the increase of the GO concentration. (f) Some regions of GO exhibit orientation in the nematic phase. (g,h) Smaller monodomains are formed associated with an exceptional increase in elastic modulus. Adapted from [204], with permission from The Royal Society of Chemistry, 2014.
Figure 16
Figure 16
Fingerprints of the rheological characteristic of LC GO dispersions. (a) Yied stress (σY) and yield strain (γY) versus GO volume fraction. (b) Storage and loss moduli of GO suspensions versus strains (frequency of 0.01 Hz). (c) No aging after shear fluidization can be observed. Adapted from [204], with permission from The Royal Society of Chemistry, 2014.
Figure 17
Figure 17
Schematic demonstration of the 3D printable heater. (a) 3D printing of RGO heater. The inset has 4 heaters shown with a size of 1.5 mm. (b) The image of the as-printed 3D heater. (c) The RGO heater achieves temperatures above 3000 K when a driving current is applied. (d) image of 3D printed heater at high temperature. Adapted from [28], with permission from American Chemical Society, 2016.
Figure 18
Figure 18
(a) Patterned structure used for scaffolds designing and (b) scheme of the contact area between two orthogonal rods, where h, a, and Ø correspond to the distance between two equivalent layers in the z direction, the distance between two adjacent rods, and the rod diameter, respectively. (c) Apparent viscosity as a function of the shear rate for the GNPs/SiC pastes formulated with 0, 5, 10 and 20 vol% GNPs in the powder compositions. (d) View of a 10 vol% GNPs/SiC sintered scaffold. Reproduced from [208], with permission from Elsevier, 2016.
Figure 19
Figure 19
(a) 3D printed GO structure, (b) “a” dried 24 h in air; (c) Comparison of structures obtained after treatment at 1200 °C from GNP, GO and mix compositions; (d) Storage (G′) and loss (G″) moduli versus shear stress for the three inks: GO, GNP and mix. Reproduced from [211], with permission from Elsevier, 2019.
Figure 20
Figure 20
Schematic diagram part fabrication process: Mixing of SiO2, GNPs and R-F with the aqueous GO suspension. Then, the as-prepared GO paste was extruded in an isooctane bath, and the as-obtained part was gelled at 85 °C, then dried using supercritical carbon dioxide. Finally, the silica fillers were etched using diluted hydrofluoric acid. The scale bar is 10 mm. Reprinted Reproduced from [213], with permission from American Chemical Society, 2016.
Figure 21
Figure 21
(af) 3D printing process and some 3D printed structures. (bf) The colors of the printed samples turn from brownish to blackish when the GO loading increased. (g) The chemical structure of geopolymer, and (h) schematic diagrams of the painting process and the composite structure are also showed. Reproduced from [209], with permission from Elsevier, 2017.
Figure 22
Figure 22
SEM images of hydrated geopolymer particles encapsulated by graphene oxides sheets (ad), and their models. With the increase of GO concentration from 4 wt% to 20 wt% in nanocomposites, the agglomerate size (showed by dotted-line circles) decrease. Reproduced from [209], with permission from Elsevier, 2017.
Figure 23
Figure 23
(a) 3D printed scaffolds of GO (as-printed) and the composite structure GO/PSZ pyrolyzed at 800 °C. SEM micrographs of a GO lattice after dying/lyophilization steps showing a top view (b) and the surface of an extruded filament (c). Analogous SEM images of a PSZ infiltrated GO lattice pyrolyzed at 800 °C in N2, (d) top view, (e) filament and (f) cross-section at different magnifications. Reproduced from [217], with permission from Elsevier, 2018.
Figure 24
Figure 24
Viscoelastic behavior of pastes and GO suspensions: Storage Modulus (G′) vs. Oscillation Stress (a), and GO concentration influence on G′ (b), and yield stress (c). The proposed network created by GO flakes as concentration increases (d). A part of GO sheets form GO scrolls that together with the sheets bring together forming a 3D liquid crystal structure with high G′ (a). Reproduced from [29], with permission from American Chemical Society, 2017.
Figure 25
Figure 25
Printed objects from GO/Al2O3 platelets paste (a,b) and cross-section and lateral view of printed filament (c,d). Reproduced from [29], with permission from American Chemical Society, 2017.
Figure 26
Figure 26
Cylinder printed by DIW from GO/Al2O3 platelets paste and sintered at 1550 °C. (ac). The SEM images show the cylinder microstructure with open porosity of 60% determined by Archimedes’ Principle (d,e). Reproduced from [29], with permission from American Chemical Society, 2017.

References

    1. Kingery W.D., Bowen H.K., Uhlmann D.R. Introduction to Ceramics. 2nd ed. Wiley; New York, NY, USA: 1976. pp. 1–1056.
    1. Carter C.B., Norton M.G. Ceramic Materials: Science and Engineering. Springer; New York, NY, USA: 2013. pp. 1–766.
    1. Smirnov A., Kurland H.-D., Grabow J., Müller F.A., Bartolomé J.F. Microstructure, mechanical properties and low temperature degradation resistance of 2Y-TZP ceramic materials derived from nanopowders prepared by laser vaporization. J. Eur. Ceram. Soc. 2015;35:2685–2691. doi: 10.1016/j.jeurceramsoc.2015.03.006. - DOI
    1. Smirnov A., Beltrán J.I., Rodriguez-Suarez T., Pecharromán C., Muñoz M.C., Moya J.S., Bartolomé J.F. Unprecedented simultaneous enhancement in flaw tolerance and fatigue resistance of zirconia–Ta composites. Sci. Rep. 2017;7:44922. doi: 10.1038/srep44922. - DOI - PMC - PubMed
    1. Smirnov A., Bartolomé J.F., Kurland H.-D., Grabow J., Müller F.A. Design of a new zirconia-alumina-Ta micro-nanocomposite with unique mechanical properties. J. Am. Ceram. Soc. 2016;99:3205–3209. doi: 10.1111/jace.14460. - DOI

LinkOut - more resources