. 2020 Jul 6;21(1):288.
doi: 10.1186/s12859-020-03633-z.

PDXGEM: patient-derived tumor xenograft-based gene expression model for predicting clinical response to anticancer therapy in cancer patients

Affiliations

PDXGEM: patient-derived tumor xenograft-based gene expression model for predicting clinical response to anticancer therapy in cancer patients

Youngchul Kim et al. BMC Bioinformatics. .

Abstract

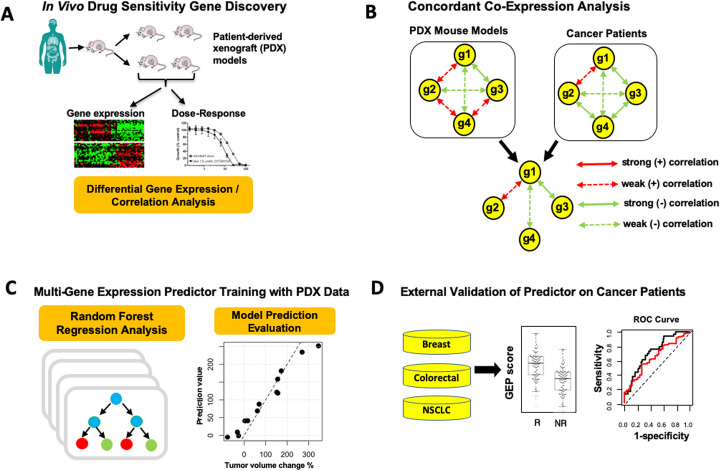
Background: Cancer is a highly heterogeneous disease with varying responses to anti-cancer drugs. Although several attempts have been made to predict the anti-cancer therapeutic responses, there remains a great need to develop highly accurate prediction models of response to the anti-cancer drugs for clinical applications toward a personalized medicine. Patient derived xenografts (PDXs) are preclinical cancer models in which the tissue or cells from a patient's tumor are implanted into an immunodeficient or humanized mouse. In the present study, we develop a bioinformatics analysis pipeline to build a predictive gene expression model (GEM) for cancer patients' drug responses based on gene expression and drug activity data from PDX models.

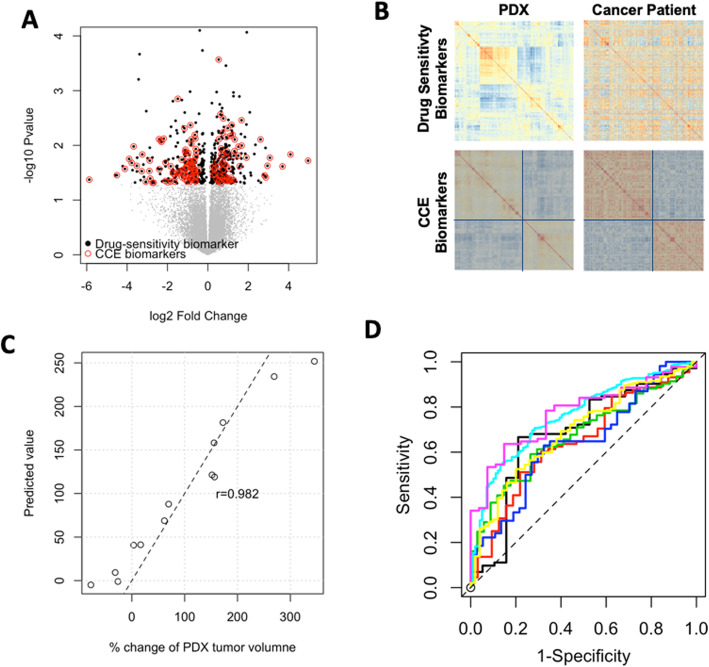
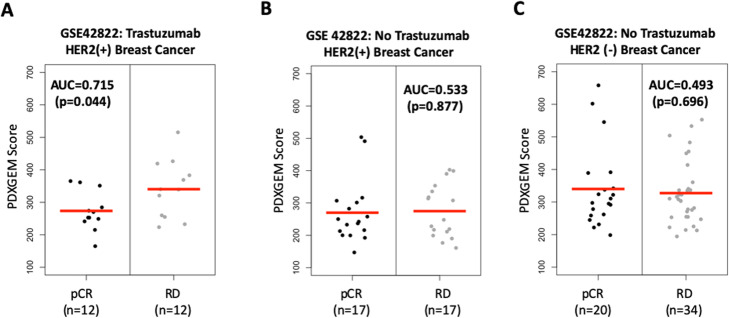
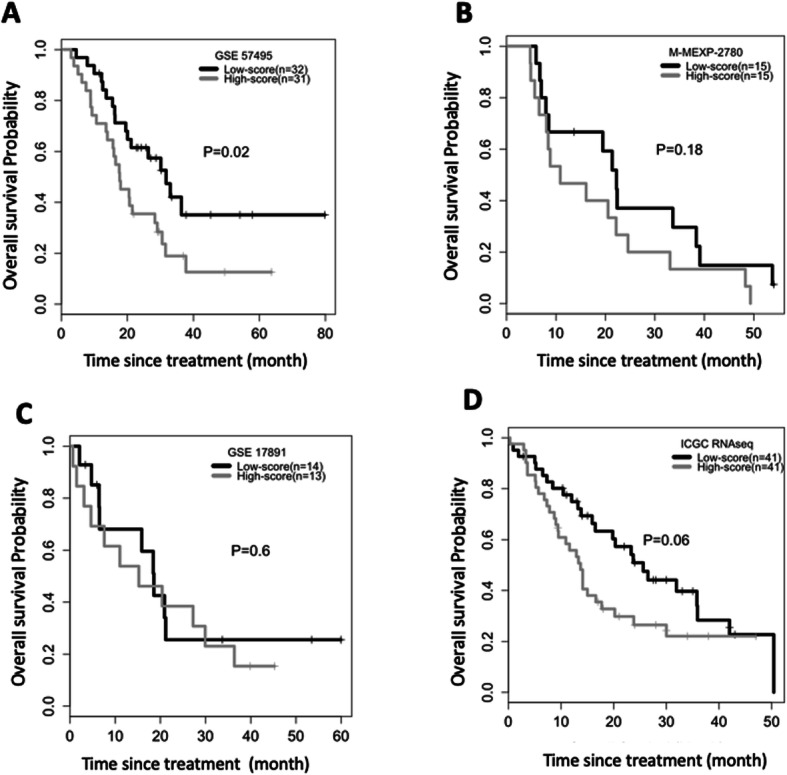
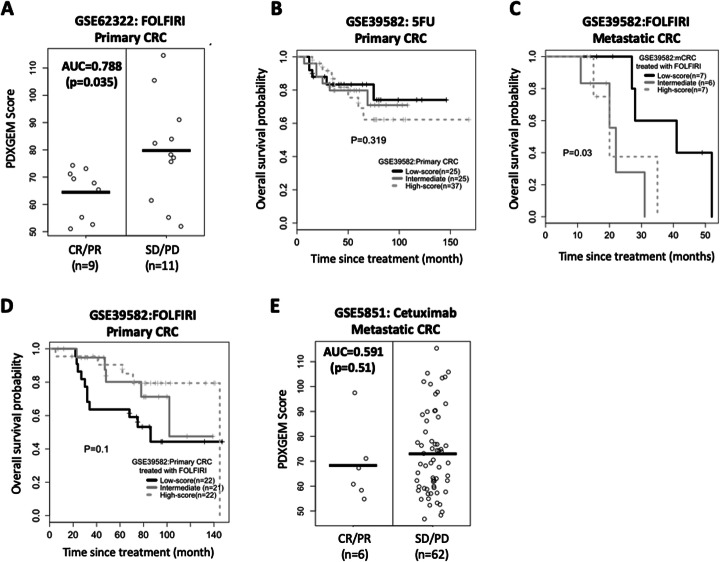
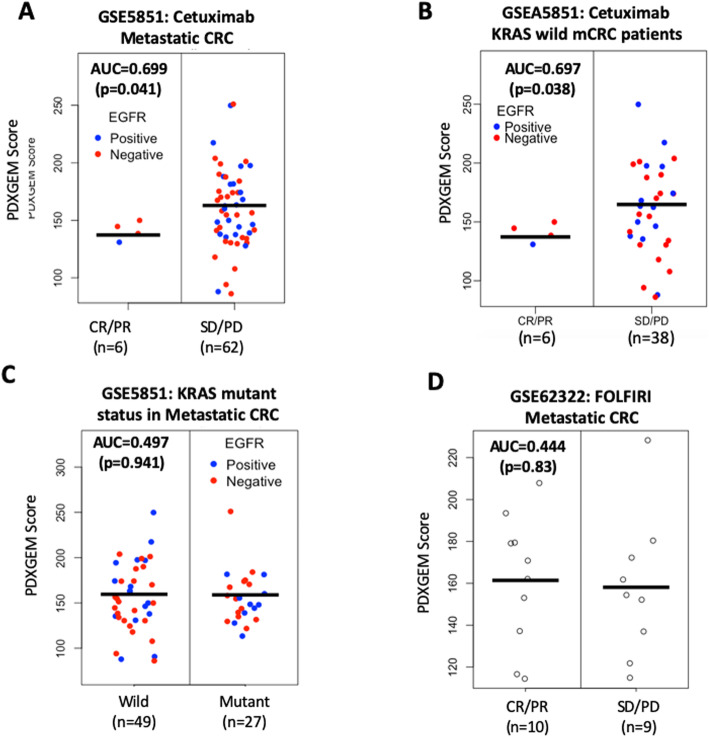
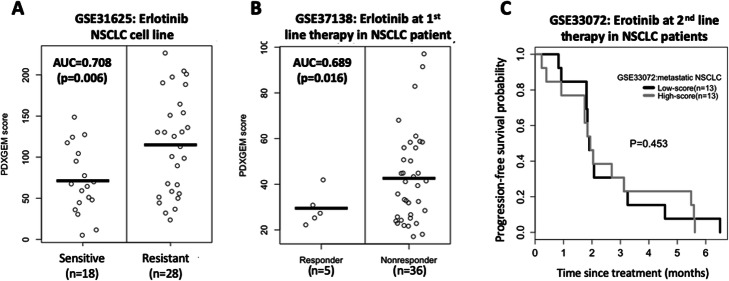
Results: Drug sensitivity biomarkers were identified by performing an association analysis between gene expression levels and post-treatment tumor volume changes in PDX models. We built a drug response prediction model (called PDXGEM) in a random-forest algorithm by using a subset of the drug sensitvity biomarkers with concordant co-expression patterns between the PDXs and pretreatment cancer patient tumors. We applied the PDXGEM to several cytotoxic chemotherapies as well as targeted therapy agents that are used to treat breast cancer, pancreatic cancer, colorectal cancer, or non-small cell lung cancer. Significantly accurate predictions of PDXGEM for pathological response or survival outcomes were observed in extensive independent validations on multiple cancer patient datasets obtained from retrospective observational studies and prospective clinical trials.

Conclusion: Our results demonstrated the strong potential of using molecular profiles and drug activity data of PDX tumors in developing a clinically translatable predictive cancer biomarkers for cancer patients. The PDXGEM web application is publicly available at http://pdxgem.moffitt.org .

Keywords: Chemotherapy; Drug response prediction; Gene expression; PDX; Patient-derived xenograft model; Predictive cancer biomarker; Targeted therapy.


Conflict of interest statement

The authors declare that they have no competing interests.

Figures

Fig. 1
Fig. 1
Schema of the patient-derived xenograft based gene expression model (PDXGEM). a In the drug sensitivity gene discovery step, correlation analysis and differential expression analysis of gene expression data and drug-activity data in patient-derived xenograft (PDX) tumors are conducted. b Concordant co-expression analysis identifies a drug sensitivity gene (g1) that is concordantly co-expressed with 3 other genes (g2, g3, and g4) between PDX tumors and pretreatment cancer patients’ tumors. c A multi-gene expression model of drug response is trained on PDX data using the random-forest algorithm. d The performance of the multi-gene expression model is validated by contrasting prediction scores between the responsive (R) and the non-responsive (NR) patients to a drug in cancer patient cohort
Fig. 2
Fig. 2
Development of PDXGEM for paclitaxel response prediction in breast cancer patient. a Volcano plot with log2 fold change of differential gene expressions (x-axis) in paclitaxel-sensitive and paclitaxel-resistant patient-derived xenograft (PDX) models and –log10P-value (y-axis). Black dots display the initial drug sensitivity probesets and red circles further indicate concordantly co-expressed biomarkers between the PDX models and breast cancer patients. b Clustering heatmap depicts correlation matrices of drug sensitivity genes in PDX models (left panel) and pretreatment cancer patients (right panel) before (top panel) and after (bottom panel) concordant co-expression. c The Pearson’s correlation coefficient between observed percent change in PDX tumor volumes (x-axis) and PDXGEM prediction scores for breast cancer PDX models (y-axis) was 0.982. d Receiver-operating characteristics curves of paclitaxel PDXGEM on seven different breast cancer data sets
Fig. 3
Fig. 3
PDXGEM prediction scores for trastuzumab in breast cancer patients by HER2 status. Distributional plot of PDXGEM prediction scores between patients with pathological complete response (pCR) and patients with residual of disease (RD) after receiving trastuzumab (a) in HER2 positive breast cancer patients, (b) in HER2 positive breast cancer patients who did not receive trastuzumab but did receive other chemotherapy and (c) HER2 negative breast cancer patients who did not receive Trastuzumab. Red center lines represent the mean of prediction scores
Fig. 4
Fig. 4
PDXGEM for gemcitabine in pancreatic cancer patients. a-d Kaplan-Meier curves of overall survival between pancreatic cancer patients with a higher (gray) and lower (black) PDXGEM score than the median prediction score in (a) GSE57495, (b) M-MEXP-2780, (c) GSE17891, and (d) ICGC cohort. P-value was calculated using log-rank test
Fig. 5
Fig. 5
PDXGEM for 5FU response prediction in colorectal cancer patients. a Distribution of PDXGEM scores (Y-axis) between responsive and non-responsive patients after at a treatment with 5FU-based chemotherapy. b-d Kaplan-Meier curves of overall survival for the high (dotted gray), intermediate (gray), and low (black) score group in (b) primary colorectal cancer (CRC) patients receiving 5-FU monotherapy in GSE39581 (c), and metastatic CRC patients receiving FOLFIRI monotherapy in GSE39581 (d) and primary CRC patients receiving FOLFIRI in GSE39581. Prediction scores were broken down at their tertiles. The P value was calculated using a survival trend test. e Distribution of PDXGEM scores (y-axis) of CRC patients who did not received 5-FU. The P value was calculated using Tarone’s trend test
Fig. 6
Fig. 6
PDXGEM prediction for response to Cetuximab in metastatic colorectal cancer patient. a Distribution of PDXGEM scores (y-axis) is compared between metastatic colorectal cancer patients with complete response (CR) or partial response (PR) and those with stable of disease (SD) or progressive disease (PD) after treatment with cetuximab. Blue and red dots are subjects with or without positive epidermal growth factor receptor (EGFR) expression, respectively. b PDXGEM scores stratified by KRAS mutation status. c Kaplan-Meier curves of overall survival in metastatic colorectal cancer patients who did not receive cetuximab
Fig. 7
Fig. 7
PDXGEM prediction for response to erlotinib in non-small cell lung cancer (NSCLC) patient. PDXGEM scores (a) between erlotinib-sensitive and erlotinib-resistant NSCLC cell lines, and (b) between the NSCLC patients who were responsive and those who were nonresponsive to erlotinib in the first line setting (c) Progression-free survival curves in metastatic NSCLC patients who receive erlotinib as the second-line treatment setting

References

    1. Fisher R, Pusztai L, Swanton C. Cancer heterogeneity: implications for targeted therapeutics. Br J Cancer. 2013;108:479–485. - PMC - PubMed
    1. Rupp T, Zuckerman D. Quality of life, overall survival, and costs of Cancer drugs approved based on surrogate endpoints. JAMA Intern Med. 2017;177:276–277. - PubMed
    1. Zou J, Wang E. Cancer biomarker discovery for precision medicine: new progresses. Curr Med Chem. 2018;26:7655–7671. - PubMed
    1. Goossens N, Nakagawa S, Sun X, Hoshida Y. Cancer biomarker discovery and validation. Transl Cancer Res. 2015;4:256–269. - PMC - PubMed
    1. Boyd MR. In: The NCI in vitro anticancer drug discovery screen. in anticancer drug development guide: preclinical screening, clinical trials, and approval. Teicher BA, editor. Totowa: Humana Press; 1997. pp. 23–42.

Substances