Human translatability of the GAN diet-induced obese mouse model of non-alcoholic steatohepatitis
- PMID: 32631250
- PMCID: PMC7336447
- DOI: 10.1186/s12876-020-01356-2
Human translatability of the GAN diet-induced obese mouse model of non-alcoholic steatohepatitis
Abstract
Background: Animal models of non-alcoholic steatohepatitis (NASH) are important tools in preclinical research and drug discovery. Gubra-Amylin NASH (GAN) diet-induced obese (DIO) mice represent a model of fibrosing NASH. The present study directly assessed the clinical translatability of the model by head-to-head comparison of liver biopsy histological and transcriptome changes in GAN DIO-NASH mouse and human NASH patients.
Methods: C57Bl/6 J mice were fed chow or the GAN diet rich in saturated fat (40%), fructose (22%) and cholesterol (2%) for ≥38 weeks. Metabolic parameters as well as plasma and liver biomarkers were assessed. Liver biopsy histology and transcriptome signatures were compared to samples from human lean individuals and patients diagnosed with NASH.
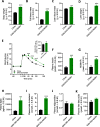
Results: Liver lesions in GAN DIO-NASH mice showed similar morphological characteristics compared to the NASH patient validation set, including macrosteatosis, lobular inflammation, hepatocyte ballooning degeneration and periportal/perisinusoidal fibrosis. Histomorphometric analysis indicated comparable increases in markers of hepatic lipid accumulation, inflammation and collagen deposition in GAN DIO-NASH mice and NASH patient samples. Liver biopsies from GAN DIO-NASH mice and NASH patients showed comparable dynamics in several gene expression pathways involved in NASH pathogenesis. Consistent with the clinical features of NASH, GAN DIO-NASH mice demonstrated key components of the metabolic syndrome, including obesity and impaired glucose tolerance.
Conclusions: The GAN DIO-NASH mouse model demonstrates good clinical translatability with respect to the histopathological, transcriptional and metabolic aspects of the human disease, highlighting the suitability of the GAN DIO-NASH mouse model for identifying therapeutic targets and characterizing novel drug therapies for NASH.
Keywords: Diet-induced obesity; Glucose tolerance; Histomorphometry; Histopathology; Liver transcriptome; Mouse model; Non-alcoholic steatohepatitis; Translatability.
Conflict of interest statement
HHH, HMÆ, DO, SE, AB, SSV, MF and KTGR are employed by Gubra; NV and JJ are owners of Gubra; DM and JLT are employed by Gilead Sciences; SH, PLE, KLT, MPS, FKK and HG declare no competing interests.
Figures


References
-
- Younossi ZM, Golabi P, de Avila L, Paik JM, Srishord M, Fukui N, et al. The global epidemiology of NAFLD and NASH in patients with type 2 diabetes: a systematic review and meta-analysis. J Hepatol. 2019;71:793–801. - PubMed
-
- Buzzetti E, Pinzani M, Tsochatzis EA. The multiple-hit pathogenesis of non-alcoholic fatty liver disease (NAFLD) Metabolism. 2016;65:1038–1048. - PubMed
-
- Hansen H, Hansen G, Secher T, Feigh M, Veidal S, Fosgerau K, et al. Animal models of type 2 diabetes, obesity and nonalcoholic steatohepatitis – clinical translatability and applicability in preclinical drug development. In: Krentz A, Weyer C, Hompesch M, et al., editors. Translational Research Methods in Diabetes, Obesity, and Nonalcoholic Fatty Liver Disease. 2. Cham: Springer; 2019. pp. 369–403.
MeSH terms
Grants and funding
LinkOut - more resources
Full Text Sources
Other Literature Sources
Medical

