. 2020 Aug 28;40(18):e00189-20.
doi: 10.1128/MCB.00189-20. Print 2020 Aug 28.

Janus Kinase Mutations in Mice Lacking PU.1 and Spi-B Drive B Cell Leukemia through Reactive Oxygen Species-Induced DNA Damage

Affiliations

Janus Kinase Mutations in Mice Lacking PU.1 and Spi-B Drive B Cell Leukemia through Reactive Oxygen Species-Induced DNA Damage

Michelle Lim et al. Mol Cell Biol. .

Abstract

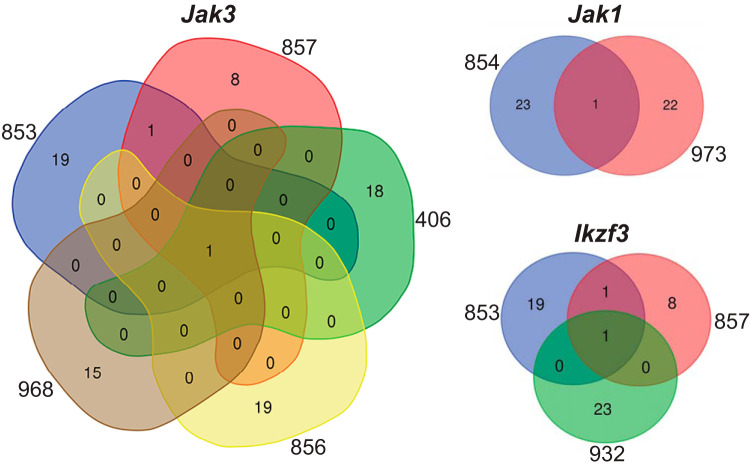
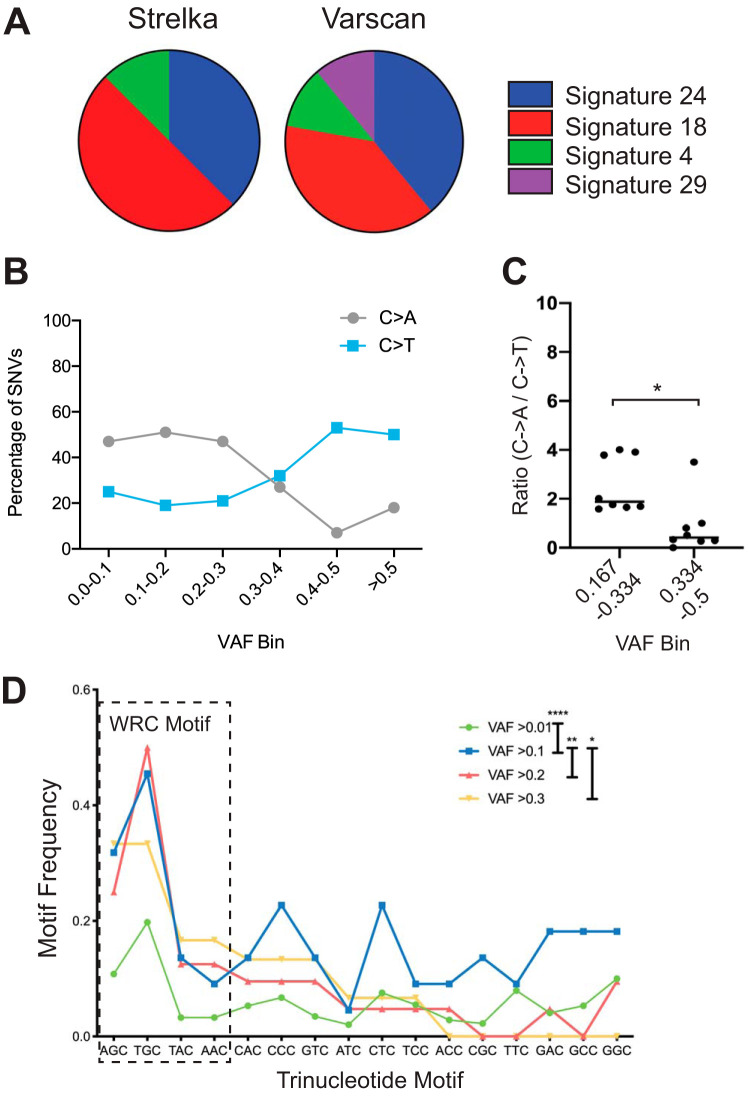
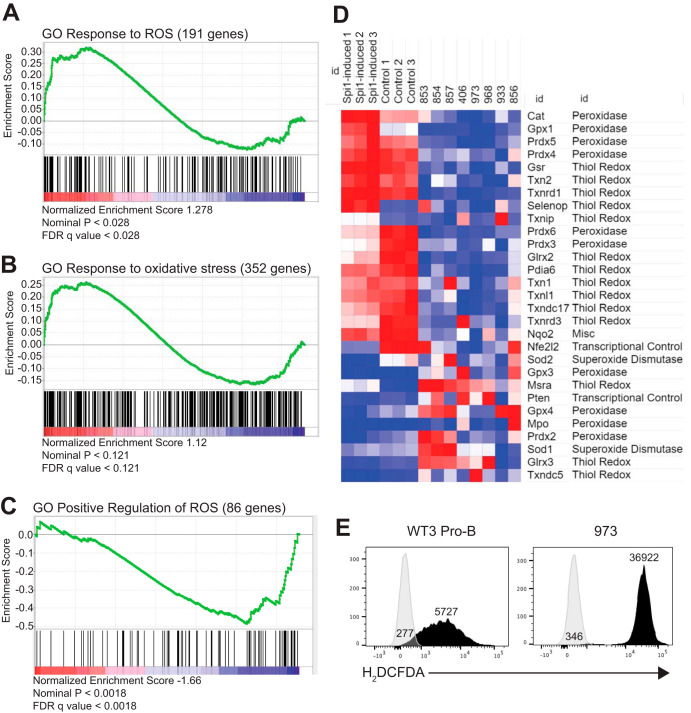
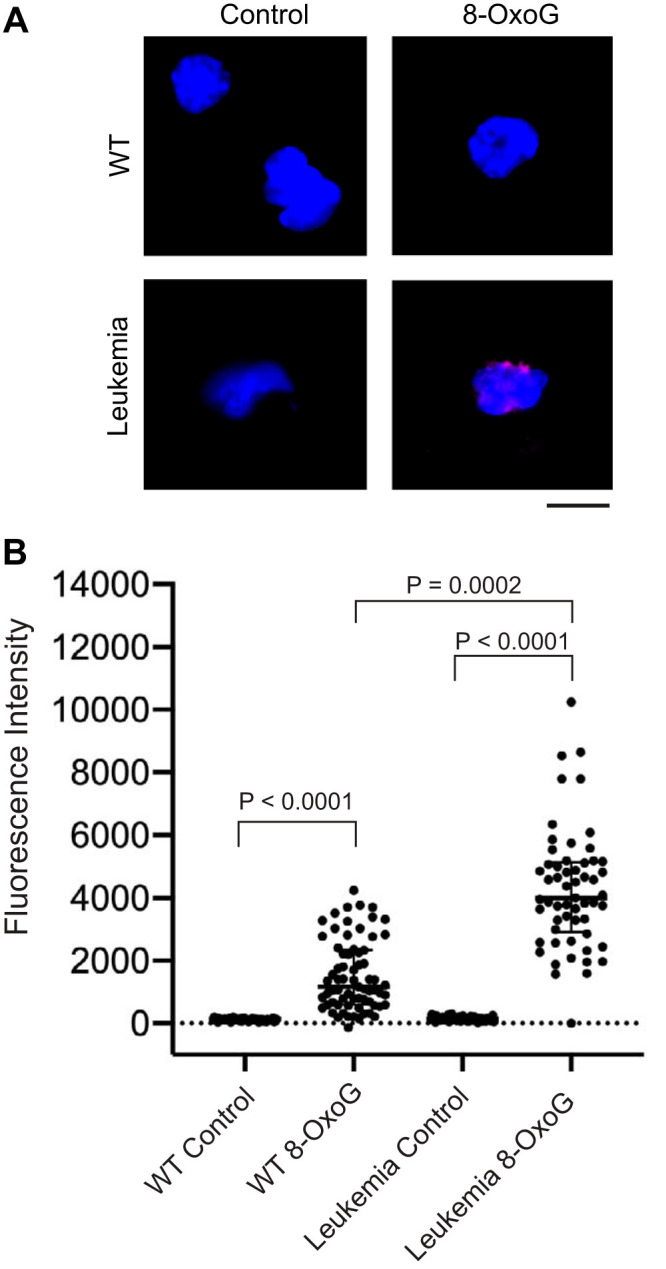
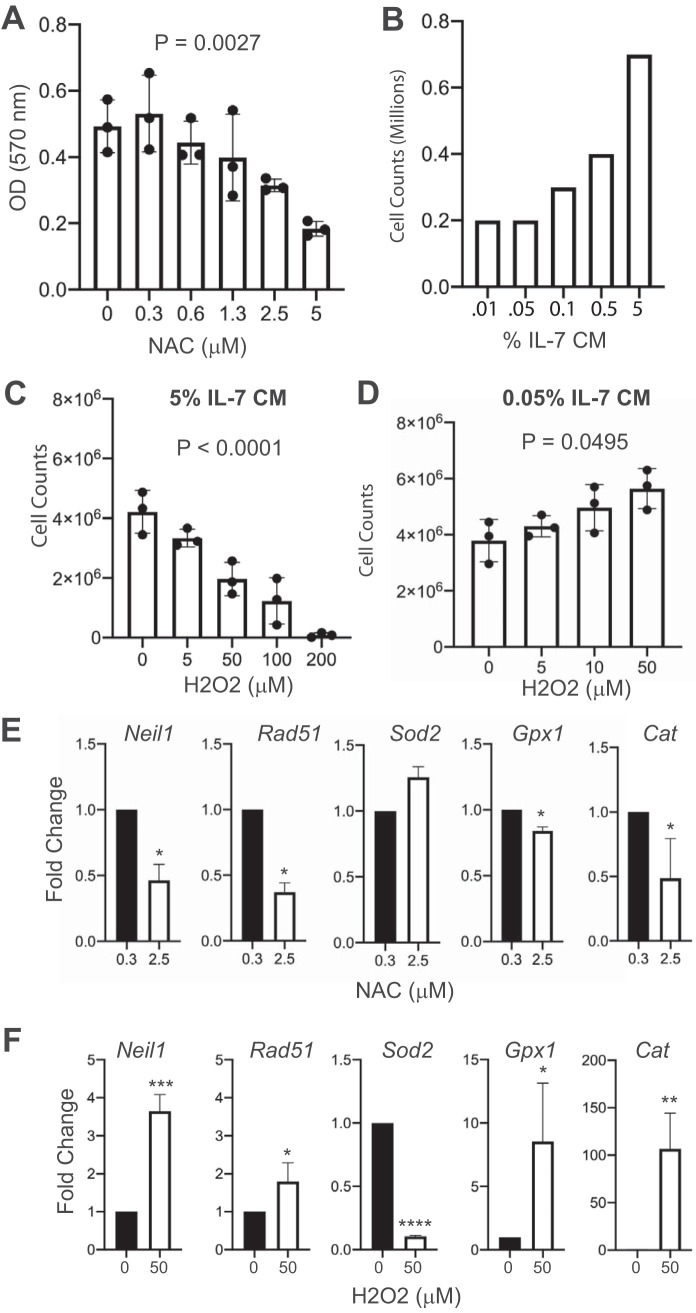
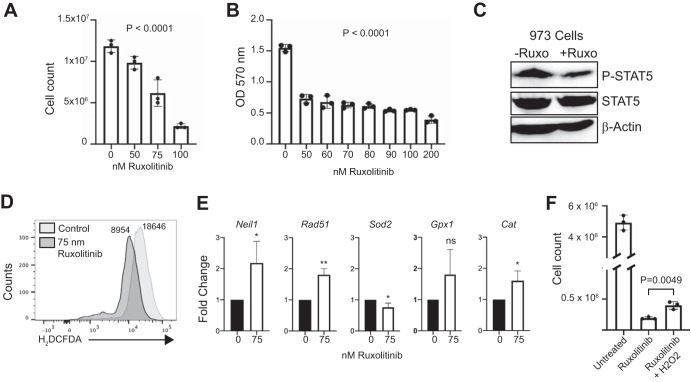
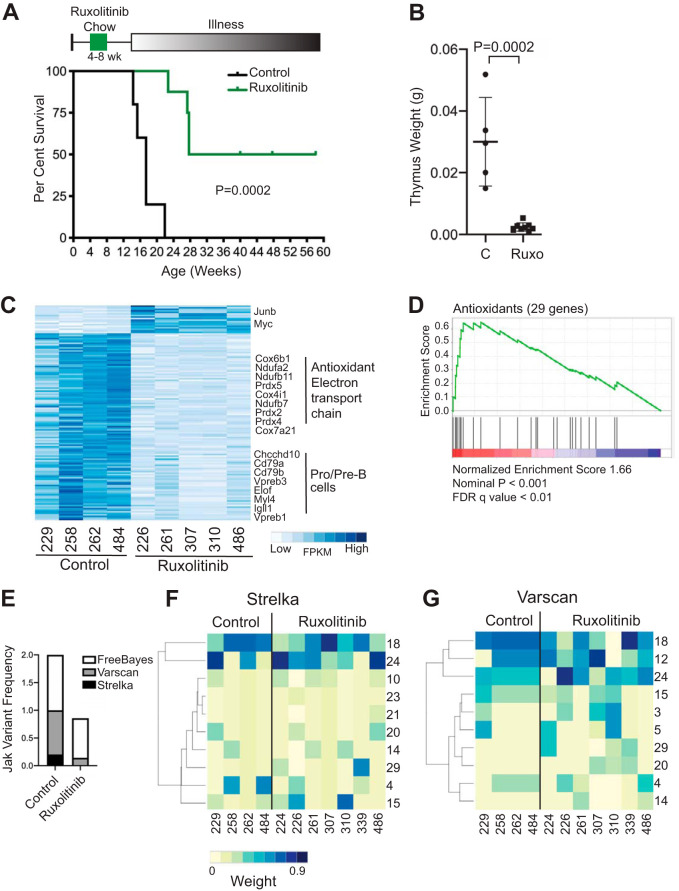
Precursor B cell acute lymphoblastic leukemia (B-ALL) is caused by genetic lesions in developing B cells that function as drivers for the accumulation of additional mutations in an evolutionary selection process. We investigated secondary drivers of leukemogenesis in a mouse model of B-ALL driven by PU.1/Spi-B deletion (Mb1-CreΔPB). Whole-exome-sequencing analysis revealed recurrent mutations in Jak3 (encoding Janus kinase 3), Jak1, and Ikzf3 (encoding Aiolos). Mutations with a high variant-allele frequency (VAF) were dominated by C→T transition mutations that were compatible with activation-induced cytidine deaminase, whereas the majority of mutations, with a low VAF, were dominated by C→A transversions associated with 8-oxoguanine DNA damage caused by reactive oxygen species (ROS). The Janus kinase (JAK) inhibitor ruxolitinib delayed leukemia onset, reduced ROS and ROS-induced gene expression signatures, and altered ROS-induced mutational signatures. These results reveal that JAK mutations can alter the course of leukemia clonal evolution through ROS-induced DNA damage.

Keywords: ETS transcription factors; PU.1; Spi-B; gene regulation; leukemia; reactive oxygen species; transcription factors.


Figures

FIG 1
FIG 1
Venn diagrams showing overlap in gene variants between exome sequences. Numbers outside colored shapes indicate sequenced leukemia exomes. Numbers inside colored shapes indicate numbers of variants called by three variant callers.
FIG 2
FIG 2
Evidence for distinct mutational processes. (A) Frequencies of mutational signatures. The pie chart shows frequencies of top mutational signatures for each of 8 leukemias analyzed by the indicated mutation caller. (B) Frequencies (percentages) of C→A transversions compared to C→T transitions in each of 6 VAF bins. (C) The ratios of C→A transversions to C→T transitions are lower at high VAF (0.334 to 0.5) than at low VAF (0.167 to 0.334) (n = 8; unpaired t test; *, P < 0.01). (D) Variants are enriched for WRC (A/T, A/G, C) motifs at high VAF frequency compared to their enrichment at low VAF frequency (repeated-measures one-way analysis of variance [ANOVA]; *, P < 0.05; **, P < 0.01; ****, P < 0.0001).
FIG 3
FIG 3
Gene expression analysis of leukemias reveals altered responses to reactive oxygen species. (A to C) Gene set enrichment analysis revealed positive association with “GO response to ROS” (191 genes) (A) and “GO response to oxidative stress” (352 genes) (B) and negative association with “GO positive regulation of ROS” (86 genes) (C). FDR, false discovery rate. (D) Heat map of antioxidant gene expression in PU.1-induced i660BM cells (Spi1-induced 1 to 3), uninduced i660BM cells (Control 1 to 3), and individual leukemia samples. Gene names and functions are indicated on the right. Red indicates increased expression; blue indicates decreased expression. (E) ROS levels detected by H2DCFDA staining and flow cytometry in cultured wild-type pro-B cells (WT3 Pro-B) and leukemia 973 cells (973). Numbers indicate mean fluorescence intensities (MFI).
FIG 4
FIG 4
8-Oxoguanine staining in wild-type fetal-liver-derived pro-B cells compared to short-term-cultured leukemia cells. (A) Images of representative nuclei. Shown are overlaid images of DAPI-stained intact nuclei (blue) and anti-8-OxoG antibody (red) from pro-B cells (WT) and leukemia cells (Leukemia). Staining was performed as described in Materials and Methods. The scale bar indicates 10 μm. (B) Quantification of 8-OxoG staining in intact nuclei. Dots indicate nuclei of individual cells visualized from wild-type pro-B cells (WT; control = 58 nuclei, 8-OxoG = 69 nuclei) or short-term-cultured Mb1-CreΔPB leukemia cells (Leukemia; control = 56 nuclei, 8-OxoG = 57 nuclei). Cells were stained with secondary antibody only (Control) or with anti-8-OxoG antibody and secondary antibody (8-OxoG). Statistics were determined by Kruskal-Wallis with post hoc Dunn’s test.
FIG 5
FIG 5
Effects of antioxidant N-acetylcysteine and prooxidant hydrogen peroxide on cell proliferation and gene expression of cultured leukemia cells. (A) N-Acetylcysteine (NAC) treatment reduces cell counts of cultured 973 cells in a dose-dependent manner. MTT assays were performed, and the absorbance was determined. Zero indicates vehicle control. OD, optical density. (B) Dose-response of cultured pro-B cells to interleukin-7. % IL CM, percentage of IL-7 in conditioned medium. (C) Hydrogen peroxide (H2O2) reduces cell counts of cultured 973 cells in a dose-dependent manner. Experiment was performed using 5% IL-7-conditioned medium. (D) Under low-IL-7 conditions, H2O2 increases cell counts of cultured 973 cells in a dose-dependent manner. The experiment was performed using 0.5% IL-7-conditioned medium. P value was determined by ordinary one-way ANOVA of biological replicate (n = 3) experiments. (E, F) Gene expression analysis. RT-qPCR was performed to determine relative fold changes in the indicated mRNA transcripts after 24 h of culture with NAC (D) or H2O2 (E). Statistical analysis was performed using one-sample t and Wilcoxon tests (n = 5 biological replicate experiments). Error bars indicate standard errors of the means. *, P < 0.05; **, P < 0.01; ***; P < 0.001, ****, P < 0.0001.
FIG 6
FIG 6
Effects of ruxolitinib on cell proliferation, gene expression, and reactive oxygen species. (A, B) Ruxolitinib treatment reduces cell counts of cultured 973 cells in a dose-dependent manner. Cell-counting assays (A) or MTT assays (B) were performed. A concentration of 0 indicates the vehicle control. (B) Absorbance. The P value was determined by one-way ANOVA of biological replicate (n = 3) experiments. (C) Reduced STAT5 phosphorylation in ruxolitinib-treated 973 cells. Anti-phosphorylated-STAT5 antibody (P-Stat5) or total STAT5 immunoblotting was performed on 973 cells treated with 75 nM ruxolitinib for 24 h. (D) Reduced ROS in 973 cells treated for 24 h with ruxolitinib, as determined by H2DCFDA staining. Numbers indicate mean fluorescence intensities. (E) Gene expression analysis. RT-qPCR was performed to determine relative fold changes in the indicated mRNA transcripts after 24 h of culture with ruxolitinib. Statistical analysis was performed by one-sample t and Wilcoxon tests (n = 5 biological replicate experiments). Error bars indicate standard errors of the means. *, P < 0.05; **, P < 0.01; ns, not significant. (F) H2O2 partially rescues suppressed 973 cell counts induced by ruxolitinib. 973 cells were cultured for 3 days with 75 nM ruxolitinib with or without 50 μM H2O2.
FIG 7
FIG 7
Effects of ruxolitinib on Mb1-CreΔPB mouse survival, leukemia gene expression, and mutational signatures. (A) Bottom, survival of Mb1-CreΔPB mice after being fed control (n = 5) or ruxolitinib (n = 8) mouse chow for 4 weeks. Top, schematic of ruxolitinib mouse chow experiment. Statistical significance of the Kaplan-Meier curve was determined using the log rank (Mantel-Cox) test. (B) Reduced thymus weights at euthanasia in Mb1-CreΔPB mice fed with control or ruxolitinib (Ruxo) chow between 4 and 8 weeks of age. Horizontal bars and error bars represent mean values ± standard deviations. Statistical significance was determined using an unpaired t test (n = 5 control mice, n = 8 ruxolitinib-treated mice). (C) Heat map of gene expression in Mb1-CreΔPB mice fed with control or ruxolitinib chow between 4 and 8 weeks of age. The heat map shows FPKM of genes found to be differentially expressed by DESeq2 (adjusted P value, <0.05). (D) Gene set enrichment analysis of RNA-seq analysis using the antioxidant gene set shown in Fig. 3D. (E) Reduced frequencies of Jak1–3 variants in leukemias from mice fed with ruxolitinib chow between 4 and 8 weeks of age compared to the frequencies in leukemias from mice fed with control chow. Shown is a stacked bar graph showing the added frequencies of mice with Jak1–3 variants detected by three independent variant callers. (F, G) Heat maps of mutational signatures in leukemias from Mb1-CreΔPB mice fed with control or ruxolitinib chow between 4 and 8 weeks of age. Colors indicate weights of mutational signatures called by Strelka (F) or Varscan2 (G) for WES results of leukemias.

Similar articles

Cited by

References

    1. Iacobucci I, Mullighan CG. 2017. Genetic basis of acute lymphoblastic leukemia. J Clin Oncol 35:975–983. doi:10.1200/JCO.2016.70.7836. - DOI - PMC - PubMed
    1. Roberts KG, Mullighan CG. 2015. Genomics in acute lymphoblastic leukaemia: insights and treatment implications. Nat Rev Clin Oncol 12:344–357. doi:10.1038/nrclinonc.2015.38. - DOI - PubMed
    1. Roberts KG, Yang Y-L, Payne-Turner D, Lin W, Files JK, Dickerson K, Gu Z, Taunton J, Janke LJ, Chen T, Loh ML, Hunger SP, Mullighan CG. 2017. Oncogenic role and therapeutic targeting of ABL-class and JAK-STAT activating kinase alterations in Ph-like ALL. Blood Adv 1:1657–1671. - PMC - PubMed
    1. Greaves M, Maley CC. 2012. Clonal evolution in cancer. Nature 481:306–313. doi:10.1038/nature10762. - DOI - PMC - PubMed
    1. Swaminathan S, Klemm L, Park E, Papaemmanuil E, Ford A, Kweon SM, Trageser D, Hasselfeld B, Henke N, Mooster J, Geng H, Schwarz K, Kogan SC, Casellas R, Schatz DG, Lieber MR, Greaves MF, Muschen M. 2015. Mechanisms of clonal evolution in childhood acute lymphoblastic leukemia. Nat Immunol 16:766–774. doi:10.1038/ni.3160. - DOI - PMC - PubMed

Publication types

MeSH terms

Grants and funding

LinkOut - more resources