Practice Guideline
. 2020 Jul;7(1):e000575.
doi: 10.1136/bmjresp-2020-000575.

ARTP statement on pulmonary function testing 2020

Affiliations
Practice Guideline

ARTP statement on pulmonary function testing 2020

Karl Peter Sylvester et al. BMJ Open Respir Res. 2020 Jul.

Abstract

The Association for Respiratory Technology & Physiology (ARTP) last produced a statement on the performance of lung function testing in 1994. At that time the focus was on a practical statement for people working in lung function laboratories. Since that time there have been many technological advances and alterations to best practice in the measurement and interpretation of lung function assessments. In light of these advances an update was warranted. ARTP, therefore, have provided within this document, where available, the most up-to-date and evidence-based recommendations for the most common lung function assessments performed in laboratories across the UK. These recommendations set out the requirements and considerations that need to be made in terms of environmental and patient factors that may influence both the performance and interpretation of lung function tests. They also incorporate procedures to ensure quality assured diagnostic investigations that include those associated with equipment, the healthcare professional conducting the assessments and the results achieved by the subject. Each section aims to outline the common parameters provided for each investigation, a brief principle behind the measurements (where applicable), and suggested acceptability and reproducibility criteria.

Keywords: lung physiology; respiratory measurement; respiratory muscles.


Conflict of interest statement

Competing interests: None declared.

Figures

Figure 1
Figure 1
Plot of idealised population data for FEV1 in men. The left panel shows a plot of FEV1 against age (in years) for men of height 1.77 m and on the right a plot against height (in metres) for men aged 50 years. Source: Professor MR Miller. FEV1, forced expiratory volume in 1 s.
Figure 2
Figure 2
Plot of idealised population data for FEV1: standardised residual (SR). FEV1 is plotted against age for men of height 1.77 m with a subject’s value O and their predicted value P outlined. The sloping line denotes the predicted values against age. Thus, FEV1SR=(observed FEV1−predicted FEV1)/RSD, where RSD is the residual SD taken from the healthy population used to make the prediction. Source: Professor MR Miller. FEV1, forced expiratory volume in 1 s.
Figure 3
Figure 3
Plot of idealised population data for FEV1: 80% predicted and LLN. FEV1 is plotted against age for men of height 1.77 m showing a thin line representing 80% of the predicted (pred) value and a thick line showing the true lower limit of normal (LLN), that is, the fifth centile value 25–70 years. Source: Professor MR Miller. FEV1, forced expiratory volume in 1 s.
Figure 4
Figure 4
Plot of idealised population data for TLC against height for men. The thin line represents 80% and 120% of the predicted (pred) value, and the thick line shows the true lower limit of normal (LLN) and the upper limit of normal (ULN), that is, the 5th and 95th centile values. Source: Professor MR Miller. TLC, total lung capacity.
Figure 5
Figure 5
A plot of FEV1/FVC against age. On the left are data for 4991 men and on the right for 5811 women. The horizontal line shows the 0.7 cut-off and the slanting line is the LLN. The points above both these lines are within the accepted range for both criteria. The points below both lines are abnormal by both criteria. The dark closed circles between the lines to the right of each plot are the points positive for airflow limitation by 0.7 but not by LLN (false positives). The open circles between the two lines to the left of each plot are abnormal by LLN but not by 0.7 (false negatives). Source: Professor MR Miller from the Health Survey for England 2001 data. FEV1, forced expiratory volume in 1 s; FVC, forced vital capacity; LLN, lower limit of normal.
Figure 6
Figure 6
Examples of spirometry errors. The blue line is the ideal curve and the red line(s) the erroneous curves. Source: ARTP Spirometry Handbook.
Figure 7
Figure 7
Static lung volumes shown on a volume versus time spirogram. The blue line is the ideal curve and the red line(s) the erroneous curves. Source: ARTP Spirometry Handbook. BTPS, body temperature and pressure saturated.
Figure 8
Figure 8
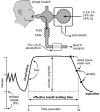
Body plethysmographic method for lung volume estimation. Body plethysmograph (body box) for measuring thoracic gas volume (VL). The subject (in B) relaxes at end–expiration (~FRC) with PMOUTH=PALV=PBOX=Patmospheric (Pb). The shutter (see A) is closed in C, and the subject pants slowly and gently; on inspiration VL is rarefied and increases by ºΔV, PMOUTH falls and PBOX rises (box gas is compressed by + ΔV lung). ΔPBOX is plotted against ΔPMOUTH. Subsequently, the shutter opens and inspiratory capacity is measured using the pneumotachograph signal (see A). Note calibrating signal for assessing ΔPBOX in terms of ΔVbox. Reproduced from Hughes, ‘Physiology and Practice of Pulmonary Function’ published by the Association for Respiratory Technology & Physiology. FRC, functional residual capacity; PALV, alveolar pressure; PBOX, barometric pressure; PMOUTH, mouth pressure.
Figure 9
Figure 9
Effect of incorrect panting technique on plethysmograph trace. (A) Gentle, properly performed panting manoeuvre yielding a series of almost superimposed straight lines. (B) Panting with excessive force leading to hysteresis. (C) Grossly excessive panting manoeuvre yielding large, variable, invalid recording. (D) Demonstrates the effects of a leaking box seal.
Figure 10
Figure 10
Volume correction must be applied to TGV to determine FRCPLETH. FRC, functional residual capacity measured by whole body plethysmography; TGV, thoracic gas volume.
Figure 11
Figure 11
Calculation of functional residual capacity (FRC): breath by breath method.
Figure 12
Figure 12
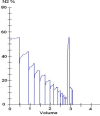
(Left) Normal washout profile. (Right) Abnormal washout profile typical of emphysema.
Figure 13
Figure 13
Nitrogen washout profile demonstrating a leak.
Figure 14
Figure 14
Calculation of FRC: helium (He) dilution method. Closed circuit for He equilibration and calculation of thoracic gas volume and FRCHe. System volume includes spirometer and all tubing and so on, up to the valve in the mouth, and is filled initially with 10% He. Because of CO2 absorption and O2 consumption, spirometric trace has rising baseline, made horizontal by continuous O2 addition. Time course of He equilibration and in normal and in patient with chronic obstructive pulmonary disease (COPD) shown. Reproduced from Hughes, ‘Physiology and Practice of Pulmonary Function’, published by the Association for Respiratory Technology & Physiology. FRC, functional residual capacity; IC, inspiratory capacity; TLC, total lung capacity.
Figure 15
Figure 15
Effects of lung volume on both the TLco and the Kco from residual volume to TLC. Kco, gas transfer coefficient for carbon monoxide; RV, residual volume; TLC, total lung capacity; TLco, carbon monoxide transfer factor.
Figure 16
Figure 16
A technically acceptable TLco trace. Reproduced from Hughes, ‘Physiology and Practice of Pulmonary Function’, published by the Association for Respiratory Technology & Physiology. TLco, carbon monoxide transfer factor. FACO, Fraction of Carbon Monoxide in Alveolar Gas. FAHE, Fraction of Helium in Alveolar Gas.
Figure 17
Figure 17
Acid-base nomogram. PCO2, partial pressure of carbon dioxide.
Figure 18
Figure 18
Maximum static mouth pressure traces. Mouth pressure versus time during maximal expiratory and inspiratory manoeuvres against an obstructed mouthpiece. Maximum pressure is sustained for approximately 3 s. PEmax and PImax measured as mean pressure over 1 s around peak pressure. Adapted from the American Thoracic Society/European Respiratory Society statement, 2002.Reproduced from Hughes, ‘Physiology and Practice of Pulmonary Function’, published by the Association for Respiratory Technology & Physiology. PEmax, maximal static expiratory pressure; PImax, maximal static inspiratory pressure; RV, residual volume; TLC, total lung capacity.
Figure 19
Figure 19
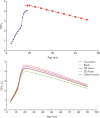
A comparison of reference equations. (Top) An amalgamation of the Rosenthal (paediatric) and the European Community for Coal and Steel (adult) equations. (Bottom) The multiethnic Global Lung Initiative equations. Source: ARTP Practical Handbook of Spirometry. FEV1, forced expiratory volume in 1 s.

Comment in

  • ARTP statement on pulmonary function testing.
    Cooper BG, Hull JH, Lloyd JK. Cooper BG, et al. BMJ Open Respir Res. 2020 Jul;7(1):e000664. doi: 10.1136/bmjresp-2020-000664. BMJ Open Respir Res. 2020. PMID: 32631928 Free PMC article. No abstract available.

References

    1. BTS/ARTP Guidelines for the measurement of respiratory function. recommendations of the British thoracic Society and the association of respiratory technicians and Physiologists. Respir Med 1994;88:165–94. - PubMed
    1. Miller MR, Crapo R, Hankinson J, et al. . General considerations for lung function testing. Eur Respir J 2005;26:153–61. 10.1183/09031936.05.00034505 - DOI - PubMed
    1. Miller MR, Hankinson J, Brusasco V, et al. . Standardisation of spirometry. Eur Respir J 2005;26:319–38. 10.1183/09031936.05.00034805 - DOI - PubMed
    1. Wanger J, Clausen JL, Coates A, et al. . Standardisation of the measurement of lung volumes. Eur Respir J 2005;26:511–22. 10.1183/09031936.05.00035005 - DOI - PubMed
    1. Pellegrino R, Viegi G, Brusasco V, et al. . Interpretative strategies for lung function tests. Eur Respir J 2005;26:948–68. 10.1183/09031936.05.00035205 - DOI - PubMed

Publication types