. 2020 Sep;75(9):780-790.
doi: 10.1136/thoraxjnl-2019-214187. Epub 2020 Jul 6.

Maintenance tobramycin primarily affects untargeted bacteria in the CF sputum microbiome

Affiliations

Maintenance tobramycin primarily affects untargeted bacteria in the CF sputum microbiome

Maria T Nelson et al. Thorax. 2020 Sep.

Erratum in

Abstract

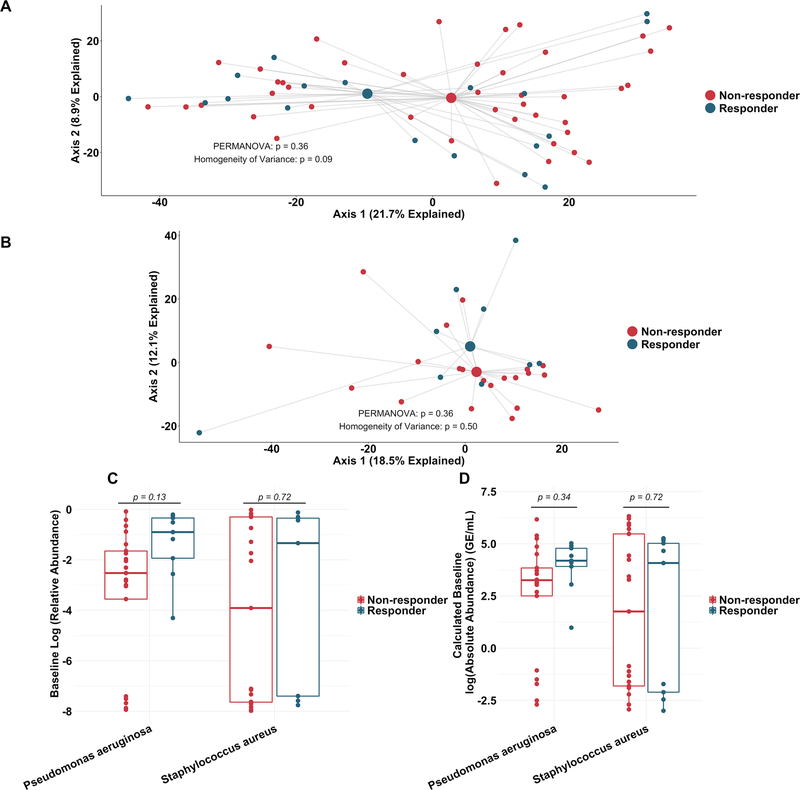
Rationale: The most common antibiotic used to treat people with cystic fibrosis (PWCF) is inhaled tobramycin, administered as maintenance therapy for chronic Pseudomonas aeruginosa lung infections. While the effects of inhaled tobramycin on P. aeruginosa abundance and lung function diminish with continued therapy, this maintenance treatment is known to improve long-term outcomes, underscoring how little is known about why antibiotics work in CF infections, what their effects are on complex CF sputum microbiomes and how to improve these treatments.

Objectives: To rigorously define the effect of maintenance tobramycin on CF sputum microbiome characteristics.

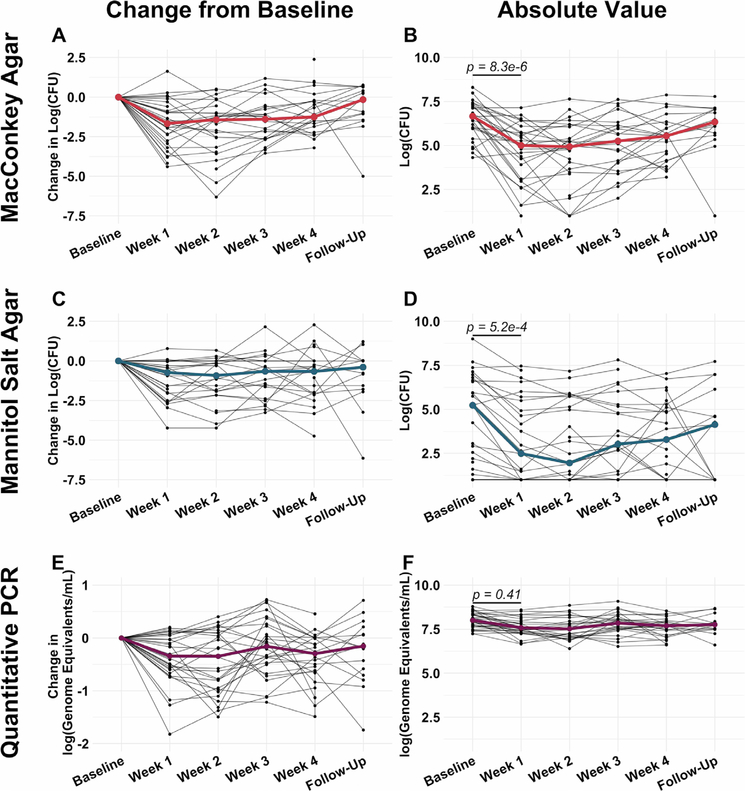
Methods and measurements: We collected sputum from 30 PWCF at standardised times before, during and after a single month-long course of maintenance inhaled tobramycin. We used traditional culture, quantitative PCR and metagenomic sequencing to define the dynamic effects of this treatment on sputum microbiomes, including abundance changes in both clinically targeted and untargeted bacteria, as well as functional gene categories.

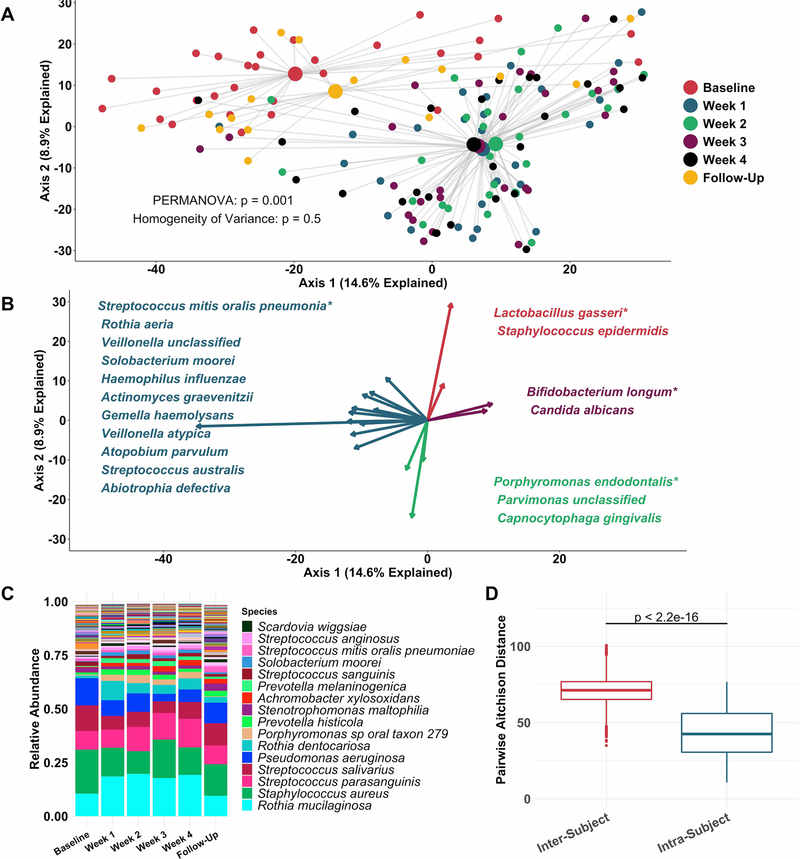
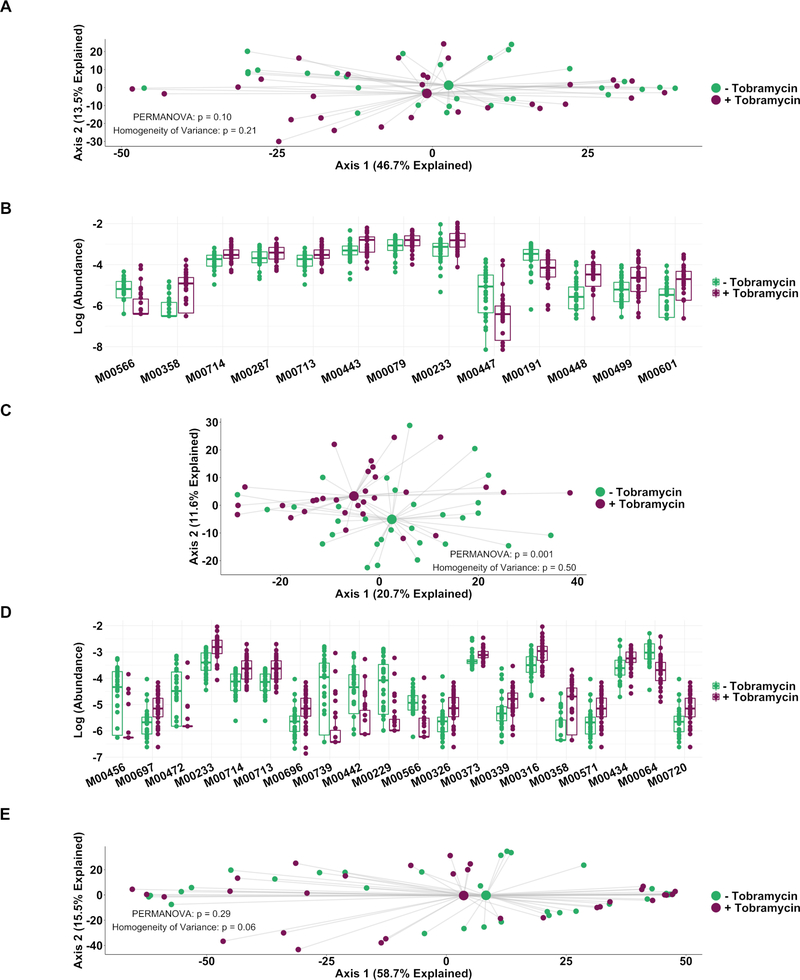
Main results: CF sputum microbiota changed most markedly by 1 week of antibiotic therapy and plateaued thereafter, and this shift was largely driven by changes in non-dominant taxa. The genetically conferred functional capacities (ie, metagenomes) of subjects' sputum communities changed little with antibiotic perturbation, despite taxonomic shifts, suggesting functional redundancy within the CF sputum microbiome.

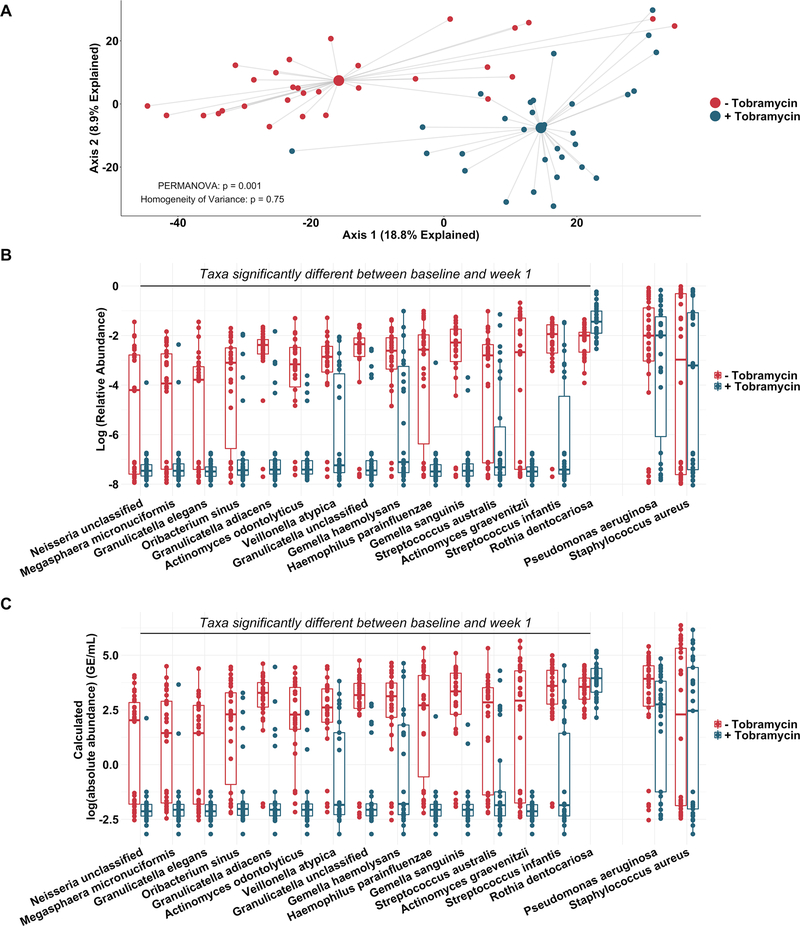
Conclusions: Maintenance treatment with inhaled tobramycin, an antibiotic with demonstrated long-term mortality benefit, primarily impacted clinically untargeted bacteria in CF sputum, highlighting the importance of monitoring the non-canonical effects of antibiotics and other treatments to accurately define and improve their clinical impact.

Keywords: bacterial infection; cystic fibrosis; respiratory infection.


Conflict of interest statement

Competing interests: None declared.

Figures

Figure 1
Figure 1
Intersubject variability of sputum microbiological responses to a cycle of maintenance inhaled tobramycin was greater than intrasubject variability. (A and B) Change in culturable colony counts on MacConkey agar (sequencing-based analyses demonstrated these to be predominantly Pseudomonas aeruginosa with minor contributions of Serratia marcescens, Stenotrophomonas maltophila, Achromobacter xylosoxidans and an unidentified yeast taxon) from baseline (A) and absolute viable counts (B) by week on therapy. (C and D) Similarly show change in viable counts on mannitol salt agar (Staphylococcus aureus) from baseline (C) and absolute viable counts by week on therapy (D). (E and F) Change in TBL from baseline (E) and absolute TBL, (F) by week on therapy. Black lines represent individual subjects and coloured lines indicate medians. Baseline samples were collected prior to starting therapy, weeks 1–4 represent weekly samples collected during therapy and follow-up samples were collected 1 month after cessation of therapy. P values were determined using a Wilcoxon signed rank sum test comparing baseline and week 1 values. All values are presented after log transformation. TBL, total bacterial load.
Figure 2
Figure 2
Sputum microbiota shifts after 1 week of inhaled tobramycin. Taxonomic profiles of all samples were calculated via metagenomic shotgun sequencing followed by metagenomic phylogenetic analysis. (A) Principal components analysis using the Aitchison dissimilarity metric–pairwise Euclidean distance between samples after a centred log-transformation of relative abundance data, which is optimised for sparse, compositional data such as microbiota–of all samples (small dots) coloured and grouped by week on therapy. Large dots represent the centroid of each group, with lines connecting individual sample dots to their respective centroids. PERMANOVA tested for difference between centroids, Homogeneity of Variance assessed whether dispersion in data within each timepoint (distance of each datapoint from the respective centroid) differed among groups. (B) Biplot demonstrating the 18 taxa most responsible for the taxonomic difference between samples in (A). Length of vectors indicates the extent to which taxa contribute to intersample dissimilarity; starred taxa are those with longest vectors in each colour grouping. (C) Average taxonomic profiles of all samples by week on therapy at the species level. Only the top 14 most abundant species names are shown for ease of display. (D) Comparison of intrasubject versus intersubject microbiota dissimilarity at the species level by Aitchison dissimilarity, which takes into account both abundances and presence of individual taxa. Baseline samples were collected prior to starting therapy, weeks 1–4 represent weekly samples collected while individuals were on therapy and follow-up samples were collected 1 month after cessation of therapy. Wilcoxon signed-rank test was used to assess difference between groups. Taxonomic profiles of all samples individually are presented in online supplementary figures S4 and S5. Boxes represent interquartile region and middle represents the median. Streptococcus mitis, Streptococcus oralis and Streptococcus pneumoniae cannot be reliably differentiated by MetaPhlAn2 and are grouped in this analysis.
Figure 3
Figure 3
Non-dominant taxa contribute substantially to taxonomic shift with therapy. Taxonomic profiles of all samples defined by metagenomic sequencing and phylogenetic analysis. (A) Principal component analysis using the Aitchison dissimilarity metric of all baseline and week 1 samples (small dots) coloured and grouped by antibiotic treatment status. Large dots represent the centroid of each treatment category, with lines connecting individual sample dots to their respective centroids. (B) Log-relative abundances and (C) calculated log-absolute abundances of the 15 taxa that contributed most to the differences between baseline and week 1 samples identified in (A) as well as Pseudomonas aeruginosa and Staphylococcus aureus for comparison. PERMANOVA is a statistical test for difference between centroids, Homogeneity of Variance is a statistical test which assessed the difference in spread between two groups. Absolute abundances were calculated by multiplying relative abundances via MetaPhlAn2 by total bacterial loads as determined via universal 16S qPCR. Boxes represent interquartile regions and middle lines represent the medians. qPCR, quantitative PCR.
Figure 4
Figure 4
Similarity in sputum microbial communities between ‘responders’ and ‘non-responders’ to tobramycin. (A) Principal component analysis using the Aitchison dissimilarity metric of all baseline samples (small dots) coloured and grouped by response status. Large dots represent the centroid of each group, with lines connecting individual sample dots to their respective centroids. (B) Principal component analysis using the Aitchison dissimilarity metric of changes in relative abundance between baseline and week 1 samples (small dots) coloured and grouped by response status. Large dots represent the centroid of each group, with lines connecting individual sample dots to their respective centroids. PERMANOVA is a statistical test for difference between centroids, Homogeneity of Variance is a statistical test which assessed the difference in spread between two groups. (C–D) Difference in relative abundance (C) and calculated absolute abundance (D) of Pseudomonas aeruginosa and Staphylococcus aureus at baseline between ‘responders’ and ‘non-responders’. Boxes represent interquartile region and middle lines represent the medians.
Figure 5
Figure 5
Genetically conferred functional capacity changes relatively little with antibiotic therapy. Genetically conferred functional capacity was determined by mapping all shotgun sequencing reads to the KEGG database at the module level. (A) Principal component analysis using the Aitchison dissimilarity metric–Euclidean distance between samples after a centred log-transformation of relative abundance data–of baseline and week 1 samples without removal of dominant taxa (small dots) coloured and grouped by antibiotic status. (B) Log-abundances of all significantly different modules between baseline and week 1 samples without dominant taxa removed. (C) Principal component analysis using the Aitchison dissimilarity metric of all baseline and week 1 samples coloured and grouped by antibiotic treatment status after removal of reads from dominant taxa. (D) Log-abundances of the 20 modules with the largest effect size of those significantly different modules between baseline and week 1 samples after removal of reads from dominant taxa. PERMANOVA is a statistical test for difference between centroids, Homogeneity of Variance is a statistical test which assesses the difference. Modules are listed in table 1. (E) Principal component analysis using the Aitchison dissimilarity metric of all baseline and week 1 samples (small dots) coloured and grouped by antibiotic treatment status using only reads from dominant taxa. Large dots represent the centroid of each group, with lines connecting individual sample dots to their respective centroids. Boxes represent interquartile region and middle represents the median.

Comment in

References

    1. Konstan MW, Morgan WJ, Butler SM, et al. Risk factors for rate of decline in forced expiratory volume in one second in children and adolescents with cystic fibrosis. J Pediatr 2007;151:134–9. - PubMed
    1. Sanders DB, Bittner RCL, Rosenfeld M, et al. Pulmonary exacerbations are associated with subsequent FEV1 decline in both adults and children with cystic fibrosis. Pediatr Pulmonol 2011;46:393–400. - PubMed
    1. Carmody LA, Caverly LJ, Foster BK, et al. Fluctuations in airway bacterial communities associated with clinical states and disease stages in cystic fibrosis. PLoS One 2018;13:e0194060. - PMC - PubMed
    1. Muhlebach MS, Zorn BT, Esther CR, et al. Initial acquisition and succession of the cystic fibrosis lung microbiome is associated with disease progression in infants and preschool children. PLoS Pathog 2018;14:e1006798. - PMC - PubMed
    1. Carmody LA, Zhao J, Kalikin LM, et al. The daily dynamics of cystic fibrosis airway microbiota during clinical stability and at exacerbation. Microbiome 2015;3:12. - PMC - PubMed

Publication types

MeSH terms