. 2020 Aug 12;40(33):6270-6288.
doi: 10.1523/JNEUROSCI.0925-20.2020. Epub 2020 Jul 6.

Synaptic Plasticity Induced by Differential Manipulation of Tonic and Phasic Motoneurons in Drosophila

Affiliations

Synaptic Plasticity Induced by Differential Manipulation of Tonic and Phasic Motoneurons in Drosophila

Nicole A Aponte-Santiago et al. J Neurosci. .

Abstract

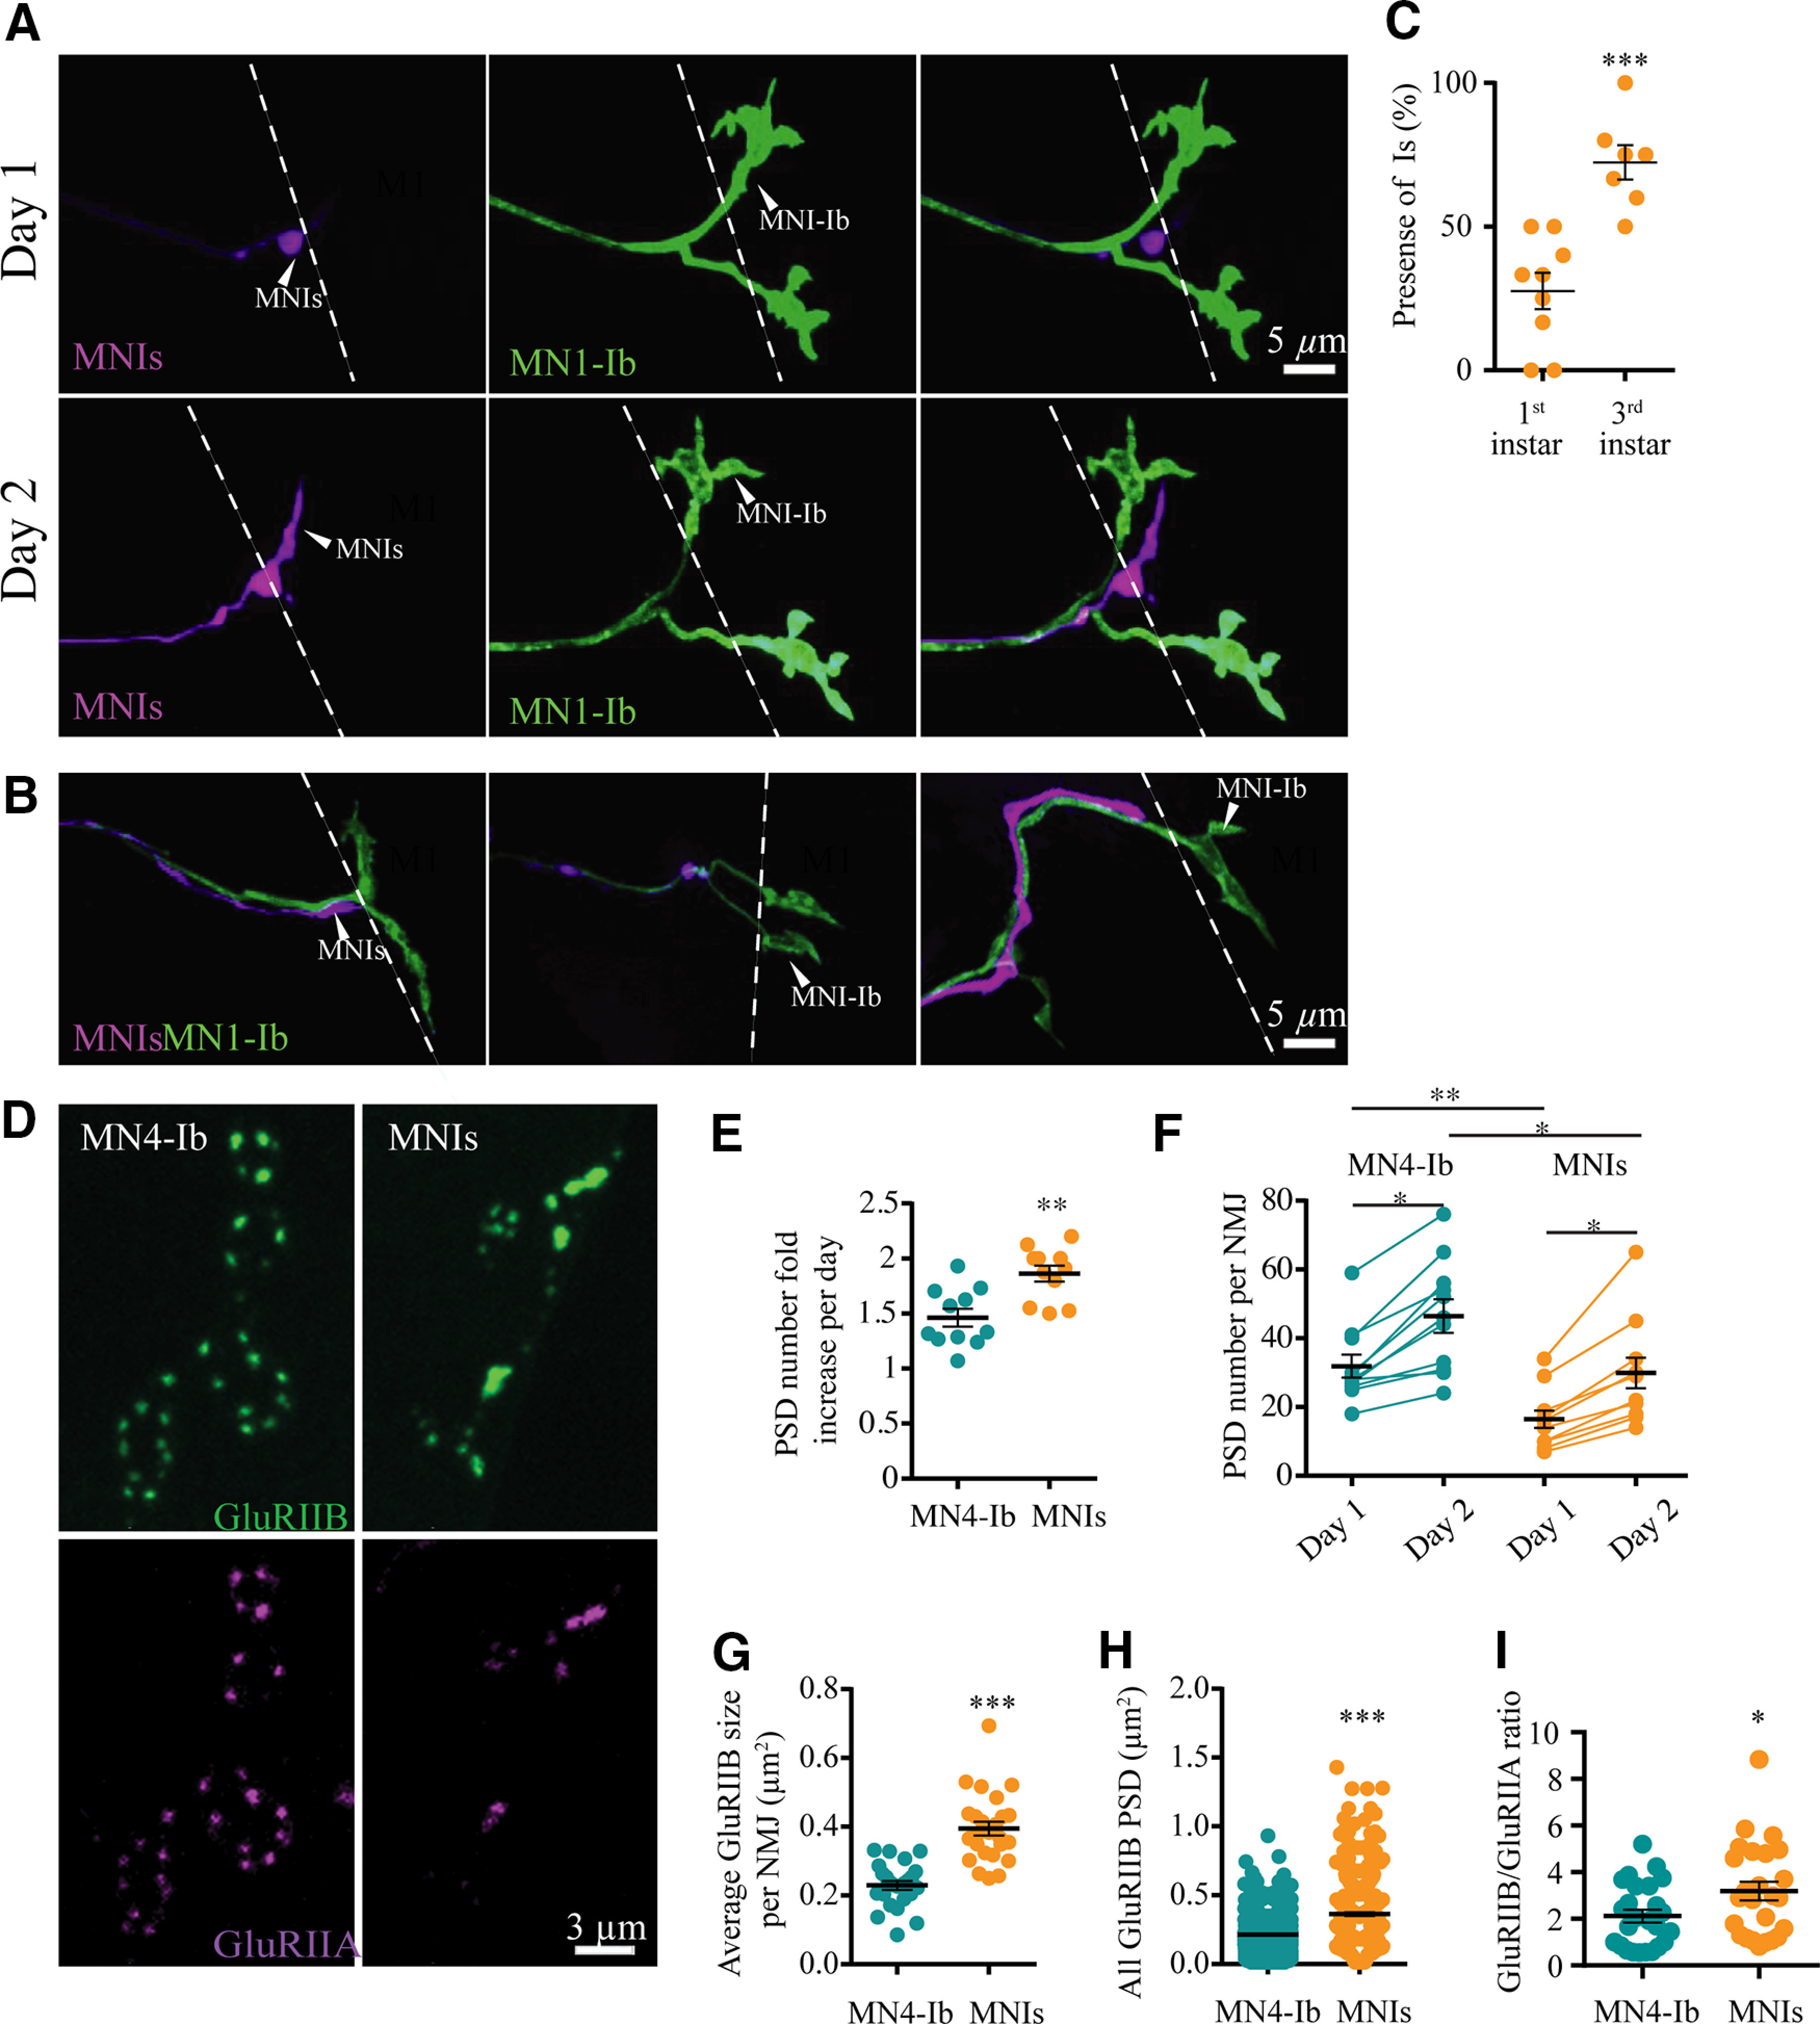
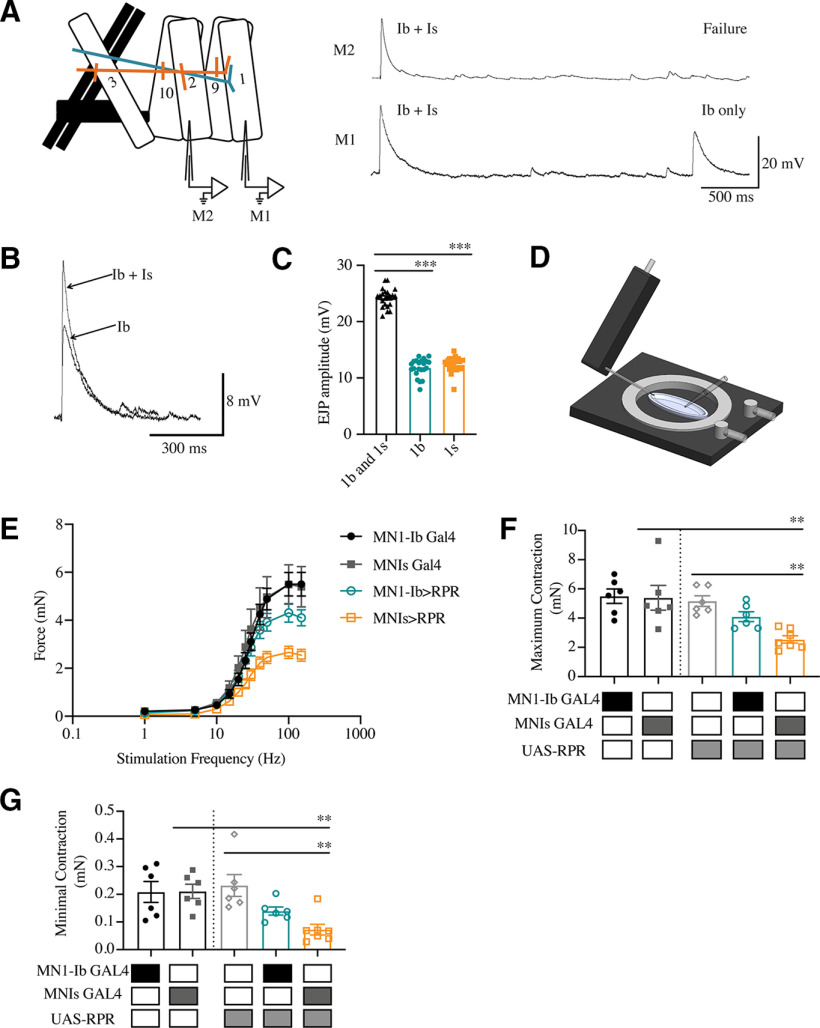
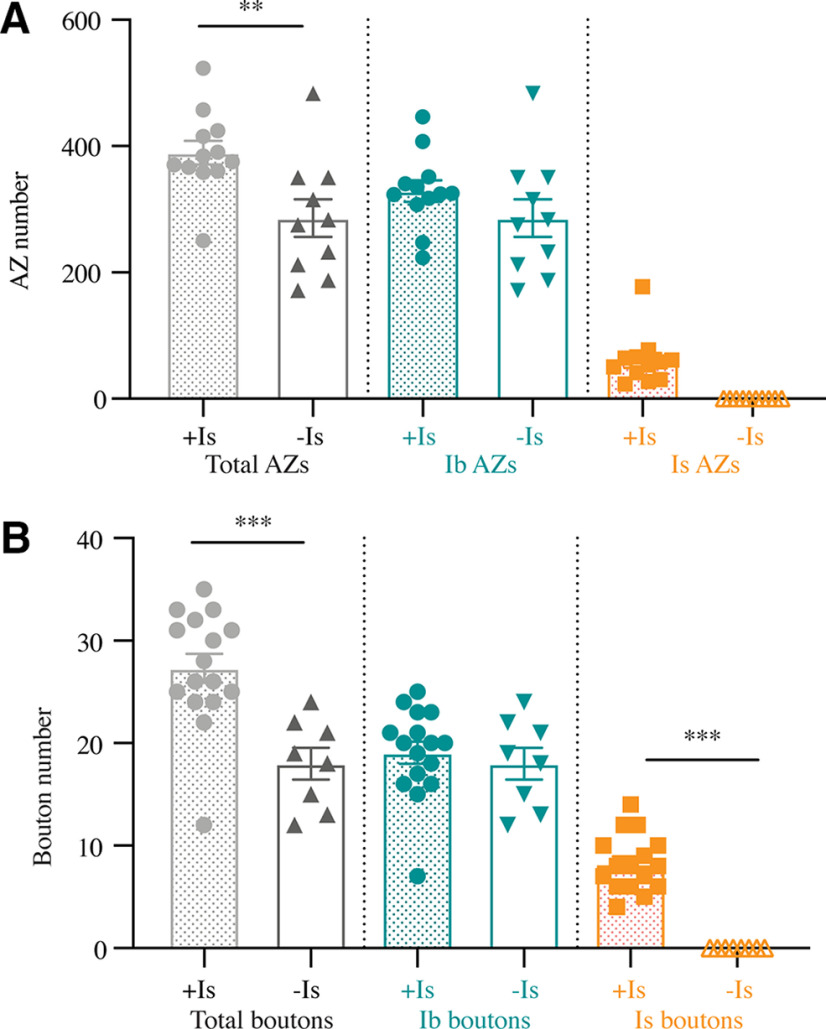
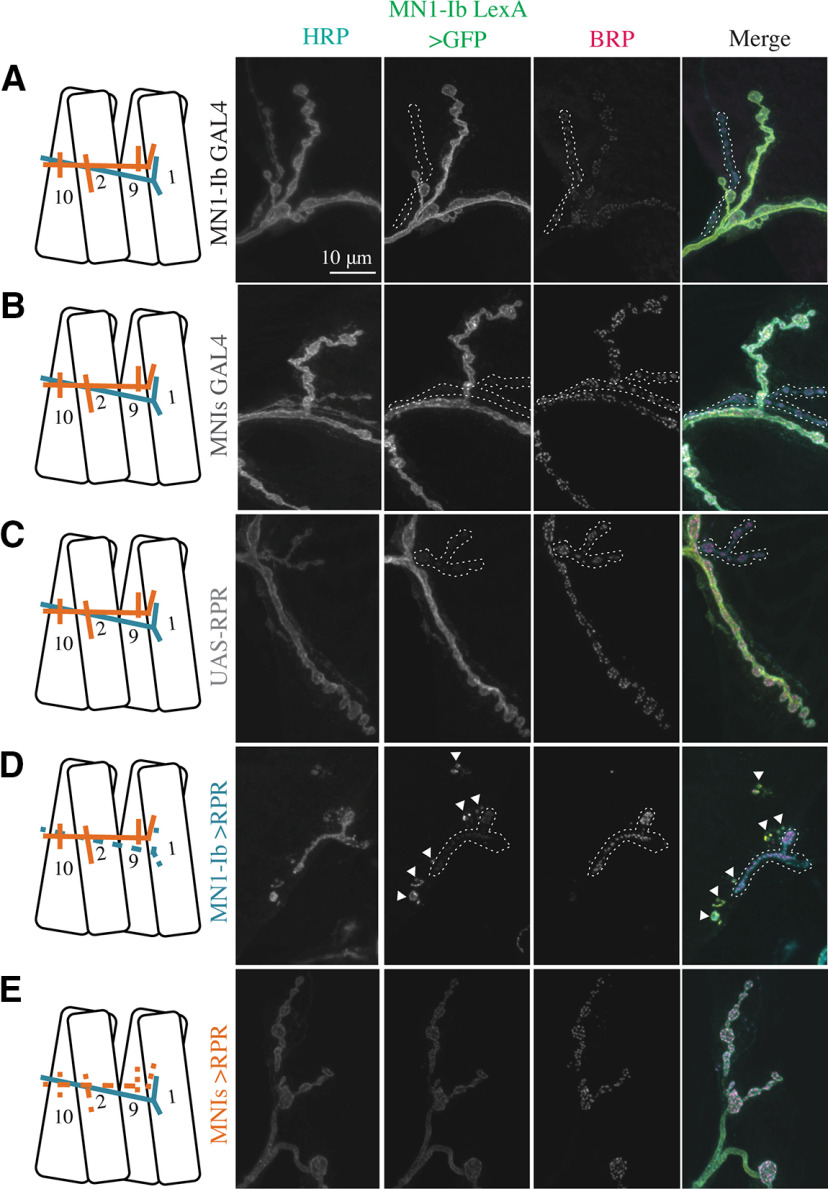
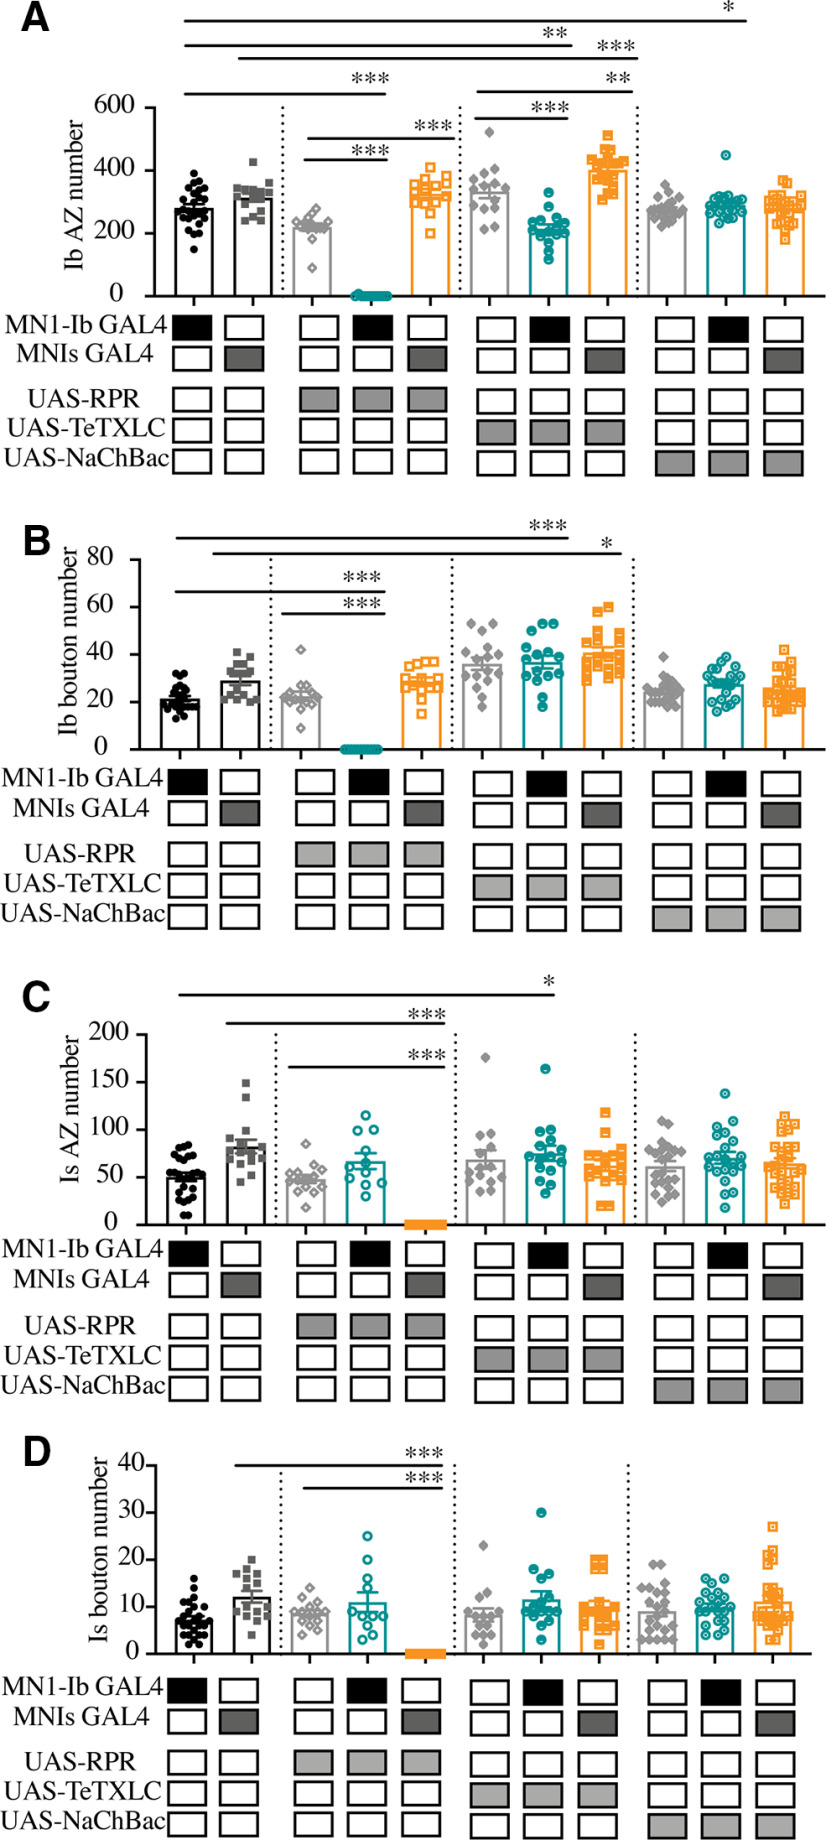
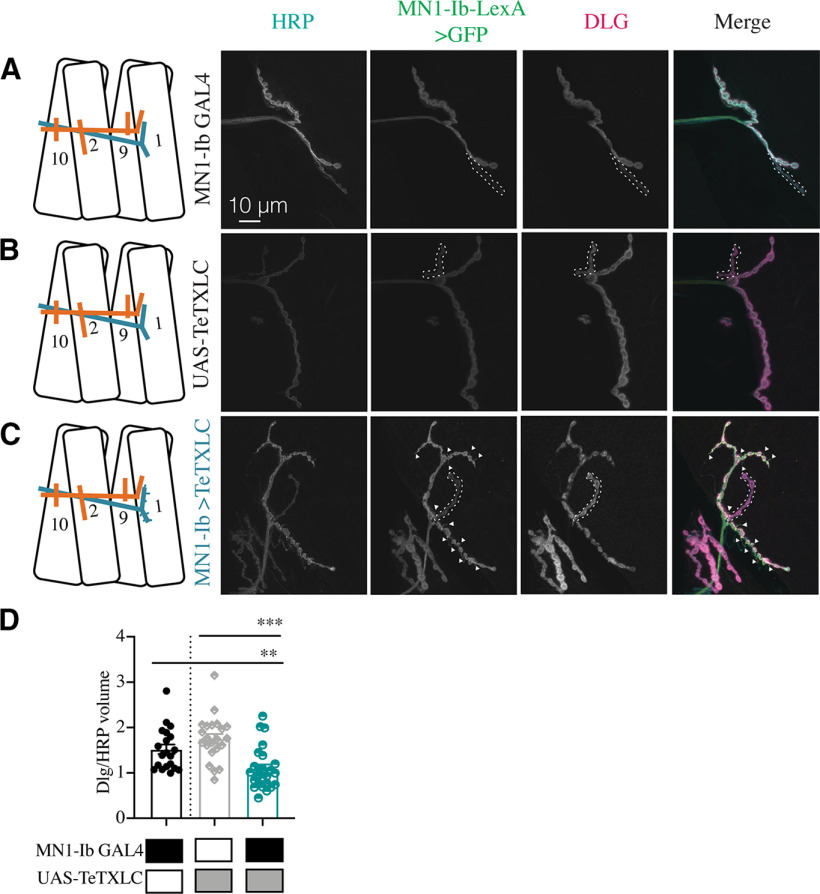
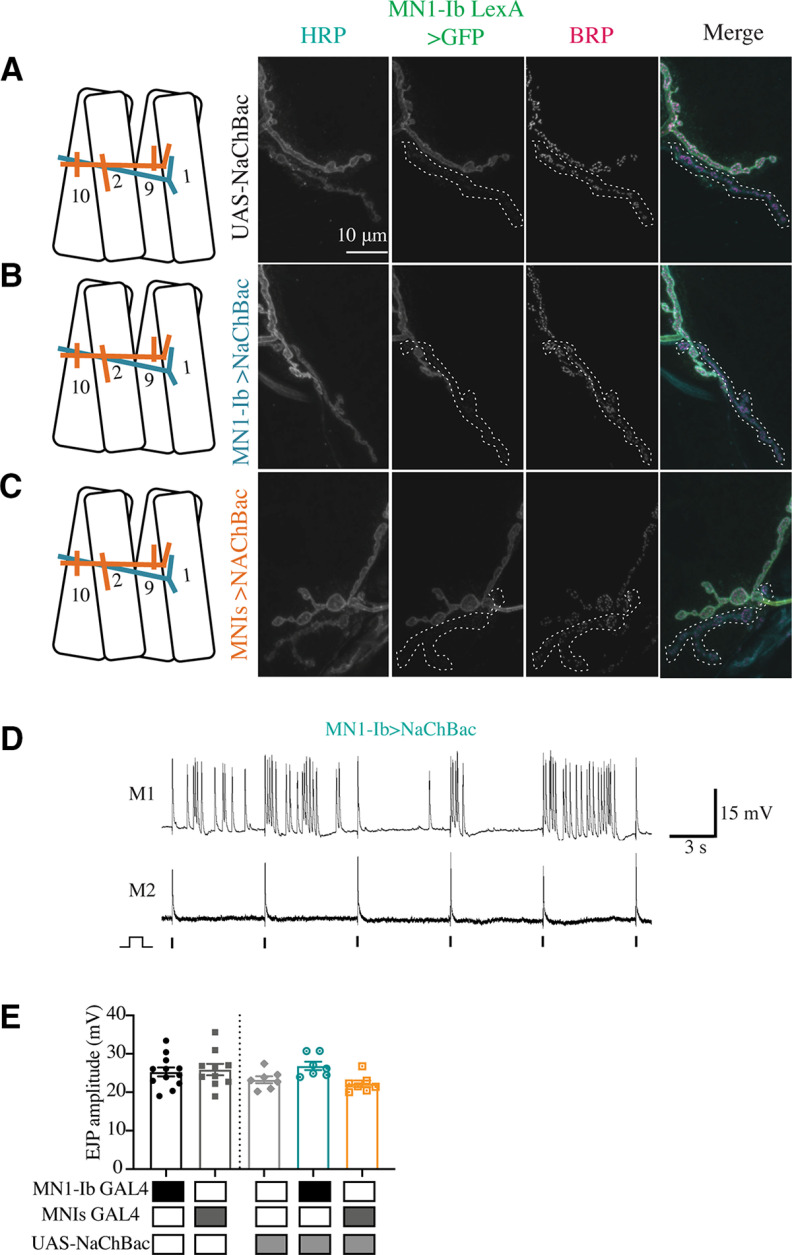
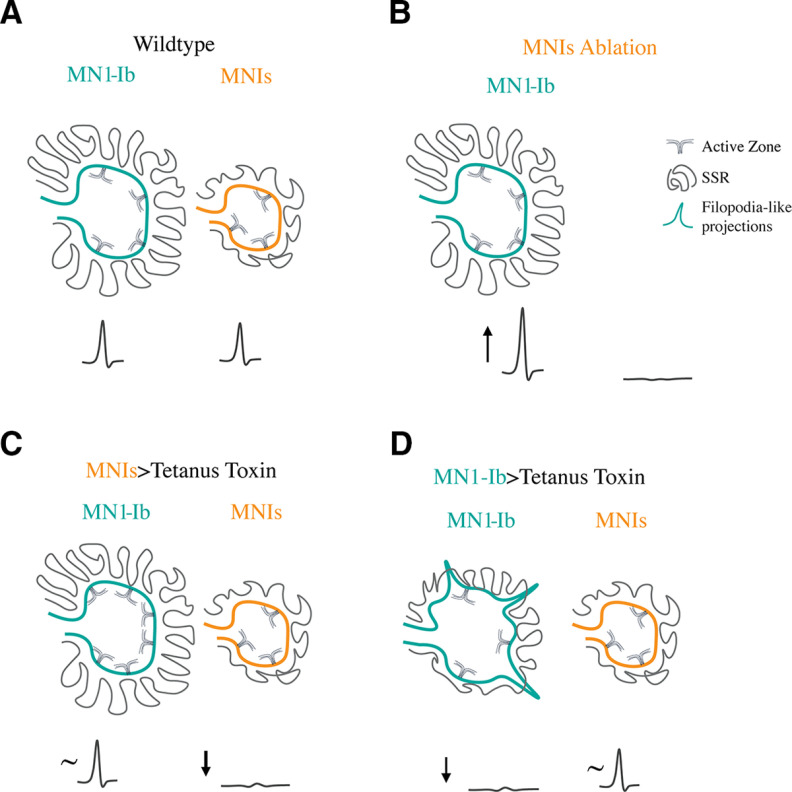
Structural and functional plasticity induced by neuronal competition is a common feature of developing nervous systems. However, the rules governing how postsynaptic cells differentiate between presynaptic inputs are unclear. In this study, we characterized synaptic interactions following manipulations of tonic Ib or phasic Is glutamatergic motoneurons that coinnervate postsynaptic muscles of male or female Drosophila melanogaster larvae. After identifying drivers for each neuronal subtype, we performed ablation or genetic manipulations to alter neuronal activity and examined the effects on synaptic innervation and function at neuromuscular junctions. Ablation of either Ib or Is resulted in decreased muscle response, with some functional compensation occurring in the Ib input when Is was missing. In contrast, the Is terminal failed to show functional or structural changes following loss of the coinnervating Ib input. Decreasing the activity of the Ib or Is neuron with tetanus toxin light chain resulted in structural changes in muscle innervation. Decreased Ib activity resulted in reduced active zone (AZ) number and decreased postsynaptic subsynaptic reticulum volume, with the emergence of filopodial-like protrusions from synaptic boutons of the Ib input. Decreased Is activity did not induce structural changes at its own synapses, but the coinnervating Ib motoneuron increased the number of synaptic boutons and AZs it formed. These findings indicate that tonic Ib and phasic Is motoneurons respond independently to changes in activity, with either functional or structural alterations in the Ib neuron occurring following ablation or reduced activity of the coinnervating Is input, respectively.SIGNIFICANCE STATEMENT Both invertebrate and vertebrate nervous systems display synaptic plasticity in response to behavioral experiences, indicating that underlying mechanisms emerged early in evolution. How specific neuronal classes innervating the same postsynaptic target display distinct types of plasticity is unclear. Here, we examined whether Drosophila tonic Ib and phasic Is motoneurons display competitive or cooperative interactions during innervation of the same muscle, or compensatory changes when the output of one motoneuron is altered. We established a system to differentially manipulate the motoneurons and examined the effects of cell type-specific changes to one of the inputs. Our findings indicate Ib and Is motoneurons respond differently to activity mismatch or loss of the coinnervating input, with the Ib subclass responding robustly compared with Is motoneurons.

Keywords: Drosophila; active zone; glutamatergic; motoneuron; neurotransmitter release; synaptic plasticity.


Figures

Figure 1.
Figure 1.
Identification of tonic Ib and phasic Is motoneuron GAL4 drivers. A, Comparison of synaptic and biophysical properties of Ib and Is motoneurons in Drosophila larvae. B, Confocal image of UAS-CD8-GFP driven by MN1-Ib GAL4 (GMR94G06) in the third instar larval VNC from the FlyLight Project GAL4 collection. Arrows denote the paired MN1-Ib cell bodies in each abdominal segment, and arrowheads denote GFP expression in axons exiting the VNC. Scale bar, 50 µm. C, Diagram of MN1-Ib innervation in a larval abdominal hemisegment. D, Immunostaining for anti-GFP (green) to label MN1-Ib and HRP (magenta) to label all axons in a MN1-Ib GAL4; UAS-CD8-GFP third instar larva. Muscles M1 and M2 are indicated. Scale bar, 20 µm. E, Diagram of MNISN-Is and MNSNb/d-Is innervation in a larval abdominal hemisegment. F, Immunostaining for anti-GFP (green) to label MNIs and HRP (magenta) to label all axons in a MNIs GAL4 (6-58); UAS-CD8-GFP third instar larva. Muscles M1 and M2 are indicated. Scale bar, 20 µm.
Figure 2.
Figure 2.
Quantification of MN1-Ib and MNIs target innervation and synapse formation with serial intravital imaging across development. A, Sequential confocal images of muscle M1 innervation by MN1-Ib (green) and MNIs (magenta) at day 1 (top panels) and day 2 (bottom panels) of larval development in dual-labeled animals (MN1-Ib LexA>LexAop2-CD8-GFP; MNIs GAL4>UAS-DsRed). Dashed line indicates M1 muscle boundary. MNIs has delayed innervation compared with MN1-Ib. Scale bar, 5 µm. B, Representative confocal images of three M1 muscles on day 1 showing delayed innervation by MNIs (magenta) compared with MN1-Ib (green). MNIs axons in the left and middle panels proceeded to innervate M1 later in development, while the MNIs axon on the right failed to innervate M1. Dashed line indicates the M1 muscle boundary. Scale bar, 5 µm. C, Quantification of Is motoneuron innervation of M1 in first instar (27.6 ± 6.3%, n = 9 larvae) versus third instar (72.4 ± 6.1%, n = 7 larvae; p = 0.0002, Student's t test). Each point represents the average percentage of M1 innervation in segments A2–A4 from a single larva. D, Confocal imaging of PSDs formed at MN4-Ib and MNIs NMJs on M4 in larvae expressing RFP-tagged GluRIIA (magenta) and GFP-tagged GluRIIB (green). Note that the Is terminal has fewer synapses but larger PSDs. Scale bar, 3 µm. E, Increase in GluRIIB-positive PSDs over 24 h starting at the first instar larval stage. The increase in PSD number is plotted as the fold-increase of day 2 PSDs over the initial day 1 PSDs for MN4-Ib and MNIs. Each point represents the average increase at M4 from segments A2–A4 for a single larva. F, Increase in PSD number at M4 during serial imaging of MN4-Ib and MNIs over 24 h beginning at the first instar stage. Each point represents the average PSD number at M4 from segments A2–A4 for a single larva on day 1 and day 2. At the first instar stage, the PSD number at MN4-Ib is 31.9 ± 3.3 (n = 11) and is statistically different (p = 0.0015) from PSD number for MNIs (16.5 ± 2.6; n = 11). On day 2, PSD number at MN4-Ib increases to 46.5 ± 4.9 (n = 11), and for MNIs to 29.9 ± 4.5 (n = 11; p = 0.021). Between the 2 consecutive days of imaging, there is a significant growth and addition of new PSDs (MN4-Ib PSD increase, p = 0.023; MNIs PSD increase, p = 0.017). G, Quantification of GluRIIB-positive PSD area for MN4-Ib and MNIs synapses at M4 in first instar larvae. Each point represents the average PSD area at M4 from segments A2–A4 for a single larva. H, Distribution of individual PSD sizes at M4 from segments A2–A4 for MN4-Ib and MNIs NMJs for all first instar larvae imaged (n = 9 larvae each). I, Quantification of GluRIIB to GluRIIA ratio at PSDs apposed to MN4-Ib or MNIs synapses at M4 in first instar larvae. Each point represents the ratio at M4 from segments A2–A4 for a single larva. Statistical significance was determined using Student's t test. Data are shown as the mean ± SEM. *p < 0.05, **p < 0.01, ***p < 0.001.
Figure 3.
Figure 3.
Reduction in synaptic growth and muscle innervation by Is motoneurons in Gbb mutants. A, Confocal images of third instar muscle M4 innervation by MN4-Ib (green, anti-HRP staining) and MNIs (magenta, MNIs GAL4>UAS-DsRed) in controls (top panels) or Gbb mutants (gbb1/gbb2, bottom panels). Muscles were labeled with phalloidin-conjugated Alexa Fluor 647 and are shown in blue. Dashed line indicates M4 muscle boundary and each neuron is labeled. Scale bar, 3 µm. B, Quantification of NMJ area for MN4-Ib or MNIs at third instar M4 defined by anti-HRP staining for controls and Gbb mutants. Each point represents the average NMJ area at M4 from segments A2–A4 for a single larva. C, Quantification of the percentage of M4 muscles innervated by MN4-Ib or MNIs at the third instar stage. Each point represents the average percentage of M4 innervation in segments A2–A4 from a single larva. Statistical significance was determined using Student's t test. Data are shown as the mean ± SEM. ***p < 0.001.
Figure 4.
Figure 4.
Contributions of MN1-Ib and MNIs to muscle excitability and contractile force. A, Depiction of a dual intracellular electrode paradigm for performing simultaneous voltage recordings from muscles M1 and M2 in control w118 third instar larvae, with MN1-Ib (teal) and MNIs (orange) labeled. Representative recordings from M1 and M2 are shown on the right. Ib + Is shows the compound EJP generated when both motoneurons are activated. Lowering stimulation intensity results in the recruitment of only MN1-Ib or MNIs. Stimulation of only MNIs triggers responses in both muscles, given that it innervates M1 and M2. Stimulation of MN1-Ib, as shown in the Ib-only trace, results in responses only from M1. B, Representative traces of simple or compound EJPs at M1 showing recruitment of MN1-Ib only or both MN1-Ib and MNIs. C, Average EJP amplitude at M1 following the recruitment of both motoneurons or MN1-Ib or MNIs only (n = 22 larvae). D, Schematic of force transducer setup used to measure larval muscle contractile force. E, Force–frequency curves for 1–150 Hz nerve stimulation in MN1-Ib and MNIs GAL4 controls and MN1-Ib GAL4>RPR and MNIs GAL4>RPR ablated third instar larvae. Six replicate contractions were generated at each stimulation frequency for each recording and averaged across seven larvae per genotype. F, Maximal contraction force elicited at 150 Hz is shown. Shaded boxes under each bar indicate the genotypes for each experimental group. G, Minimal contraction force elicited by a single action potential for the indicated genotypes. Statistical significance was determined using Student's t test. Data are shown as the mean ± SEM. **p < 0.01, ***p < 0.001.
Figure 5.
Figure 5.
Lack of correlation between Ib and Is synaptic innervation at M1 and M4. A, Correlation of MN1-Ib and MNIs AZ number at M1 quantified following immunolabeling for BRP in control w118 third instar larvae (r = −0.11, n = 29, p = 0.57). B, Correlation of MN4-Ib and MNIs AZ number at M4 quantified following immunolabeling for BRP in w118 third instar larvae (r = −0.10, n = 19, p = 0.69). C, Correlation of MN1-Ib and MNIs synaptic bouton number at M1 quantified following immunolabeling for HRP in w118 third instar larvae (r = 0.15, n = 29, p = 0.44). D, Correlation of MN4-Ib and MNIs synaptic bouton number at M4 quantified following immunolabeling for HRP in w118 third instar larvae (r = 0.13, n = 19, p = 0.60). The Pearson correlation coefficient (r) is shown on the top right for each analysis. Each data point corresponds to Ib and Is AZ or bouton number from a single larva at the indicated muscle of segment A3.
Figure 6.
Figure 6.
Lack of structural synaptic changes in MN1-Ib when Is innervation is absent. A, Quantification of MN1-Ib and MNIs AZ number following immunolabeling for BRP in control w118 third instar larval M1 muscles in segment A3. The total AZ number when both inputs are present (+Is) or when Is innervation is absent (−Is) is shown. AZ number specifically for MN1-Ib (teal) or MNIs (orange) is also shown when both inputs are present (+Is) or when Is innervation is absent (−Is). B, Quantification of MN1-Ib and MNIs synaptic bouton number following immunolabeling for HRP in w118 third instar larval M1 muscles in segment A3. Total bouton number when both inputs are present (+Is) or when Is innervation is absent (−Is) is shown. Bouton number specifically for MN1-Ib (teal) or MNIs (orange) is also shown when both inputs are present (+Is) or when Is innervation is absent (−Is). Each data point represents quantification from a single larva. Statistical significance was determined using ANOVA. Data are shown as the mean ± SEM. **p < 0.01, ***p < 0.001.
Figure 7.
Figure 7.
Morphologic consequences of ablation of MN1-Ib or MNIs. A–E, Representative confocal images of third instar larval M1 NMJs at segment A3 following immunolabeling with anti-HRP, anti-GFP, and anti-BRP in the following genotypes: MN1-Ib GAL4 control (A); MNIs GAL4 control (B); UAS-RPR control (C); MN1-Ib GAL4>UAS-RPR (D); MNIs GAL4>UAS-RPR (E). MN1-Ib LexA>LexAop2-CD8-GFP was present in each genetic background to allow unambiguous identification of the Ib terminal. Diagrams of the experimental manipulation are shown on the left, with MN1-Ib (teal) and MNIs (orange) labeled. The merged image is shown on the right. The white dashed line highlights the MNIs terminal in the final three panels for each manipulation except for E, where Is is absent following ablation. Arrowheads in D depict GFP-positive debris near M1 secondary to death and fragmentation of MN1-Ib following Reaper expression. Scale bar: all panels, 10 µm.
Figure 8.
Figure 8.
Quantification of muscle size, the total AZ and total bouton number follow ablation, or activity changes of MN1-Ib or MNIs is shown. A, M1 muscle size is not altered by ablation or activity changes of MN1-Ib or MNIs motoneurons. Shaded boxes under each bar indicate the genotypes for each group, with control GAL4 driver lines alone (MN1-Ib, MNIs), control UAS transgenes alone (UAS-RPR, UAS-TeTXLC, UAS-NaChBac), and experimental crosses of MN1-Ib GAL4 (teal) or MNIs GAL4 (orange) to each transgene. Each data point represents quantification of segment A3 M1 surface area from a single third instar larvae. No statistical difference was found across genotypes. B, Quantification of combined MN1-Ib and MNIs AZ number following immunolabeling for BRP in third instar larval M1 muscles in segment A3 of the indicated genotypes. C, Quantification of combined MN1-Ib and MNIs synaptic bouton number following immunolabeling for HRP in third instar larval M1 muscles in segment A3 of the indicated genotypes. Shaded boxes under each bar indicate the genotypes for each group, with control GAL4 driver lines alone (MN1-Ib, MNIs), control UAS transgenes alone (UAS-RPR, UAS-TeTXLC, UAS-NaChBac), and experimental crosses of MN1-Ib GAL4 (teal) or MNIs GAL4 (orange) to each transgene. Each data point represents quantification from segment A3 M1 from a single third instar larvae. Statistical significance was determined using ANOVA. Data are shown as the mean ± SEM. *p < 0.05, **p < 0.01, ***p < 0.001.
Figure 9.
Figure 9.
Quantification of MN1-Ib or MNIs AZ and bouton number follow ablation or activity changes. A, Quantification of MN1-Ib AZ number following immunolabeling for BRP in third instar larval M1 muscles in segment A3 of the indicated genotypes. B, Quantification of combined MN1-Ib synaptic bouton number following immunolabeling for HRP in third instar larval M1 muscles in segment A3 of the indicated genotypes. C, Quantification of MNIs AZ number following immunolabeling for BRP in third instar larval M1 muscles in segment A3 of the indicated genotypes. D, Quantification of MNIs synaptic bouton number following immunolabeling for HRP in third instar larval M1 muscles in segment A3 of the indicated genotypes. Shaded boxes under each bar indicate the genotypes for each group, with control GAL4 driver lines alone (MN1-Ib, MNIs), control UAS transgenes alone (UAS-RPR, UAS-TeTXLC, UAS-NaChBac), and experimental crosses of MN1-Ib GAL4 (teal) or MNIs GAL4 (orange) to each transgene. Each data point represents quantification from segment A3 M1 from a single third instar larva. Statistical significance was determined using ANOVA. Data are shown as the mean ± SEM. *p < 0.05, **p < 0.01, ***p < 0.001.
Figure 10.
Figure 10.
Morphologic consequences of silencing of MN1-Ib or MNIs. A–C, Representative confocal images of third instar larval M1 NMJs at segment A3 following immunolabeling with anti-HRP, anti-GFP, and anti-BRP in the following genotypes: UAS-TeTXLC control (A); MN1-Ib GAL4>UAS-TeTXLC (B); and MNIs GAL4>UAS-TeTXLC (C). MN1-Ib LexA>LexAop2-CD8-GFP was present in each genetic background to allow unambiguous identification of the Ib terminal. Diagrams of the experimental manipulation are shown on the left, with MN1-Ib (teal) and MNIs (orange) labeled. The merged image is shown on the right. The white dashed line highlights the MNIs terminal in the final three panels for each manipulation. Arrowheads in B depict GFP-positive filopodial-like projections from MN1-Ib following tetanus toxin expression. Scale bars: all panels, 10 µm. D, Quantification of filopodial-like projections in controls and following UAS-TeTXLC expression with MN1-Ib or MNIs GAL4. Each data point represents quantification from segment A3 M1 from a single third instar larvae. Statistical significance was determined using ANOVA. Data are shown as mean ± SEM. ***p < 0.001.
Figure 11.
Figure 11.
Electrophysiological measurements and contraction force analysis following manipulations of MN1-Ib or MNIs. A, EJP amplitudes recorded from third instar larval M1 muscles in segment A3 of the indicated genotypes. Each data point is the average of at least 20 EJPs recorded from each larva. Shaded boxes under each bar indicate the genotypes for each group, with control GAL4 driver lines alone (MN1-Ib, MNIs), control UAS transgenes alone (UAS-RPR, UAS-TeTXLC), and experimental crosses of MN1-Ib GAL4 (teal) or MNIs GAL4 (orange) to each transgene. The final three columns on the right show results from dual intracellular recordings in controls using the minimal stimulation protocol where either MN1-Ib or MNIs motoneurons were active (Ib+Is), or MN1-Ib (Ib) or MNIs (Is) were independently isolated. B, Minimum contraction force in third instar larvae of the indicated genotypes. Six replicate contractions per genotype were generated per recording. Shaded boxes under each bar indicate the genotypes for each group, with control GAL4 driver lines alone (MN1-Ib, MNIs), control UAS transgenes alone (UAS-RPR, UAS-TeTXLC, UAS-NaChBac), and experimental crosses of MN1-Ib GAL4 (teal) or MNIs GAL4 (orange) to each transgene. C, Force–frequency curves for MN1-Ib GAL4 controls and the indicated experimental genotypes. Data points represent six replicate contractions elicited at each frequency from six to seven third instar larvae. D, Force–frequency curves for MN1-Is GAL4 controls and the indicated experimental genotypes. Data points represent six replicate contractions elicited at each frequency from six to seven third instar larvae. Statistical significance was determined using ANOVA. Data are shown as the mean ± SEM. *p < 0.05, **p < 0.01, ***p < 0.001.
Figure 12.
Figure 12.
Reduced postsynaptic SSR volume following silencing of MN1-Ib. A–C, Representative confocal images of third instar larval M1 NMJs at segment A3 following immunolabeling with anti-HRP, anti-GFP, and anti-DLG in the following genotypes: MN1-Ib GAL4 control (A); UAS-TeTXLC control (B); and MN1-Ib GAL4>UAS-TeTXLC (C). MN1-Ib LexA>LexAop2-CD8-GFP was present in each genetic background to allow unambiguous identification of the Ib terminal. Diagrams of the experimental manipulation are shown on the left, with MN1-Ib (teal) and MNIs (orange) labeled. The merged image is shown on the right. The white dashed line highlights the MNIs terminal in the final three panels for each manipulation. Arrowheads in C depict GFP-positive filopodial-like projections from MN1-Ib following tetanus toxin expression. Scale bars: all panels, 10 µm. D, Quantification of DLG to HRP volume in MN1-Ib in controls and following UAS-TeTXLC expression with MN1-Ib GAL4. Each data point represents quantification from segment A3 M1 from a single third instar larvae. Statistical significance was determined using ANOVA. Data are shown as the mean ± SEM. **p < 0.01, ***p < 0.001.
Figure 13.
Figure 13.
Chronic increases in MN1-Ib or MNIs activity do not impact NMJ morphology or synaptic release. A–C, Representative confocal images of third instar larval M1 NMJs at segment A3 following immunolabeling with anti-HRP, anti-GFP, and anti-BRP in the following genotypes: UAS-NaChBac control (A); MN1-Ib GAL4>UAS-NaChBac (B); and MNIs GAL4>UAS-NaChBac (C). MN1-Ib LexA>LexAop2-CD8-GFP was present in each genetic background to allow unambiguous identification of the Ib terminal. Diagrams of the experimental manipulation are shown on the left, with MN1-Ib (teal) and MNIs (orange) labeled. The merged image is shown on the right. The white dashed line highlights the MNIs terminal in the final three panels for each manipulation. Scale bars: all panels, 10 µm. D, Representative dual intracellular recordings from M1 and M2 in MN1-Ib>NaChBac third instar larvae during 0.2 Hz stimulation. Note the train of EJPs following a single stimulus at M1 compared with M2. Vertical lines below the M2 recordings indicate the timing of nerve stimulation. E, EJP amplitudes recorded from third instar larval M1 muscles in segment A3 of the indicated genotypes. Each data point is the average of at least 20 EJPs recorded from each larva. Statistical significance was determined using ANOVA. No statistical difference was found across genotypes. Data are shown as the mean ± SEM.
Figure 14.
Figure 14.
Summary of observed MN1-Ib plasticity. A, In wild-type, MN1-Ib and MNIs provide similar drive to muscle M1. MN1-Ib forms more synaptic boutons and AZs onto M1 compared with MNIs. B, Ablation of MNIs results in increased output from MN1-Ib, as evidenced by larger EJPs, but does not trigger increases in bouton or AZ number. C, Silencing of MNIs with tetanus toxin triggers increased bouton and AZ number in the coinnervating MN1-Ib. These changes do not increase presynaptic output from MN1-Ib, with EJP amplitude (∼) at M1 unchanged compared with controls. No structural changes are observed in the silenced MNIs. D, Silencing of MN1-Ib with tetanus toxin results in decreased bouton and AZ number at MN1-Ib terminals. Postsynaptic SSR development is also reduced. Presynaptic filopodia-like projections normally restricted to early first instar stage are observed at mature MN1-Ib silenced terminals. No structural or functional (∼) changes occur in the coinnervating MNIs.

References

    1. Aberle H, Haghighi AP, Fetter RD, McCabe BD, Magalhães TR, Goodman CS (2002) wishful thinking encodes a BMP type II receptor that regulates synaptic growth in Drosophila. Neuron 33:545–558. 10.1016/s0896-6273(02)00589-5 - DOI - PubMed
    1. Akbergenova Y, Cunningham KL, Zhang YV, Weiss S, Littleton JT (2018) Characterization of developmental and molecular factors underlying release heterogeneity at Drosophila synapses. Elife 7:e38268 10.7554/eLife.38268 - DOI - PMC - PubMed
    1. Alyagor I, Berkun V, Keren-Shaul H, Marmor-Kollet N, David E, Mayseless O, Issman-Zecharya N, Amit I, Schuldiner O (2018) Combining developmental and perturbation-Seq uncovers transcriptional modules orchestrating neuronal remodeling. Dev Cell 47:38–52.e6. 10.1016/j.devcel.2018.09.013 - DOI - PMC - PubMed
    1. Ashley J, Sorrentino V, Lobb-Rabe M, Nagarkar-Jaiswal S, Tan L, Xu S, Xiao Q, Zinn K, Carrillo RA (2019) Transsynaptic interactions between IgSF proteins DIP-α and Dpr10 are required for motor neuron targeting specificity. Elife 8:e42690 10.7554/eLife.42690 - DOI - PMC - PubMed
    1. Atwood HL, Karunanithi S (2002) Diversification of synaptic strength: presynaptic elements. Nat Rev Neurosci 3:497–516. 10.1038/nrn876 - DOI - PubMed

Publication types

LinkOut - more resources