. 2020 Aug 25;202(18):e00277-20.
doi: 10.1128/JB.00277-20. Print 2020 Aug 25.

MapA, a Second Large RTX Adhesin Conserved across the Pseudomonads, Contributes to Biofilm Formation by Pseudomonas fluorescens

Affiliations

MapA, a Second Large RTX Adhesin Conserved across the Pseudomonads, Contributes to Biofilm Formation by Pseudomonas fluorescens

Alan J Collins et al. J Bacteriol. .

Abstract

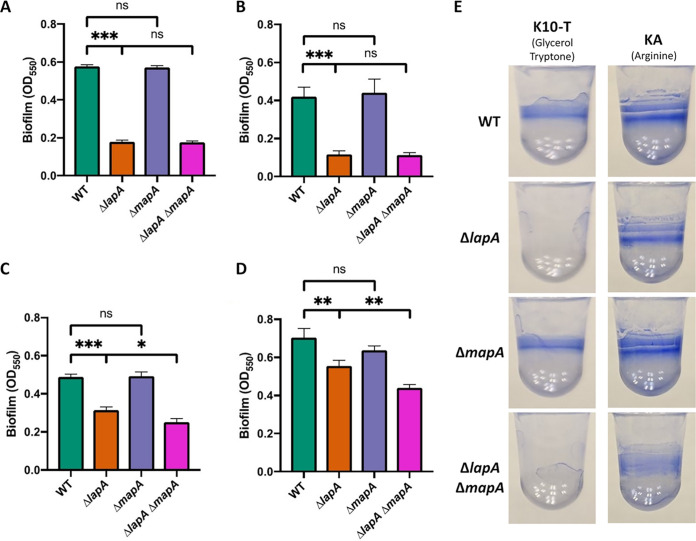
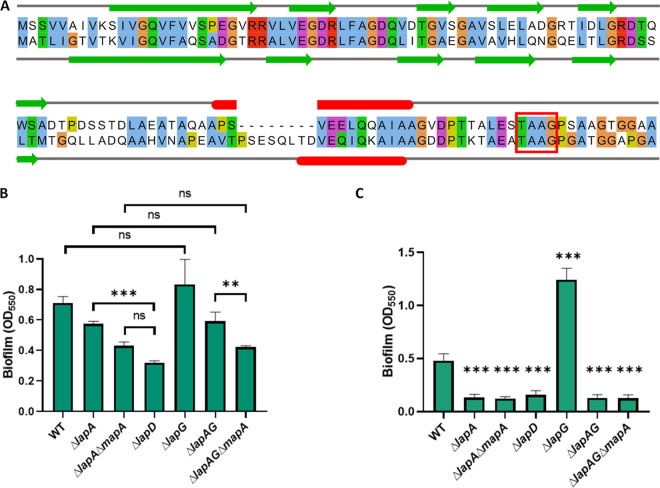
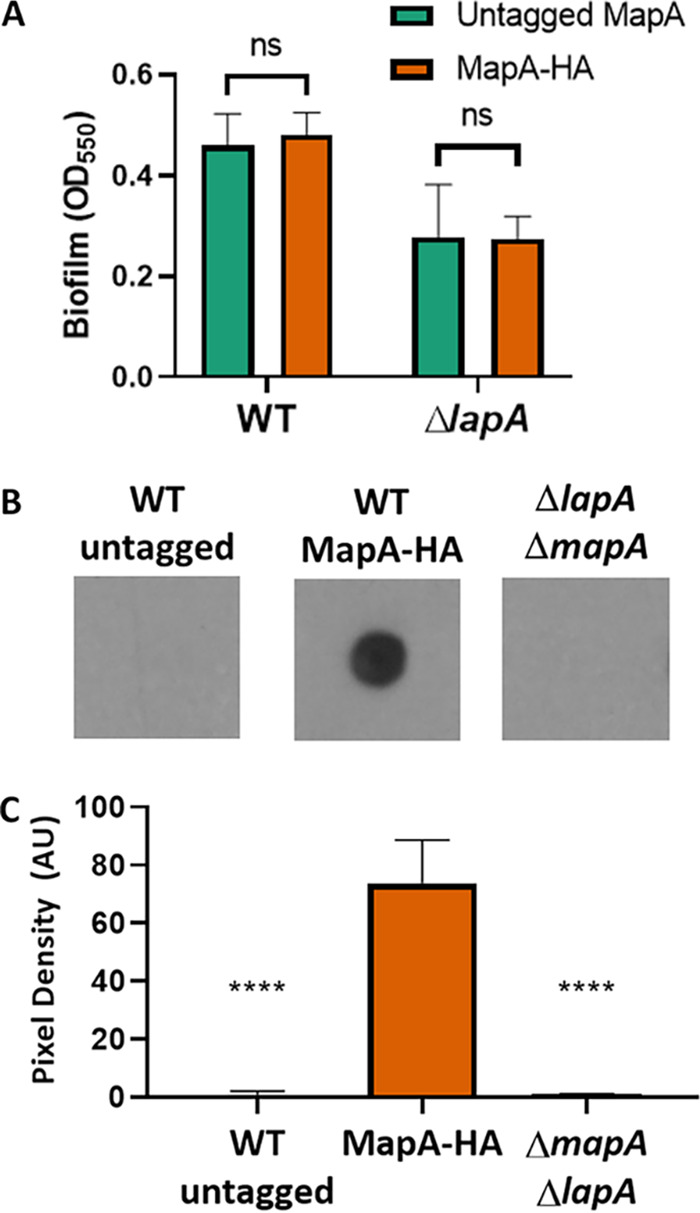
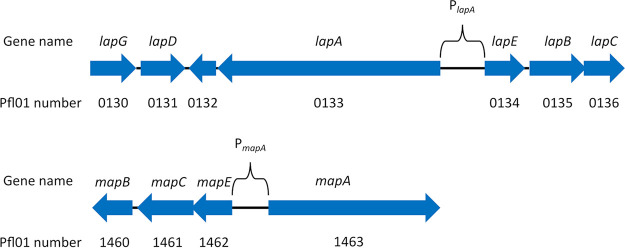
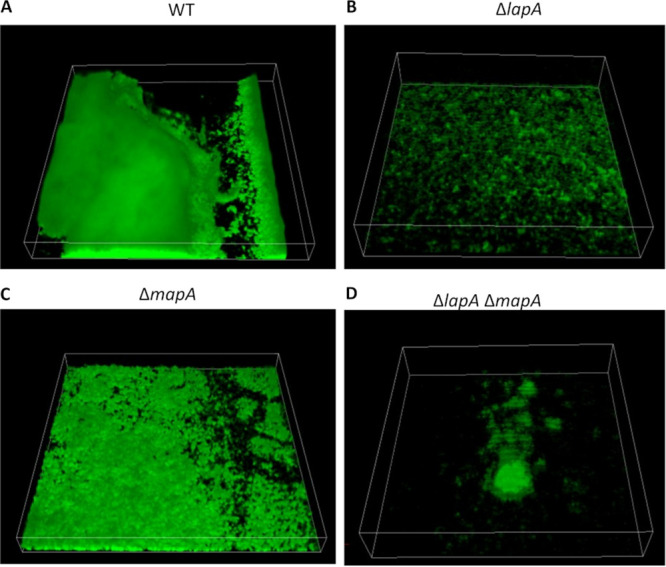
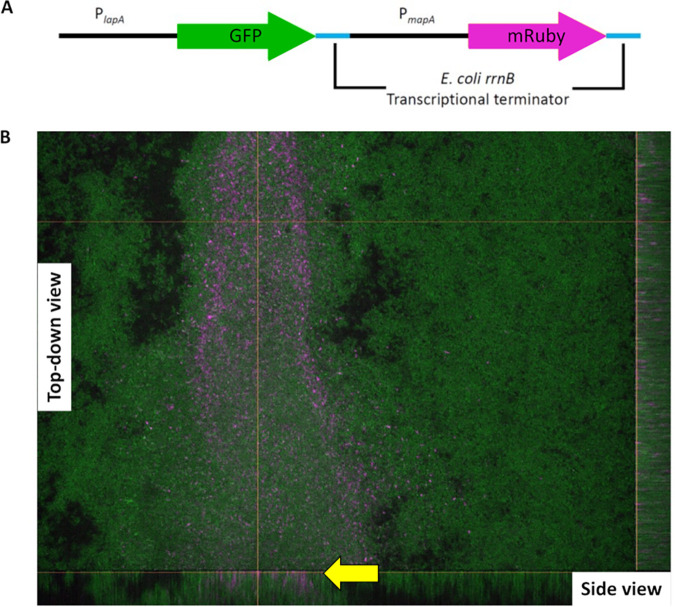
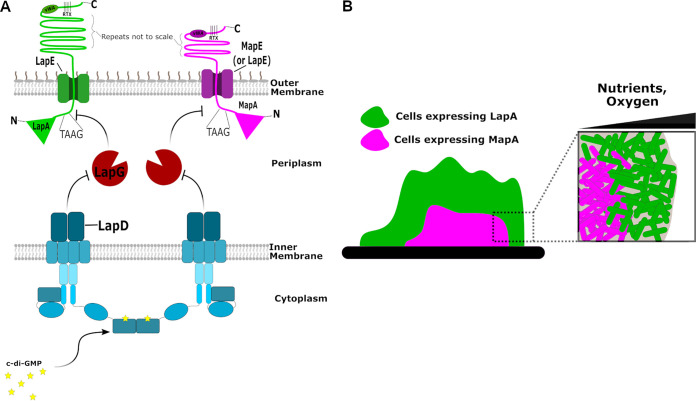
Mechanisms by which cells attach to a surface and form a biofilm are diverse and differ greatly among organisms. The Gram-negative gammaproteobacterium Pseudomonas fluorescens attaches to a surface through the localization of the large type 1-secreted RTX adhesin LapA to the outer surface of the cell. LapA localization to the cell surface is controlled by the activities of a periplasmic protease, LapG, and an inner membrane-spanning cyclic di-GMP-responsive effector protein, LapD. A previous study identified a second, LapA-like protein encoded in the P. fluorescens Pf0-1 genome: Pfl01_1463. Here, we identified specific growth conditions under which Pfl01_1463, here called MapA (medium adhesion protein A) is a functional adhesin contributing to biofilm formation. This adhesin, like LapA, appears to be secreted through a Lap-related type 1 secretion machinery, and its localization is controlled by LapD and LapG. However, differing roles of LapA and MapA in biofilm formation are achieved, at least in part, through the differences in the sequences of the two adhesins and different distributions of the expression of the lapA and mapA genes within a biofilm. LapA-like proteins are broadly distributed throughout the Proteobacteria, and furthermore, LapA and MapA are well conserved among other Pseudomonas species. Together, our data indicate that the mechanisms by which a cell forms a biofilm and the components of a biofilm matrix can differ depending on growth conditions and the matrix protein(s) expressed.IMPORTANCE Adhesins are critical for the formation and maturation of bacterial biofilms. We identify a second adhesin in P. fluorescens, called MapA, which appears to play a role in biofilm maturation and whose regulation is distinct from the previously reported LapA adhesin, which is critical for biofilm initiation. Analysis of bacterial adhesins shows that LapA-like and MapA-like adhesins are found broadly in pseudomonads and related organisms, indicating that the utilization of different suites of adhesins may be broadly important in the Gammaproteobacteria.

Keywords: Pseudomonas fluorescens; RTX; adhesin; biofilm; cyclic di-GMP.


Figures

FIG 1
FIG 1
Biofilm formation by adhesin mutants. (A to D) Quantification of biofilm formed by WT P. fluorescens Pf0-1, ΔlapA and ΔmapA single mutants, and the ΔlapA ΔmapA double mutant after 6 h of growth in K10-T medium (A), 16 h of growth in K10-T medium (B), 6 h of growth in KA medium (C), and 16 h of growth in KA medium (D). For statistical tests, hypothesis testing was conducted in GraphPad Prism 8 using two-tailed t tests. P values are indicated by asterisks as follows: *, P < 0.05; **, P < 0.01; ***, P < 0.001; nonsignificant (ns), P > 0.05. (E) Representative image of biofilm formed by WT P. fluorescens Pf0-1 and ΔlapA, ΔmapA, and ΔlapA ΔmapA mutants after 16 h of growth in the indicated medium and stained with 0.1% (wt/vol) crystal violet.
FIG 2
FIG 2
LapD and LapG contribute to MapA-dependent biofilm formation. (A) Alignment of LapA and MapA N-terminal portions generated using MUSCLE (65) and visualized using Jalview (85) with secondary structure prediction using JPred4 (83). Similar residues are indicated by color. Predicted secondary structure is indicated by colored shapes: green arrows, beta sheets; red bars, alpha helix. The LapG processing site TAAG is indicated by a red box. (B) Quantification of biofilm assay assessing biofilm formation of adhesin and regulatory mutants grown for 16 h in KA medium. (C) Quantification of biofilm assay assessing biofilm formation of adhesin and regulatory mutants grown for 16 h in K10-T medium. For statistical tests, hypothesis testing was conducted in GraphPad Prism 8 using two-tailed t tests with Holm-Sidak’s multiple comparison correction. P values are indicated by asterisks as follows: **, P < 0.01; ***, P < 0.001; ns, P > 0.05. In panel C, all asterisks denote P values of t tests between WT and the indicated mutant with Holm-Sidak’s multiple comparison correction.
FIG 3
FIG 3
MapA is localized to the cell surface. (A) Quantification of crystal violet staining of wells of a 96-well plate after 16 h of growth in KA. Results for P. fluorescens Pf0-1 in both the untagged MapA and the tagged MapA variant bearing 3 tandem HA tags are shown. The phenotype is shown either in strains carrying a functional LapA or in a strain for which the lapA gene has been deleted. When compared using Student's t test, neither P. fluorescens Pf0-1 (P = 0.25) nor the ΔlapA mutant (P = 0.9) formed a significantly different level of biofilm when bearing an HA-tagged variant of MapA. (B) Representative dot blot of cell surface-localized MapA for the indicated strains. The WT (untagged strains) and a strain deleted for both the mapA and lapA genes serve as negative controls. (C) Three independent dot blot experiments were quantified using ImageJ as follows. The pixel values for the blots were inverted for ease of plotting. The region of interest (ROI) was defined for the control LapA dot blot (not shown), and then the mean gray value was determined for each spot using the predefined ROI. The background was subtracted from each spot; the background was determined by measuring the mean gray value in a section of the blot not containing any samples. The adjusted mean pixel density was plotted here for three biological replicates. There was a significant reduction in signal for both control strains compared to the strain expressing MapA-HA as assessed by t test. ****, P < 0.001; ns, P > 0.05.
FIG 4
FIG 4
Schematic of the lap and map loci. The organization of the genes encoding the LapA and MapA adhesins and their secretion machinery is shown. Gene names are indicated above the arrows, and the P. fluorescens Pfl0-1 gene numbers are indicated below the arrows. Arrows indicate the location and direction of transcription of the ORFs. Arrow direction indicates the orientation of the gene in the genome.
FIG 5
FIG 5
Genetic evidence that MapA can utilize the Lap secretion system. (A) Biofilm formation by strains in KA medium carrying mutations in adhesin genes and genes encoding the Map secretion system outer membrane pore component. (B) Biofilm formation in KA medium for strains carrying mutations in adhesin genes and genes encoding the Lap secretion system outer membrane pore component. For statistical tests, hypothesis testing was conducted in GraphPad Prism 8 using two-tailed t tests with Holm-Sidak’s multiple comparison correction. P values are indicated by asterisks as follows: *, P < 0.05; **, P < 0.01; ***, P < 0.001; ns, P > 0.05.
FIG 6
FIG 6
Confocal spinning-disk microscopy images of biofilm formed by adhesin mutants in flow cells. The indicated strains were grown as described in Materials and Methods and incubated at room temperature under constant flow for 96 h before imaging. Shown are representative images taken from one of two biological replicates. (A) The WT forms a thick biofilm that fills most of the flow cell chamber. (B) The ΔlapA mutant is severely deficient in biofilm formation, and only small clumps of cells are observed attached to the surface. (C) The ΔmapA mutant appears able to attach to the surface of the chamber, but the thickness of the biofilm is reduced compared to that of WT. (D) The ΔlapA ΔmapA mutant results in a biofilm comprised of sparsely distributed clumps of cells.
FIG 7
FIG 7
Differential expression of lapA and mapA genes in a biofilm. (A) Schematic of adhesin reporter construction indicating the promoter and the gene encoding the fluorescent protein gene. PlapA is driving the expression of the green fluorescent protein gene, and PmapA is driving the expression of the mRuby gene. Both fluorescent protein genes have a transcriptional terminator of the rrnB gene from E. coli downstream of the genes to prevent transcriptional readthrough. (B) Confocal image of a biofilm grown in a microfluidic device. The image of a 96-h biofilm was taken with a 40× oil immersion lens objective. Green is the GFP channel excited by a 488-nm laser and indicates lapA-expressing cells. Magenta is the mRuby channel excited by a 560-nm laser and indicates mapA-expressing cells. Shown is a representative image taken from one of two biological replicates.
FIG 8
FIG 8
Expressing mapA under the control of the lapA promoter does not rescue loss of LapA function. (A and B) Quantification of biofilm formed by WT P. fluorescens Pf0-1 and ΔlapA, Pswap, and ΔlapA Pswap mutants after 6 h of growth in KA medium (A) or 16 h of growth in KA medium (B). (C) Cell surface expression of MapA in the WT and Pswap strains. The cell surface expression of LapA is shown as an additional control. Shown is one representative experiment of three biological replicates. (D) Quantification of the cell surface expression of HA-MapA in the WT and Pswap strains and of HA-LapA in the WT strain, as indicated. Quantification was performed as described in the legend for Fig. 3. For statistical tests, all hypothesis testing was conducted using a two-tailed t test. *, P < 0.05; ns, P > 0.05.
FIG 9
FIG 9
Size distribution of LapA-like proteins encoded by selected genera. All organisms found to encode both LapD and LapG and putative LapA-like proteins were grouped based on whether they are predicted to encode a single or multiple LapA-like proteins. We then assessed the distribution of the protein sizes of adhesins encoded by organisms with a single (blue shading) or multiple adhesins (orange shading). Shown are density plots representing the size distributions of LapA-like proteins found in the following genera: Vibrio (A), Shewanella (B), and Pseudomonas (C).
FIG 10
FIG 10
Phylogenetic distribution of the Lap proteins among members of the Pseudomonas genus. Shown is a phylogenetic tree of Pseudomonas lineages. The innermost colored ring around the tree indicates whether LapD and LapG are encoded by the indicated species (as determined by finding the intersection of the species lists retrieved from the NCBI Conserved Domain Database for pfam06035 and pfam16448 domains) and how many LapA-like proteins were identified in that species using the analysis described in Materials and Methods. The outermost three rings indicate the percent similarity between the LapA-like proteins identified in each species and either LapA or MapA. Amino acid sequences of putative LapA-like proteins were aligned with LapA and MapA in pairwise alignments using MUSCLE (65) (https://github.com/GeiselBiofilm/Collins-MapA/tree/master/Supplemental_File_Alignments), and the percent sequence similarity was determined by counting the positions identified as similar by the MUSCLE program. The percent similarity of whichever was most similar (either LapA or MapA) is indicated, with darker color indicating higher similarity. The order of the three rings indicating similarity with LapA and MapA is organized by the relative size of the LapA-like proteins encoded by each organism. The innermost of the three rings is the largest LapA-like protein encoded by that organism. The second and third rings represent alignments of the second- and third-largest LapA-like proteins, respectively, identified in organisms that are predicted to encode multiple LapA-like proteins. The multilocus sequence analysis (MLSA) phylogenetic tree here shows the clustering of representatives Pseudomonas species found in the GenBank database based on the analysis of concatenated alignments of 16S rRNA, gyrB, rpoB, and rpoD genes. Distance was calculated using the Jukes-Cantor model, and the tree was constructed using neighbor joining. The P. aeruginosa, P. fluorescens, and P. pertucinogena lineages described by Mulet et al. (64) are highlighted with the indicated colors. The namesake species of the groups described by García-Valdés and Lalucat (86) are in bold font. The P. aeruginosa and P. fluorescens lineages described by Mulet et al. (64) and the P. pertucinogena lineage described by Peix et al. (63) are also apparent in our tree and are indicated using the indicated shading (colored according to the lineages described by Peix et al. [63]). The most notable difference between the tree presented here and previously reported trees is the presence of a distinct P. luteola and P. duriflava clade, while Peix et al. (63) presented them as part of the monophyletic P. aeruginosa lineage. However, the placement of P. luteola within the P. aeruginosa lineage is not strongly supported. The study by Mulet et al. (64) placed P. luteola outside the P. aeruginosa lineage, and the bootstrap support for Peix et al. (63) positioning the P. luteola and P. duriflava clade within the P. aeruginosa lineage is less than 50%. Three other species were not present in previously published phylogenies of Pseudomonas and do not fit neatly into the three lineages described previously: P. pohangensis, P. hussainii, and P. acidophila. Both P. pohangensis and P. hussainii are positioned between the P. pertucinogena lineage and the other two lineages. P. acidophila is positioned outside the rest of the genus, consistent with a recent study that argued that P. acidophila should be reclassified as Paraburkholderia acidophila (87). While the P. pertucinogena lineage described by Peix et al. (63) is well supported by the tree we present here, the species P. pertucinogena is absent from our tree. This is because we included only species present in the GenBank database in our tree. At the time of writing, there is an available genome sequence record of P. pertucinogena (BioProject accession no. PRJNA235123), but the absence of an assembled genome from GenBank means that the organism was not included in our analysis of the distribution of LapA-like proteins. Nevertheless, the tree topology is similar overall to the previously reported trees outlined above.
FIG 11
FIG 11
Model of the mechanisms by which LapA and MapA contribute to biofilm formation. (A) Model for c-di-GMP regulation of cell surface localization of LapA and MapA. Representations of the LapA (left) and MapA (right) adhesins anchored in the outer membrane via LapE and MapE, respectively, are shown. Also shown is the periplasmic protease LapG and the inner membrane, c-di-GMP receptor LapD, which regulates LapG activity. (B) Representation of the expression of lapA and mapA in a biofilm. Indicated are possible roles for nutrient and/or oxygen limitation in controlling the expression of the mapA gene.

Similar articles

Cited by

References

    1. Flemming H, Wuertz S. 2019. Bacteria and archaea on Earth and their abundance in biofilms. Nat Rev Microbiol 17:247–260. doi:10.1038/s41579-019-0158-9. - DOI - PubMed
    1. van Wolferen M, Orell A, Albers S. 2018. Archaeal biofilm formation. Nat Rev Microbiol 16:699–713. doi:10.1038/s41579-018-0058-4. - DOI - PubMed
    1. Fanning S, Mitchel A. 2012. Fungal biofilms. PLoS Pathog 8:e1002585. doi:10.1371/journal.ppat.1002585. - DOI - PMC - PubMed
    1. Mann EE, Wozniak DJ. 2012. Pseudomonas biofilm matrix composition and niche biology. FEMS Microbiol Rev 36:893–916. doi:10.1111/j.1574-6976.2011.00322.x. - DOI - PMC - PubMed
    1. Van Houdt R, Michiels CW. 2005. Role of bacterial cell surface structures in Escherichia coli biofilm formation. Res Microbiol 156:626–633. doi:10.1016/j.resmic.2005.02.005. - DOI - PubMed

Publication types

MeSH terms

Substances

LinkOut - more resources