. 2020 Jul 21;117(29):16816-16823.
doi: 10.1073/pnas.2002411117. Epub 2020 Jul 6.

Six hundred years of South American tree rings reveal an increase in severe hydroclimatic events since mid-20th century

Affiliations

Six hundred years of South American tree rings reveal an increase in severe hydroclimatic events since mid-20th century

Mariano S Morales et al. Proc Natl Acad Sci U S A. .

Abstract

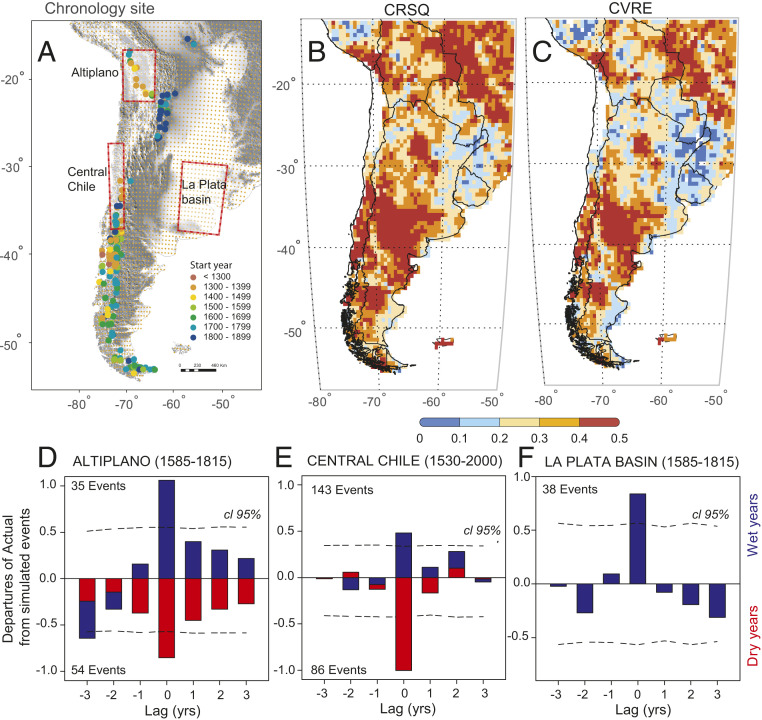
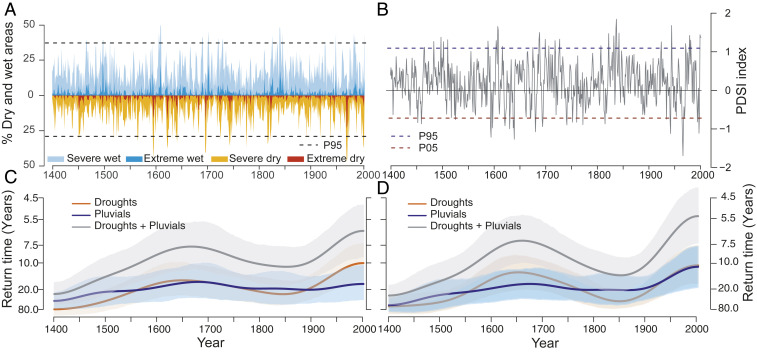
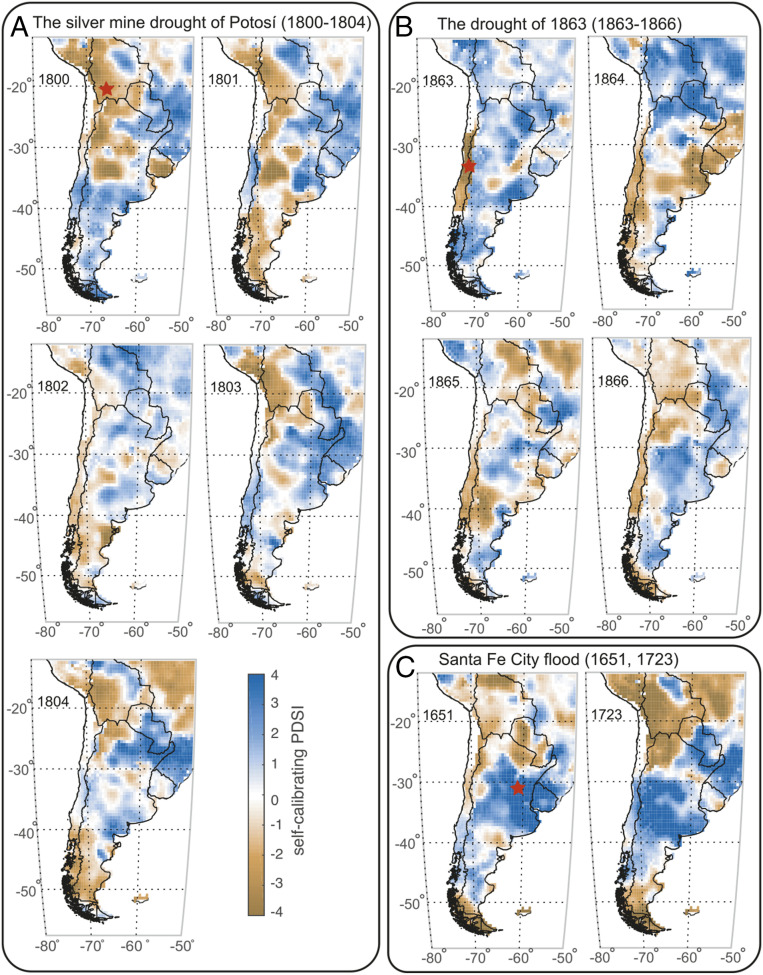
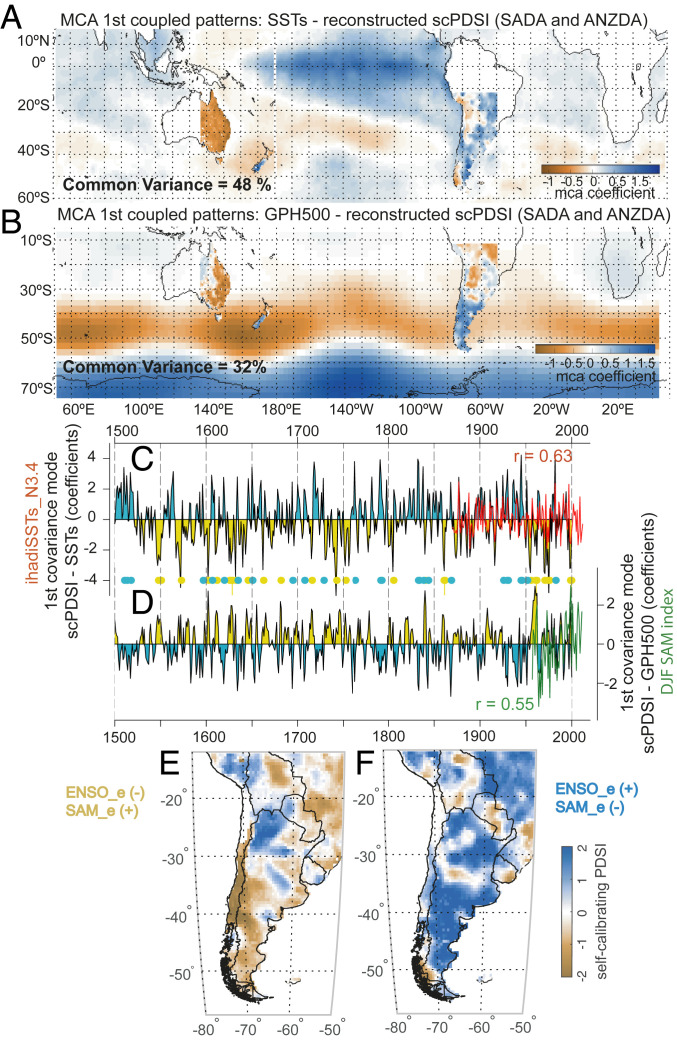
South American (SA) societies are highly vulnerable to droughts and pluvials, but lack of long-term climate observations severely limits our understanding of the global processes driving climatic variability in the region. The number and quality of SA climate-sensitive tree ring chronologies have significantly increased in recent decades, now providing a robust network of 286 records for characterizing hydroclimate variability since 1400 CE. We combine this network with a self-calibrated Palmer Drought Severity Index (scPDSI) dataset to derive the South American Drought Atlas (SADA) over the continent south of 12°S. The gridded annual reconstruction of austral summer scPDSI is the most spatially complete estimate of SA hydroclimate to date, and well matches past historical dry/wet events. Relating the SADA to the Australia-New Zealand Drought Atlas, sea surface temperatures and atmospheric pressure fields, we determine that the El Niño-Southern Oscillation (ENSO) and the Southern Annular Mode (SAM) are strongly associated with spatially extended droughts and pluvials over the SADA domain during the past several centuries. SADA also exhibits more extended severe droughts and extreme pluvials since the mid-20th century. Extensive droughts are consistent with the observed 20th-century trend toward positive SAM anomalies concomitant with the weakening of midlatitude Westerlies, while low-level moisture transport intensified by global warming has favored extreme rainfall across the subtropics. The SADA thus provides a long-term context for observed hydroclimatic changes and for 21st-century Intergovernmental Panel on Climate Change (IPCC) projections that suggest SA will experience more frequent/severe droughts and rainfall events as a consequence of increasing greenhouse gas emissions.

Keywords: South America hydroclimate; Southern Hemisphere climate modes; drought atlas; extreme hydroclimate events; palaeoclimate reconstruction.


Conflict of interest statement

The authors declare no competing interest.

Figures

Fig. 1.
Fig. 1.
SADA domain and verifications based on instrumental climate and historical documents. (A) Map of the DJF scPDSI target field (small orange dots mark grid-point centers) and the network of 286 tree ring chronologies used for reconstruction (circles colored to indicate start year). (B) Calibration-period regression coefficient of determination (CRSQ); the white region over northern Chile indicates where the reconstruction was not performed. (C) Calibration period leave-one-out cross-validation reduction of error (CVRE). (DF) Superposed epoch analyses (SEAs) for reconstructed scPDSI (red rectangles in map) during the dry/wet events recorded by historical documents from (D) Potosí, Bolivia (1585 to 1807), (E) central Chile (1530 to 2000), and (F) Santa Fe city (1585 to 1815; La Plata basin). The red/blue bars represent scPDSI departure from normal conditions for a 9-y window (t − 4 to t + 4) based on 1,000 Monte Carlo simulations for the dry/wet historical events, respectively. The short dashed lines represent the 95% confidence limits.
Fig. 2.
Fig. 2.
Spatial magnitude and frequency of extreme drought and pluvial events in the SADA domain. (A) Percentage of area under severely dry (scPDSI −2, orange) and extremely dry (scPDSI −4, red) conditions, and for severely wet (scPDSI +2, light blue) and extremely wet (scPDSI +4, blue) conditions. The black short dashed lines indicate 95% percentiles of the distribution, from which severe widespread dry/wet events were selected for the return time analysis in C. (B) Average of SADA reconstructions over the entire study domain. The red and blue short dashed lines indicate the 5% and 95% percentiles of the distribution, respectively, from which extreme drought/wet events were selected for the return time analysis in D. (C and D) Time-varying frequency of the occurrences of severe widespread dry/wet scPDSI events and extreme dry/wet scPDSI events, respectively, between 1400 and 2000. A kernel smoothing method was used with a bandwidth of 50 y (49). The shaded areas (gray, blue, and orange) represent 95% confidence intervals based on 1,000 bootstrap simulations.
Fig. 3.
Fig. 3.
Austral summer scPDSI maps of historical extremely dry/wet events in three regions from the SADA domain. (A) The silver mine drought of Potosí, Bolivia (1800 to 1804). (B) The central Chile drought of 1863 (1863 to 1866). (C) Santa Fe city floods (1651, 1723). The red stars indicate the geographic location of these recorded historical events.
Fig. 4.
Fig. 4.
Major SH forcing of hydroclimate variability and impacts on SADA composite maps. (A) Coupled spatial patterns of the leading MCA mode between SADA–ANZDA scPDSI and austral summer SSTs over the common period 1901 to 2000. (B) Coupled spatial patterns of the leading MCA mode between SADA–ANZDA scPDSI and austral summer geopotential height (500 hpa) over the common period 1948 to 2015. Temporal variability of the scPDSI leading modes for (C) ENSO and (D) SAM, resulting from the MCA analysis of A and B. Pearson’s correlation coefficients (r) between the ENSO-e and SAM-e modes (black lines) and the DJF_NINO3.4 (red line) and SAM_DJF (green line) indices are given in red and green text in C and D, respectively. The yellow (light blue) dots indicate simultaneously anomalous negative (positive) ENSO-e and positive (negative) SAM-e index values from the MCA estimates. Composite SADA maps of the (E) 25 events of simultaneously anomalous negative ENSO-e and positive SAM-e years, and the (F) 26 events of simultaneously anomalous positive ENSO-e and negative SAM-e years.

References

    1. Prieto M. R. et al. ., “Sequías extremas en Mendoza durante el siglo XX y principios del XXI. Administración de la carencia y conflictos socio-políticos” in Medio Ambiente y Transformación Rural en la Argentina Contemporánea, Zarrilli G., Ruffini M., Eds. (Universidad Nacional de Quilmes, Buenos Aires, 2020), pp. 1–30.
    1. Arrese J. A., “16th Session of the Commission on Sustainable Development” (United Nations, New York, 2008).
    1. Garreaud R. D. et al. ., The 2010–2015 megadrought in central Chile: Impacts on regional hydroclimate and vegetation. Hydrol. Earth Syst. Sci. 21, 6307–6327 (2017).
    1. Neukom R. et al. ., Facing unprecedented drying of the Central Andes? Precipitation variability over the period AD 1000–2100. Environ. Res. Lett. 10, 84017 (2015).
    1. Vera C. et al. ., Toward a unified view of the American monsoon systems. J. Clim. 19, 4977–5000 (2006).

Publication types