

Selective amplification of ipRGC signals accounts for interictal photophobia in migraine
- PMID: 32632006
- PMCID: PMC7382295
- DOI: 10.1073/pnas.2007402117
Selective amplification of ipRGC signals accounts for interictal photophobia in migraine
Abstract
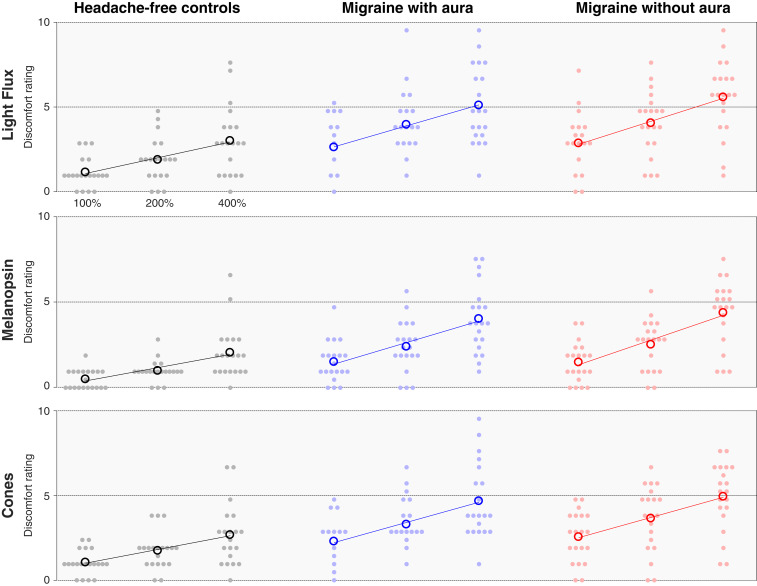
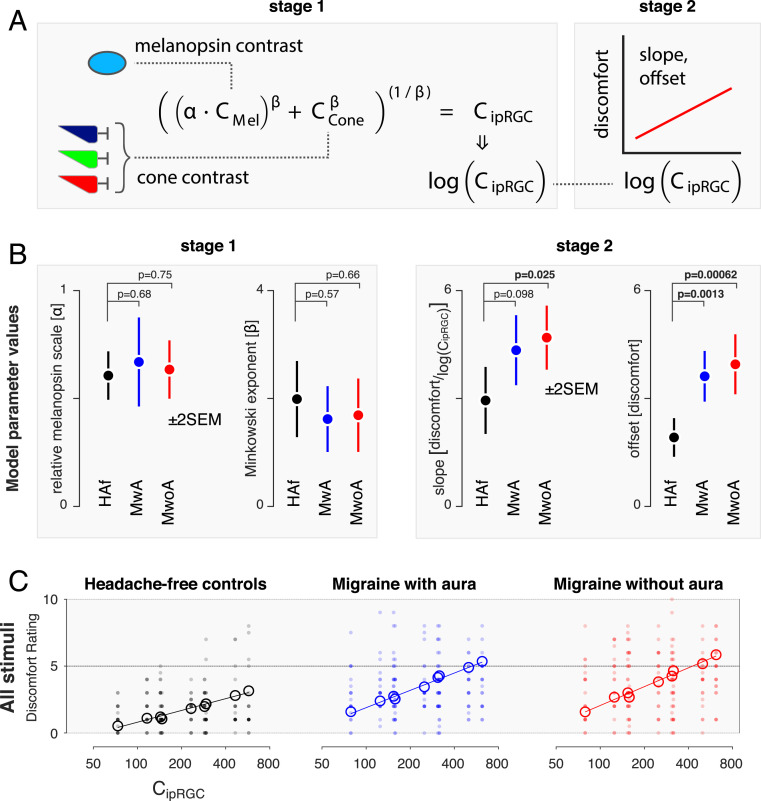
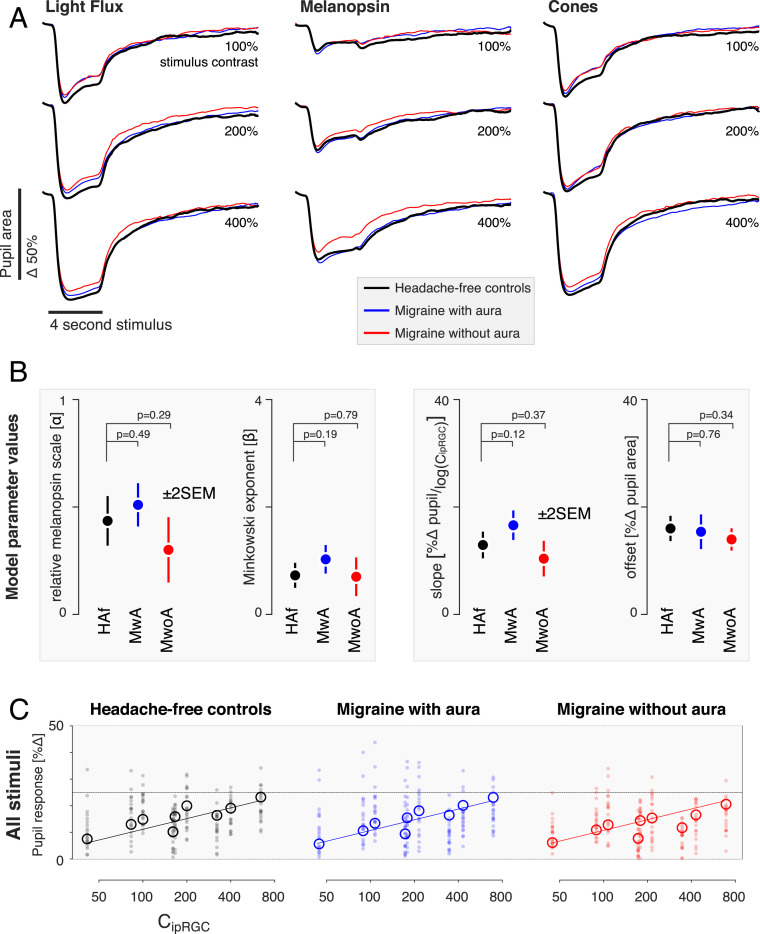
Second only to headache, photophobia is the most debilitating symptom reported by people with migraine. While the melanopsin-containing intrinsically photosensitive retinal ganglion cells (ipRGCs) are thought to play a role, how cone and melanopsin signals are integrated in this pathway to produce visual discomfort is poorly understood. We studied 60 people: 20 without headache and 20 each with interictal photophobia from migraine with or without visual aura. Participants viewed pulses of spectral change that selectively targeted melanopsin, the cones, or both and rated the degree of visual discomfort produced by these stimuli while we recorded pupil responses. We examined the data within a model that describes how cone and melanopsin signals are weighted and combined at the level of the retina and how this combined signal is transformed into a rating of discomfort or pupil response. Our results indicate that people with migraine do not differ from headache-free controls in the manner in which melanopsin and cone signals are combined. Instead, people with migraine demonstrate an enhanced response to integrated ipRGC signals for discomfort. This effect of migraine is selective for ratings of visual discomfort, in that an enhancement of pupil responses was not seen in the migraine group, nor were group differences found in surveys of other behaviors putatively linked to ipRGC function (chronotype, seasonal sensitivity, presence of a photic sneeze reflex). By revealing a dissociation in the amplification of discomfort vs. pupil response, our findings suggest a postretinal alteration in processing of ipRGC signals for photophobia in migraine.
Keywords: ipRGCs; melanopsin; migraine; photophobia.
Conflict of interest statement
Competing interest statement: E.A.K. has received royalties from a patent shared with Alder Biopharmaceuticals. The remaining authors declare that they have no relevant financial interests that relate to the research described in this paper.
Figures

Similar articles
-
Reflexive Eye Closure in Response to Cone and Melanopsin Stimulation: A Study of Implicit Measures of Light Sensitivity in Migraine.Neurology. 2021 Oct 26;97(17):e1672-e1680. doi: 10.1212/WNL.0000000000012734. Epub 2021 Sep 7. Neurology. 2021. PMID: 34493620 Free PMC article.
-
Melanopsin hypersensitivity dominates interictal photophobia in migraine.Cephalalgia. 2021 Feb;41(2):217-226. doi: 10.1177/0333102420963850. Epub 2020 Oct 12. Cephalalgia. 2021. PMID: 33040593
-
Temporal characteristics of melanopsin inputs to the human pupil light reflex.Vision Res. 2015 Feb;107:58-66. doi: 10.1016/j.visres.2014.12.001. Epub 2014 Dec 10. Vision Res. 2015. PMID: 25497360 Free PMC article.
-
Current understanding of photophobia, visual networks and headaches.Cephalalgia. 2019 Nov;39(13):1623-1634. doi: 10.1177/0333102418784750. Epub 2018 Jun 25. Cephalalgia. 2019. PMID: 29940781 Free PMC article. Review.
-
Photophobia: When Light Hurts, a Review.Curr Neurol Neurosci Rep. 2018 Jul 30;18(9):62. doi: 10.1007/s11910-018-0864-0. Curr Neurol Neurosci Rep. 2018. PMID: 30058044 Review.
Cited by
-
Melanopic stimulation does not alter psychophysical threshold sensitivity for luminance flicker.Sci Rep. 2021 Oct 11;11(1):20167. doi: 10.1038/s41598-021-99684-0. Sci Rep. 2021. PMID: 34635745 Free PMC article.
-
The Retinal Basis of Light Aversion in Neonatal Mice.J Neurosci. 2022 May 18;42(20):4101-4115. doi: 10.1523/JNEUROSCI.0151-22.2022. Epub 2022 Apr 8. J Neurosci. 2022. PMID: 35396331 Free PMC article.
-
Assessing migraine patients with multifocal pupillographic objective perimetry.BMC Neurol. 2021 May 26;21(1):211. doi: 10.1186/s12883-021-02239-z. BMC Neurol. 2021. PMID: 34039302 Free PMC article. Clinical Trial.
-
Correlation between higher-order aberration and photophobia after cataract surgery.PLoS One. 2022 Sep 15;17(9):e0274705. doi: 10.1371/journal.pone.0274705. eCollection 2022. PLoS One. 2022. PMID: 36107829 Free PMC article.
-
Impact of domestic white LED light on cognitive functions and amelioration of blue light blocking lens (BBL) on healthy adults.Neurobiol Sleep Circadian Rhythms. 2025 Apr 17;18:100119. doi: 10.1016/j.nbscr.2025.100119. eCollection 2025 May. Neurobiol Sleep Circadian Rhythms. 2025. PMID: 40342909 Free PMC article.
References
-
- Drummond P. D., A quantitative assessment of photophobia in migraine and tension headache. Headache 26, 465–469 (1986). - PubMed
Publication types
MeSH terms
Substances
Grants and funding
LinkOut - more resources
Full Text Sources
Medical
Miscellaneous
