. 2020 Jul 21;117(29):17074-17083.
doi: 10.1073/pnas.2003852117. Epub 2020 Jul 6.

The emergent interactions that govern biodiversity change

Affiliations

The emergent interactions that govern biodiversity change

James S Clark et al. Proc Natl Acad Sci U S A. .

Abstract

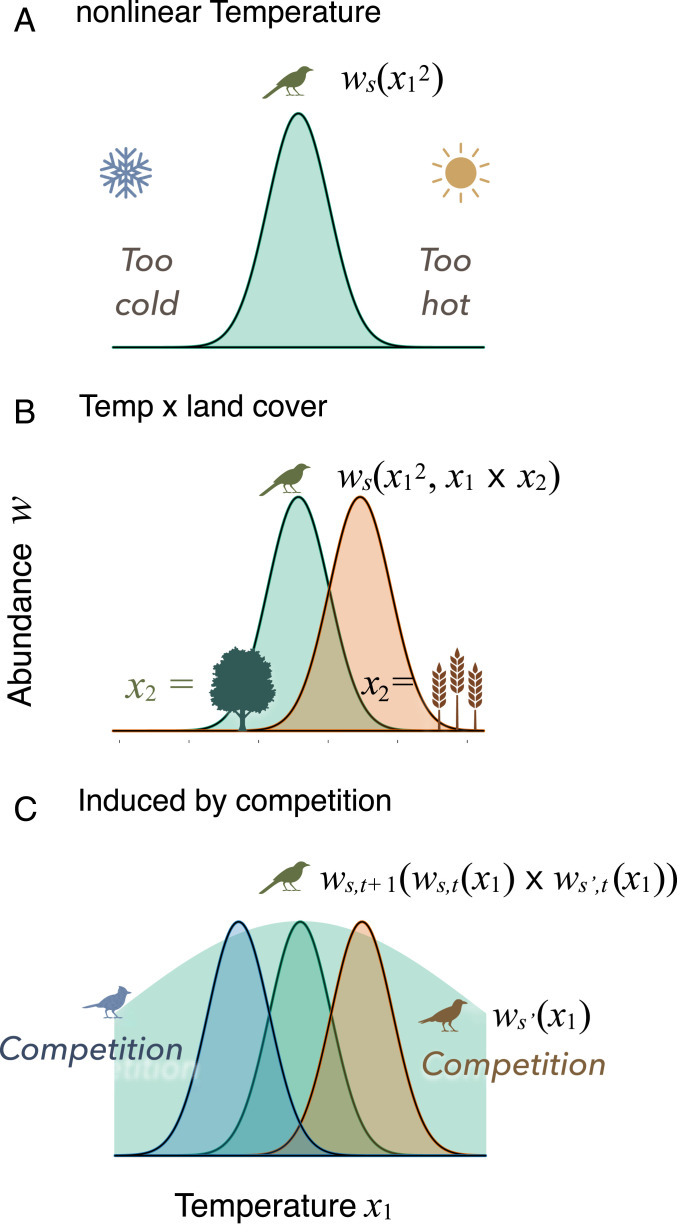
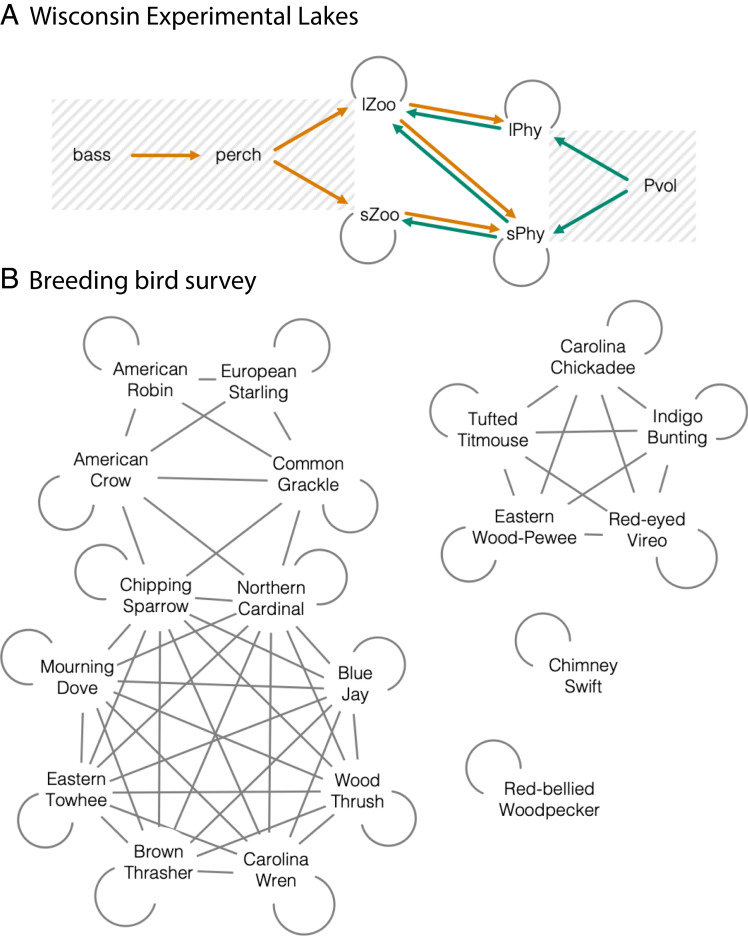
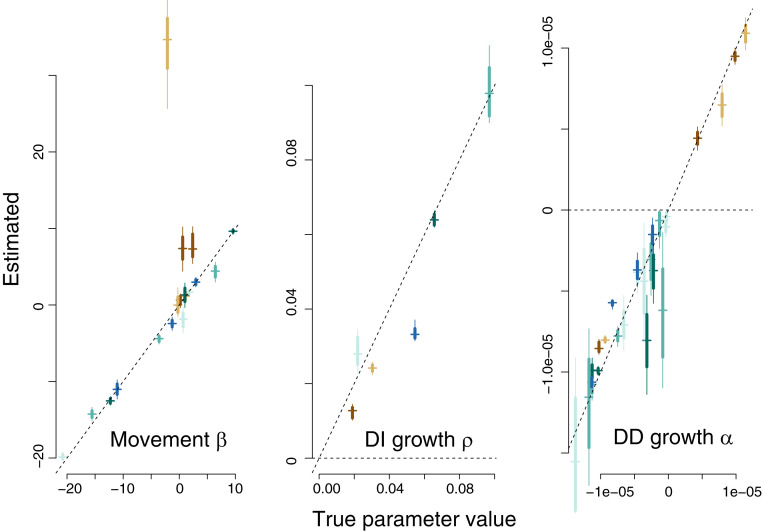
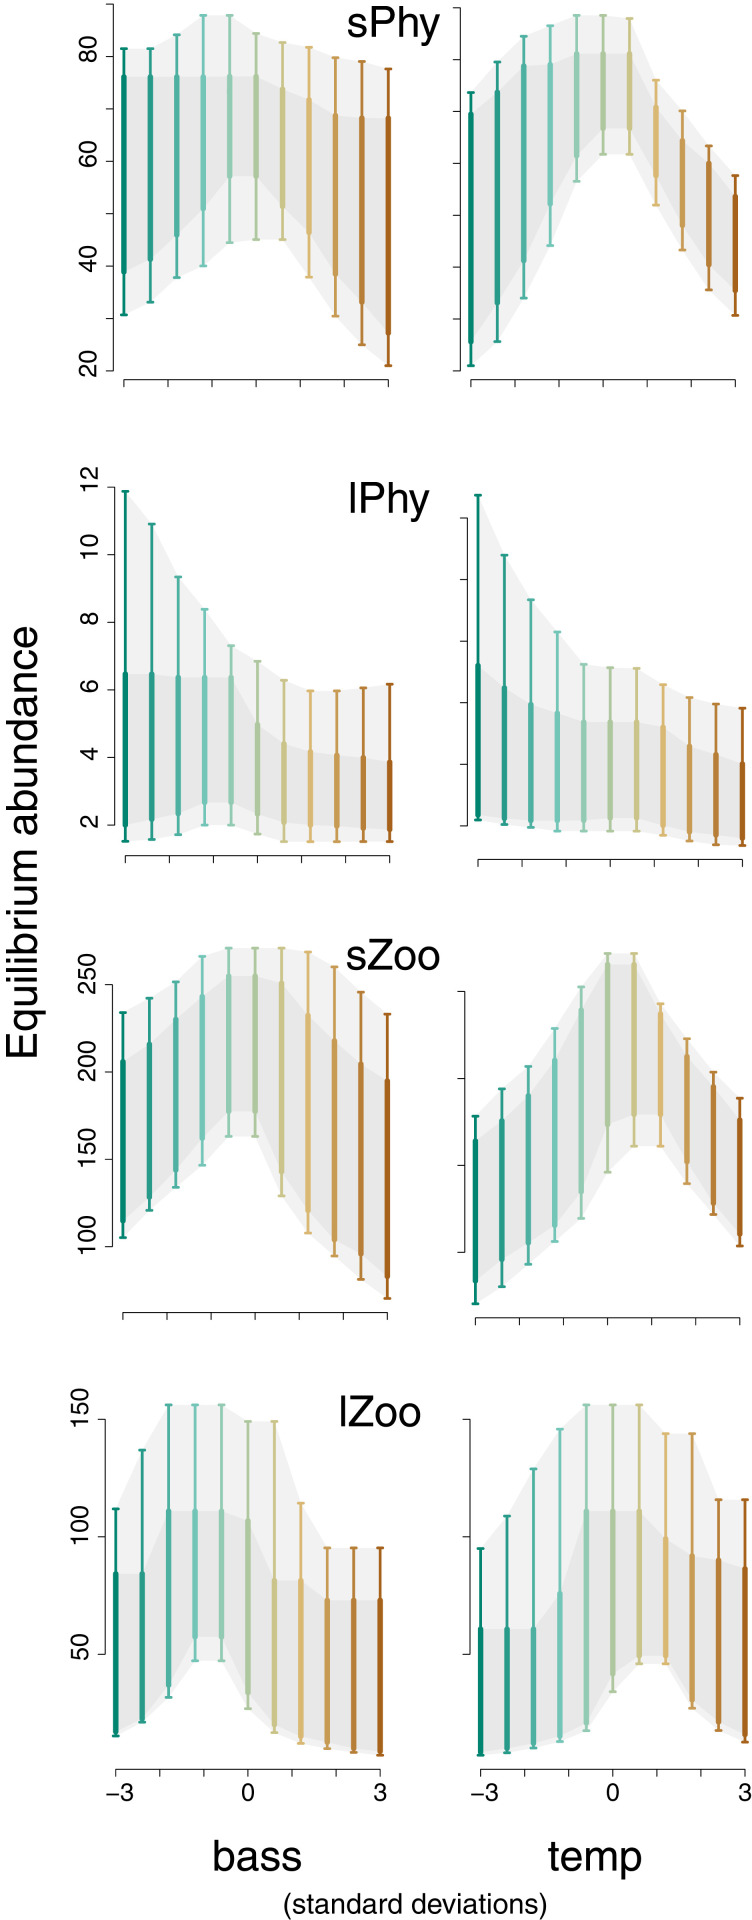
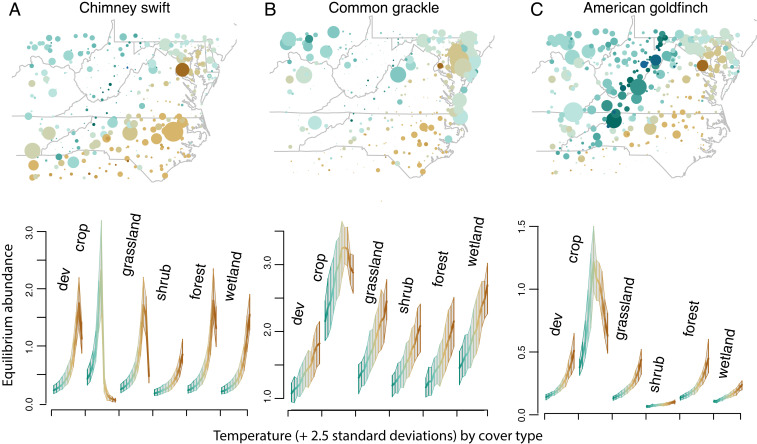
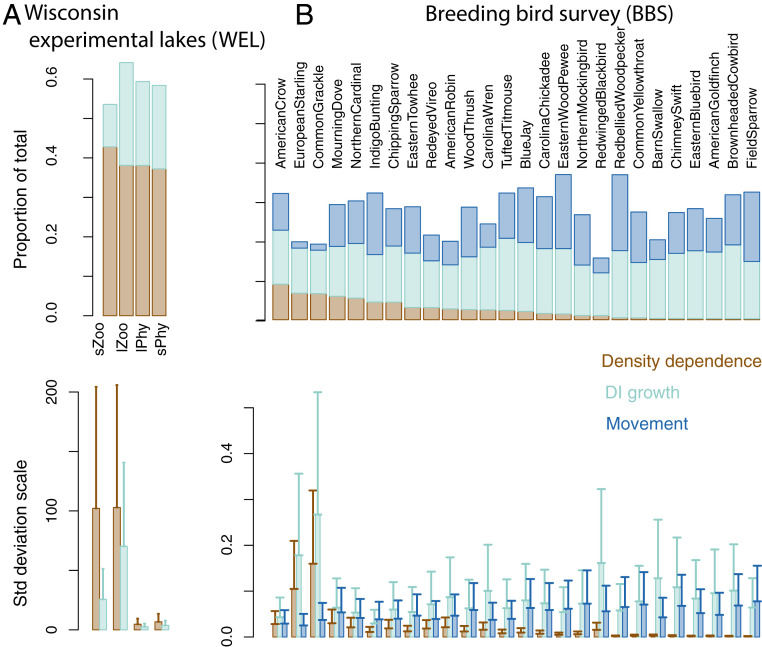
Observational studies have not yet shown that environmental variables can explain pervasive nonlinear patterns of species abundance, because those patterns could result from (indirect) interactions with other species (e.g., competition), and models only estimate direct responses. The experiments that could extract these indirect effects at regional to continental scales are not feasible. Here, a biophysical approach quantifies environment- species interactions (ESI) that govern community change from field data. Just as species interactions depend on population abundances, so too do the effects of environment, as when drought is amplified by competition. By embedding dynamic ESI within framework that admits data gathered on different scales, we quantify responses that are induced indirectly through other species, including probabilistic uncertainty in parameters, model specification, and data. Simulation demonstrates that ESI are needed for accurate interpretation. Analysis demonstrates how nonlinear responses arise even when their direct responses to environment are linear. Applications to experimental lakes and the Breeding Bird Survey (BBS) yield contrasting estimates of ESI. In closed lakes, interactions involving phytoplankton and their zooplankton grazers play a large role. By contrast, ESI are weak in BBS, as expected where year-to-year movement degrades the link between local population growth and species interactions. In both cases, nonlinear responses to environmental gradients are induced by interactions between species. Stability analysis indicates stability in the closed-system lakes and instability in BBS. The probabilistic framework has direct application to conservation planning that must weigh risk assessments for entire habitats and communities against competing interests.

Keywords: GJAM; climate change; food web dynamics; species interactions.


Conflict of interest statement

The authors declare no competing interest.

Figures

Fig. 1.
Fig. 1.
Nonlinear and interaction responses to environment. (A) Nonlinear response of species s to a temperature gradient (x1) is fitted with a model containing a quadratic term, x12. (B) Combined effects of temperature and land cover (x2) are fitted with an additional interaction term, x1×x2, where response to temperature might differ in forests and fields. (C) Alternatively, nonlinear and interaction responses enter indirectly though products with other species s (blue and brown) that depend on temperature x1, but require the time dimension. The background shading in C describes Hutchinson’s concept of the fundamental niche that might be realized by species s in the absence of other species.
Fig. 2.
Fig. 2.
Species assemblages that include ESIs. (A) WEL data were analyzed as a closed system over multiple years with competition for nutrients and light between sPhy and lPhy. Treatments include manipulation of largemouth bass predation on the perch that consume lZoo and nutrient enrichment (Pvol). Both zooplankton groups are subject to predation from small planktivorous fish (perch). The sZoo and lZoo feed on phytoplankton, with sZoo restricted by size to feed on sPhy. Gray lines are competition (negative), and orange and green arrows indicate the negative and positive effects of predation, respectively. (B) BBS data include guilds of species that might compete based on diet and habit.
Fig. 3.
Fig. 3.
Parameter recovery when the correct model (that includes the three terms of gjamTime in Eq. 1) is fitted to data, including movement (β), DI growth (ρ), and DD growth (α).
Fig. 4.
Fig. 4.
Predictive equilibrium abundances w* along the bass abundance (Left) and temperature (temp) (Right) gradients for four species groups in the WEL example. Envelopes bound 68% and 95% predictive intervals.
Fig. 5.
Fig. 5.
Predictive equilibrium abundances w* along a temperature gradient (cold green to warm brown), with a response curve for each of six land covers, including (A) chimney swift, (B) common grackle, and (C) American goldfinch. Maps show mean counts per observation effort by BBS route since 1996. Temperature responses across cover types demonstrate nonlinearities and interactions, neither of which are specified in the model. The land-cover type “dev” refers to developed lands.
Fig. 6.
Fig. 6.
Contributions to dynamics in contrasting food webs. Movement (light blue) in B comes from redistribution of birds from year to year; it is not included in the WEL example in A. DI growth (light blue) is high where environmental variables play a large role. DD (brown) comes through species interactions. On a proportionate basis (Upper), DD is more important in the closed lake food web, where interactions are comparatively strong. Species groups in A are sZoo, lZoo, and small and large algae (sPhy, lPhy). Lower plots show SDs for the three contributions on the observation scale.

References

    1. Hutchinson G., Concluding remarks. Cold Spring Harbor Symp. Quant. Biol. 22, 415–427 (1957).
    1. Paine R. T., Food webs—Road maps of interactions or grist for theoretical development. Ecology 69, 1648–1654 (1988).
    1. Shaner P., Macko S., Trophic shifts of a generalist consumer in response to resource pulses. PloS One 6, e17970 (2011). - PMC - PubMed
    1. Novak M., et al. , Predicting community responses to perturbations in the face of imperfect knowledge and network complexity. Ecology 92, 836–846 (2011). - PubMed
    1. Calabrese J. M., Certain G., Kraan C., Dormann C. F., Stacking species distribution models and adjusting bias by linking them to macroecological models. Global Ecol. Biogeogr. 23, 99–112 (2014).

Publication types

LinkOut - more resources