. 2020 Jul 21;117(29):17288-17295.
doi: 10.1073/pnas.2001105117. Epub 2020 Jul 6.

How frequency hopping suppresses pulse-echo ambiguity in bat biosonar

Affiliations

How frequency hopping suppresses pulse-echo ambiguity in bat biosonar

Chen Ming et al. Proc Natl Acad Sci U S A. .

Abstract

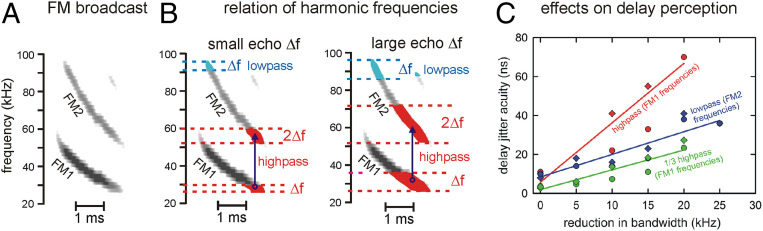
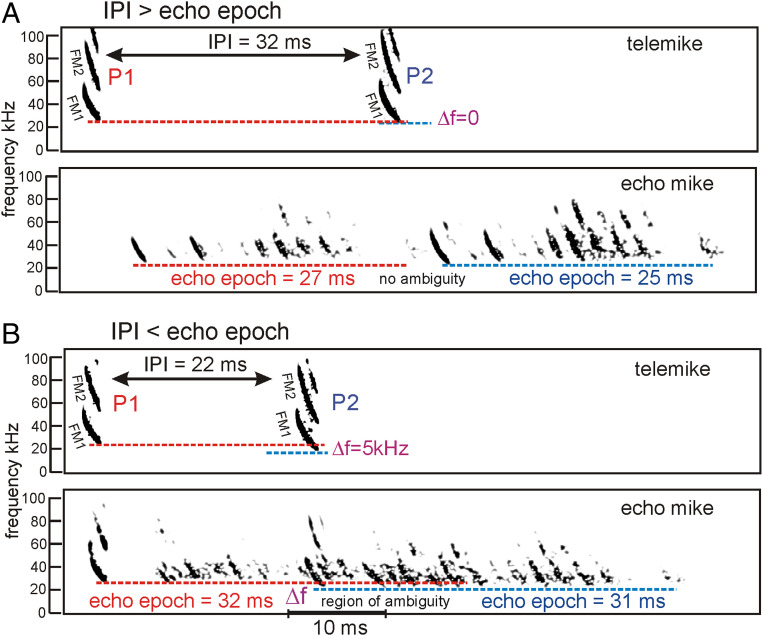
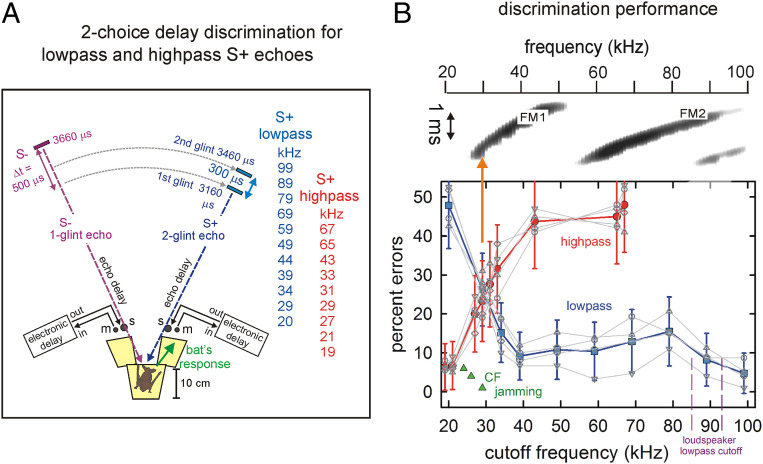
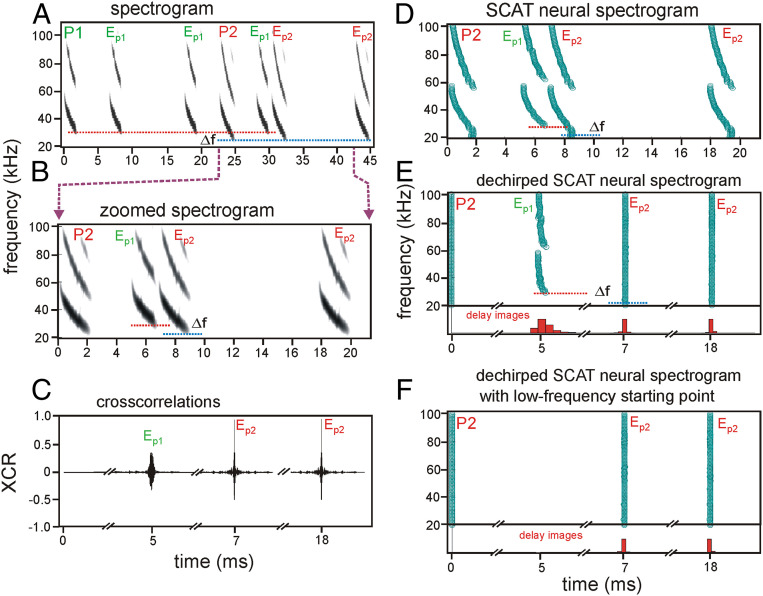
Big brown bats transmit wideband FM biosonar sounds that sweep from 55 to 25 kHz (first harmonic, FM1) and from 110 to 50 kHz (second harmonic, FM2). FM1 is required to perceive echo delay for target ranging; FM2 contributes only if corresponding FM1 frequencies are present. We show that echoes need only the lowest FM1 broadcast frequencies of 25 to 30 kHz for delay perception. If these frequencies are removed, no delay is perceived. Bats begin echo processing at the lowest frequencies and accumulate perceptual acuity over successively higher frequencies, but they cannot proceed without the low-frequency starting point in their broadcasts. This reveals a solution to pulse-echo ambiguity, a serious problem for radar or sonar. In dense, extended biosonar scenes, bats have to emit sounds rapidly to avoid collisions with near objects. But if a new broadcast is emitted when echoes of the previous broadcast still are arriving, echoes from both broadcasts intermingle, creating ambiguity about which echo corresponds to which broadcast. Frequency hopping by several kilohertz from one broadcast to the next can segregate overlapping narrowband echo streams, but wideband FM echoes ordinarily do not segregate because their spectra still overlap. By starting echo processing at the lowest frequencies in frequency-hopped broadcasts, echoes of the higher hopped broadcast are prevented from being accepted by lower hopped broadcasts, and ambiguity is avoided. The bat-inspired spectrogram correlation and transformation (SCAT) model also begins at the lowest frequencies; echoes that lack them are eliminated from processing of delay and no longer cause ambiguity.

Keywords: bat biosonar; clutter suppression; echo ambiguity; echolocation; sonar image.


Conflict of interest statement

The authors declare no competing interest.

Figures

Fig. 1.
Fig. 1.
Role of FM harmonics in echo delay perception. (A) FM broadcast spectrogram has two down-sweeping harmonics (FM1: 55 to 25 kHz, FM2: 100 to 50 kHz). (B) Expected effects of low-pass (blue symbols and text) and high-pass (red symbols and text) filtering of echo spectra on delay acuity. Slight low-pass filtering of echoes by a small Δf = 4 kHz (narrow blue area at top of FM2 sweep) truncates the upper end of the echo spectrum by only that amount. Stronger low-pass filtering by larger Δf = 10 kHz (wider blue area) still only affects the upper end of FM2. In contrast, slight high-pass filtering by a small Δf = 4 kHz (narrow red area at lower end of FM1 sweep) also removes the corresponding second harmonic by 2Δf = 8 kHz from FM2 (vertical blue arrow projecting to wider red segment at lower end of FM2), for a total frequency loss of 3Δf = 12 kHz. More extensive high-pass filtering by a large Δf = 14 kHz (broad red segment of FM1 sweep) also removes 2Δf = 28 kHz from FM2 (wider red segment of FM2), for a total frequency loss of 3Δf = 42 kHz. (C) Removal of lower FM1 frequencies reduces delay acuity 3 times more than removal of the same bandwidth in upper FM2 frequencies (replotted from ref. 7). Thresholds for delay acuity by two big brown bats detecting small changes in delay (vertical axis; circles and diamonds) in a series of echoes with different high-pass and low-pass cutoff frequencies expressed as reductions in frequency content (horizontal axis, Δf in kHz). Removing frequencies from the top of FM2 (115 dB/octave cutoffs from 89 down to 55 kHz) increases delay change detection thresholds from 10 to 36 ns (blue data points and regression line); removing frequencies from the bottom of FM1 (115 dB/octave cutoffs from 15 up to 35 kHz) increases thresholds from 10 to 71 ns (red data points and regression line). From spectrograms in A, the slope of the high-pass results should be 3 times steeper than the slope of the low-pass results because removal of FM1 frequencies is magnified by removal of corresponding FM2 frequencies. The high-pass data also are rescaled vertically by 1/3 (green data points and regression line), which now parallels the low-pass results.
Fig. 2.
Fig. 2.
Pulse-echo ambiguity and frequency hopping in FM bat sonar. Examples of spectrograms for successive big brown bat FM biosonar broadcast pulses (P1, P2) recorded by a miniature telemike attached to the flying bat (data replotted from ref. 16). A second echo microphone recorded echoes reflected back to the bat from multiple obstacles while the bat flew toward them. Each broadcast contains two prominent harmonic sweeps (FM1, FM2). (A) IPI of 32 ms is longer than the echo epoch of 27 ms, so all echoes of P1 are received before P2 is transmitted, and no ambiguity occurs. P1 ends at about the same frequency as P2 (Δf = 0; no frequency hopping). (B) IPI of 22 ms is shorter than the echo epoch of 32 ms, too short for all echoes of P1 to be received before P2 is transmitted. There is a region of ambiguity when lingering echoes of P1 are still arriving after P2 is emitted. These echoes could be registered ambiguously as echoes of P2 instead of P1, leading to perception of phantom obstacles at close range, which could disrupt orientation. The bat quantitatively and significantly responds to the occurrence of ambiguity by raising the ending frequency of P1 relative to P2 by the amount Δf, which is about 5 kHz (frequency hopping, ref. 16).
Fig. 3.
Fig. 3.
Priority of lowest FM1 frequencies for delay perception. (A) Experiment to test whether the lowest FM1 frequencies of 25 to 35 kHz are both necessary and sufficient for echo delay discrimination. The bat on the Y-shaped platform is trained to broadcast sonar sounds into microphones (m, left and right) which lead to return of electronic “virtual reality” echoes from loudspeakers (s, also left and right). The correct response is to move forward toward the loudspeaker that delivers S+ echoes for a mealworm reward (rewarded S+, blue, 3,160 and 3,460 μs delays simulating distances of 54 and 60 cm and having easily perceived Δt = 300 μs glint separation versus unrewarded S−, purple, 3,660 μs delay, simulating 63 cm distance using a normally easily discriminated 500 μs longer delay than S+). Left–right positions of S+ and S− were randomized in experiments. Each stimulus condition (high-pass filtering, red list, or low-pass filtering, blue list) was tested for 150 trials per bat; performance was assessed as the percentage of correct responses (ranging from 0% perfect; to 50% chance). S+ echoes are subjected to sharp low-pass cutoff frequency (blue numbers) or high-pass cutoff frequency (red numbers) filtering (115 dB/octave cutoff frequencies in small steps from 99 down to 20 kHz or from 20 up to 68 kHz). (B) Two-choice results obtained for different high-pass and low-pass truncations of echo spectra. Top shows a spectrogram of a typical FM bat broadcast (frequency is horizontal, time is vertical; harmonics are FM1, FM2). Bottom shows the mean performance (±1 SD) of four big brown bats in two-choice tests with different high-pass (red) and low-pass (blue) cutoff frequencies. An individual bat’s performance is shown in light gray. Error percentages show that the presence of frequencies around 29 to 32 kHz at the tail end of the FM1 sweep (orange vertical arrow) is essential; absent these frequencies, performance is near chance for all of the remaining frequencies, even if 70 to 80% of the other frequencies are still present (high-pass conditions). Additional confirmation that these frequencies are special comes from the results of previous jamming avoidance experiments (green triangles marking individual preferred frequencies and detection performance for three big brown bats; ref. 35). These bats defend a narrow span of frequencies (24 to 32 kHz) at the tail end of the FM1 sweep by shifting FM1 up or down, away from single-frequency jamming sounds at these frequencies. They do not react to jamming at other frequencies (35).
Fig. 4.
Fig. 4.
The SCAT model can segregate echoes of different broadcasts by frequency hopping. (A) Spectrograms for two FM successive biosonar pulses with frequency hopping Δf (P1, P2) recorded using the telemike and several of their echoes (EP1, EP2) arranged in a sequence to test cross correlation (B and C) and SCAT determination of delay (DF). (B) Spectrograms from A zoomed in to show P2 and the echoes that follow in its echo epoch. (C) Transformation of P2 and echoes from B into cross-correlation functions using P2 as the template. Both the correctly corresponding echoes (Ep2) and the ambiguous echo (Ep1) are highly correlated with P2, indicating acceptance of the ambiguous echo along with the correct echoes. Differences in cross-correlation peak height and cross-correlation width might seem adequate to reject the ambiguous echo, but height is the reflective object’s size, and width is the object’s shape, both of which vary considerably in real clutter such as vegetation (–46), rendering them effectively stray parameters. (D) SCAT spectrograms for the same sounds as for the spectrograms in B. (E) SCAT can segregate echoes when the lowest frequencies are present. Dechirped spectrograms of signals in D plotted by shifting the time of occurrence of each frequency in P2 to time 0. Note vertical rows of points for both echoes EP2 and a slightly mismatched row of points for EP1. (F) When the lowest frequencies in P2 are absent, SCAT cannot determine the delay estimate by frequency hopping.

Similar articles

Cited by

References

    1. Kurta A., Baker R. H., Eptesicus fuscus. Mamm. Species 356, 1–10 (1990).
    1. Griffin D. R., Listening in the Dark, (Yale University Press, New Haven, CT, 1958).
    1. Neuweiler G., Biology of Bats, (Oxford University Press, Oxford, UK, 2000).
    1. Fenton M. B., Grinnell A. D., Popper A. N., Eds., Bat Bioacoustics, (Springer, New York, 2016).
    1. Clare E. L., Symondson W. O. C., Fenton M. B., An inordinate fondness for beatles? Variation in seasonal dietary preferences of night-roosting big brown bats (Eptesicus fuscus). Mol. Ecol. 23, 3633–3647 (2014). - PubMed

Publication types

LinkOut - more resources