. 2020 Jul 6;11(1):3434.
doi: 10.1038/s41467-020-17292-4.

Marked T cell activation, senescence, exhaustion and skewing towards TH17 in patients with COVID-19 pneumonia

Affiliations

Marked T cell activation, senescence, exhaustion and skewing towards TH17 in patients with COVID-19 pneumonia

Sara De Biasi et al. Nat Commun. .

Abstract

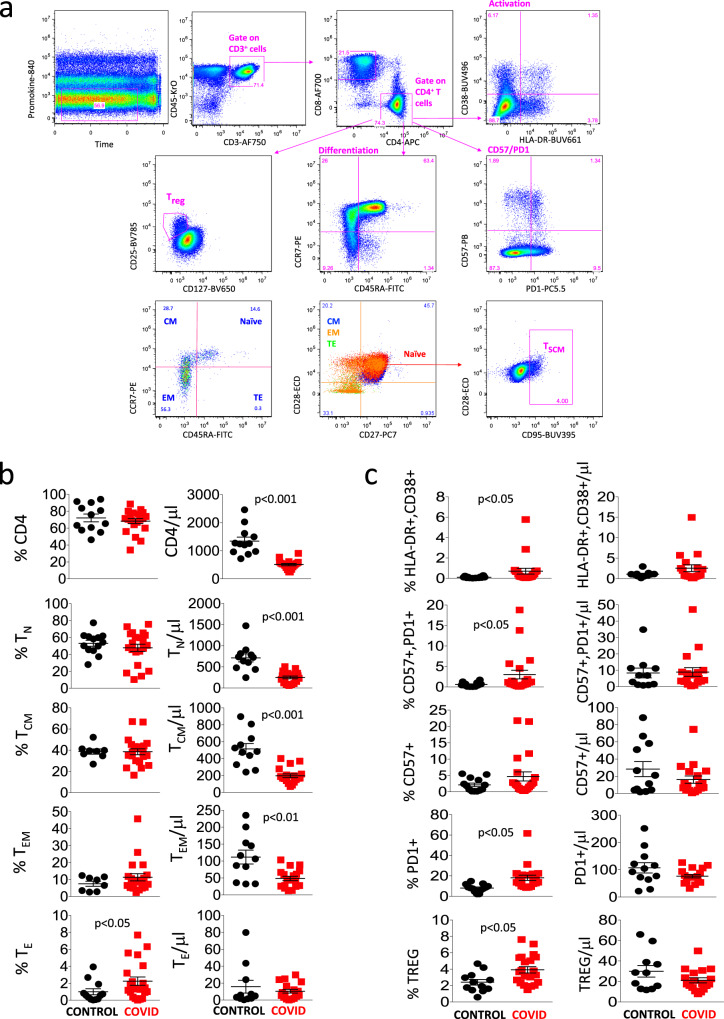
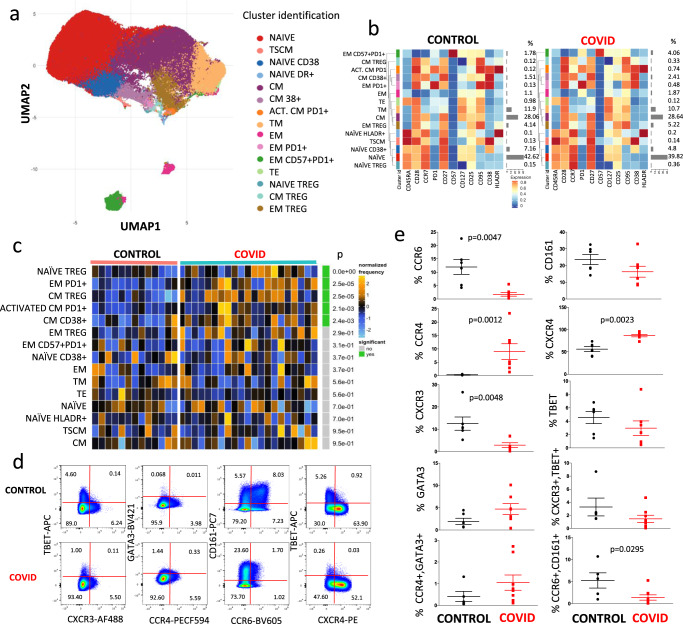
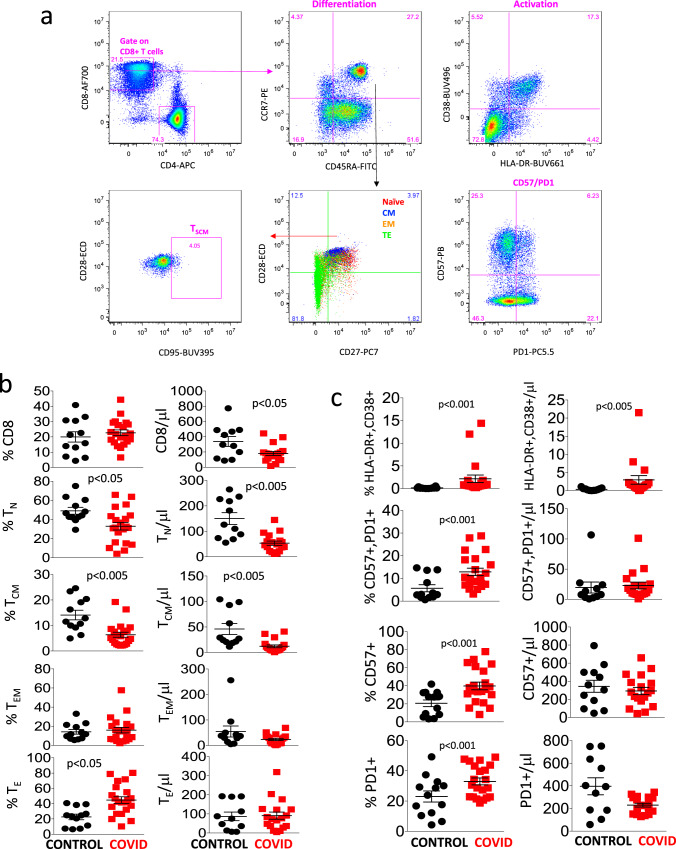
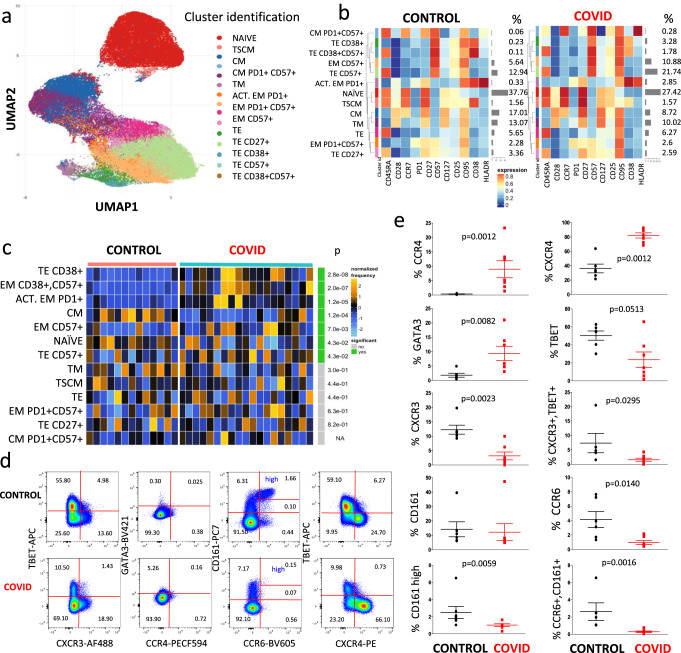
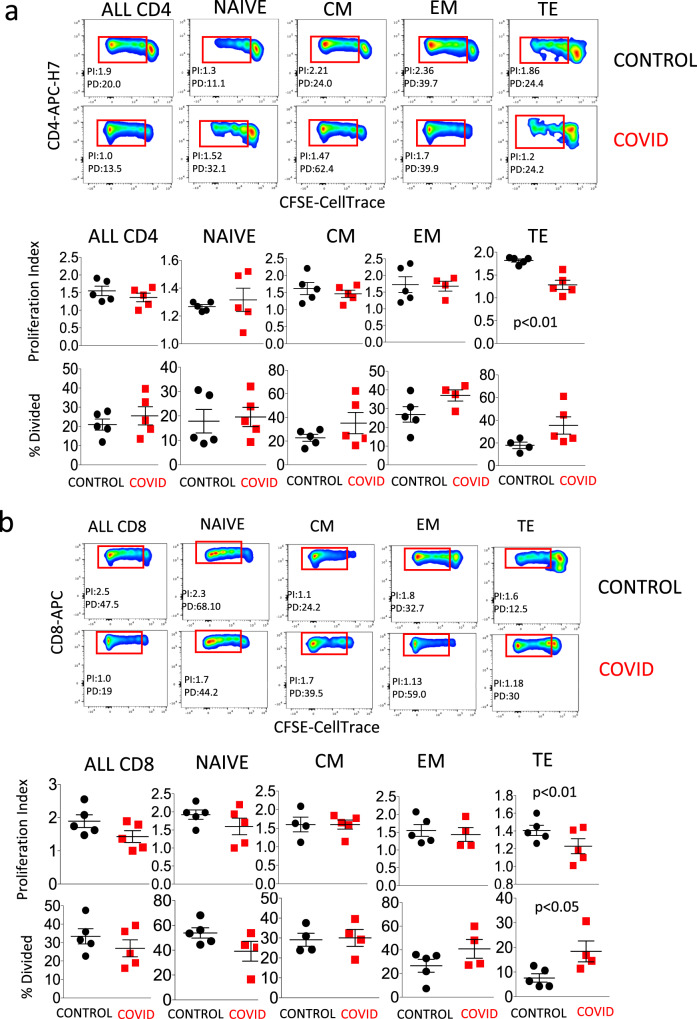
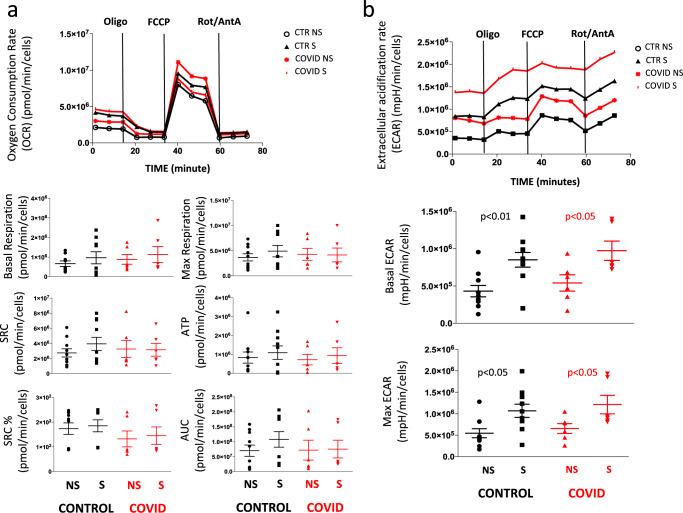
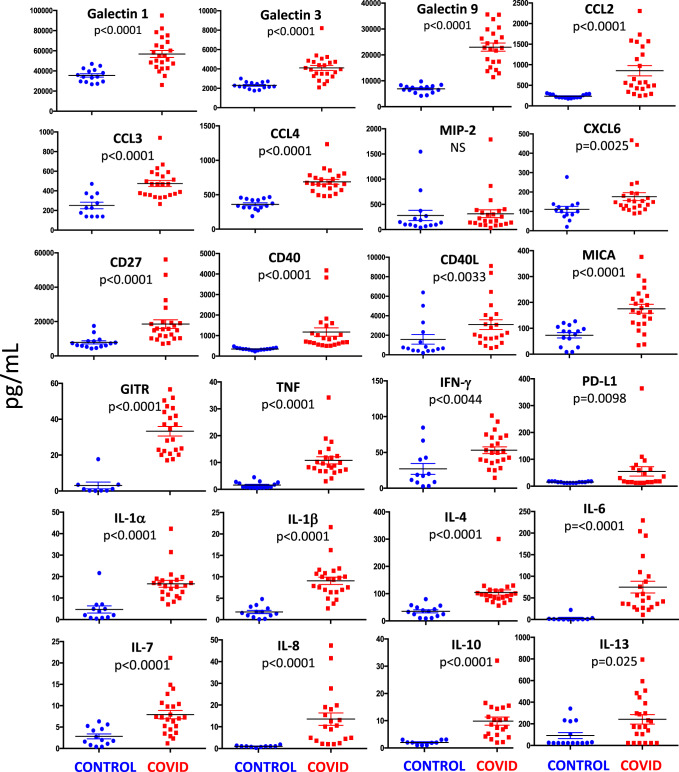
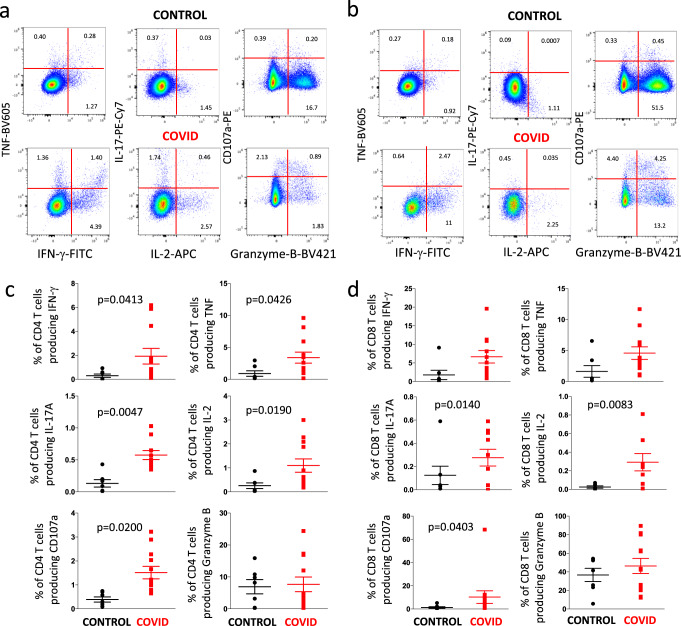
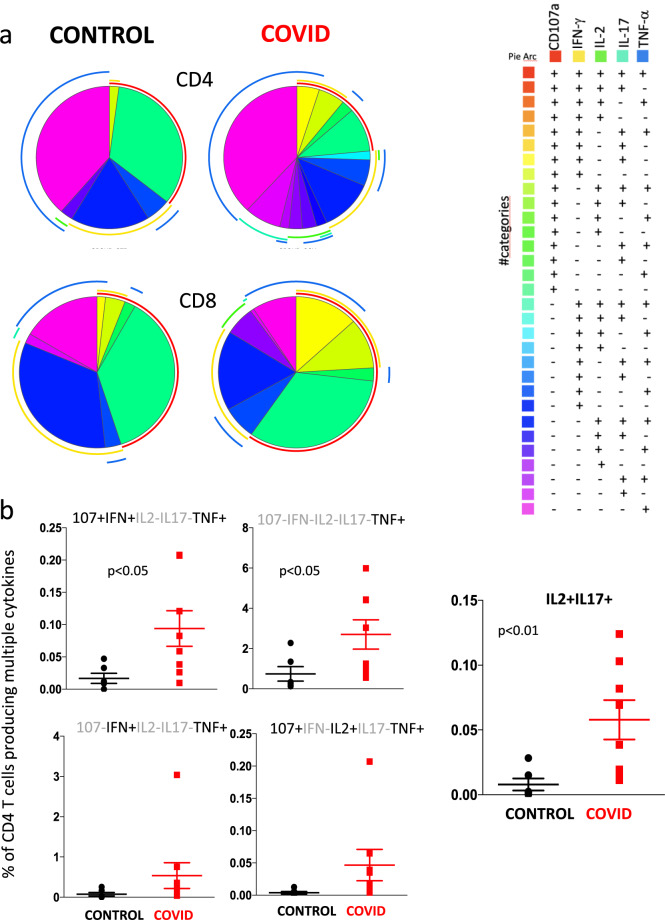
The immune system of patients infected by SARS-CoV-2 is severely impaired. Detailed investigation of T cells and cytokine production in patients affected by COVID-19 pneumonia are urgently required. Here we show that, compared with healthy controls, COVID-19 patients' T cell compartment displays several alterations involving naïve, central memory, effector memory and terminally differentiated cells, as well as regulatory T cells and PD1+CD57+ exhausted T cells. Significant alterations exist also in several lineage-specifying transcription factors and chemokine receptors. Terminally differentiated T cells from patients proliferate less than those from healthy controls, whereas their mitochondria functionality is similar in CD4+ T cells from both groups. Patients display significant increases of proinflammatory or anti-inflammatory cytokines, including T helper type-1 and type-2 cytokines, chemokines and galectins; their lymphocytes produce more tumor necrosis factor (TNF), interferon-γ, interleukin (IL)-2 and IL-17, with the last observation implying that blocking IL-17 could provide a novel therapeutic strategy for COVID-19.


Conflict of interest statement

The authors declare no competing interests.

Figures

Fig. 1
Fig. 1. Differentiation, activation, and exhaustion of CD4+ T cells.
a Gating strategy used to analyze markers related to differentiation, activation status, senescence, and exhaustion together with identification of Tregs and TSCM within CD4+ T cells. Naïve T cells are identified as CCR7+CD45RA+CD28+CD27+ cells; TSCM are CCR7+CD45RA+CD28+CD27+CD95+; central memory (CM) are CCR7CD45RA+CD28+CD27+/−; effector memory (EM) are CCR7CD45RACD28+/−CD27+/−; terminal effector (TE) are CCR7CD45RA+CD28CD27+/−. Activated cells are CD38+HLA-DR+; Treg are CD127CD25+; exhausted/senescent are PD1+CD57+. b, c Percentages and absolute numbers of different CD4+ T cell subpopulations in controls (n = 13) and patients (n = 21), obtained by manual gating. Data represent individual values, mean (centre bar) ± SEM (upper and lower bars). Statistical analysis by two-sided Mann–Whitney nonparametric test; if not indicated, p value is not significant. Source data are provided as a Source Data file.
Fig. 2
Fig. 2. Unsupervised analysis of CD4+ T cells and their characterization.
a Uniform Manifold Approximation and Projection (UMAP) representation of the CD4+ T cell landscape. b Heat map representing different CD4+ T cell clusters identified by FlowSOM, with relative identity and percentages in healthy controls and COVID-19 patients. The colors in the heat map represent the median of the arcsinh, 0–1 transformed marker expression calculated over cells from all the samples, varying from blue for lower expression to red for higher expression. The dendrogram on the left represents the hierarchical similarity between the metaclusters (metric: Euclidean distance; linkage: average). Each cluster has a unique color assigned (bar on the left). Barplot along the rows (clusters) and values on the right indicate the relative sizes of clusters. c Differential analysis between controls (bar color: salmon; n = 13) and COVID-19 (emerald; n = 21). The heat represents arcsine-square-root transformed cell frequencies that were subsequently normalized per cluster (rows) to mean of zero and standard deviation of one. The color of the heat varies from blue indicating relative under-representation to orange indicating relative over-representation. Bar and numbers at the right indicate significant differentially abundant clusters (green) and adjusted p values. Clusters are sorted according to adjusted p values, so that the cluster at the top shows the most significant abundance changes between the two conditions. d Representative dot plots related to the expression of different chemokine receptors and lineage-specifying transcription factors in gated CD4+ T from a control (upper) and a patient (lower panel). Numbers indicate the percentage in each quadrant. Two experiments (one for the control group, one for patients) out of 13 are shown. Numbers indicate the percentage in each quadrant. The gating strategy for the identification of CD4+ T cells is reported in Supplementary Fig. 1. e Percentages of different CD4+ T cell subpopulations in controls (n = 6) and patients (n = 7), obtained by manual gating. Data represent individual values (dots), mean (centre bar) ± SEM (upper and lower bars). Statistical analysis is performed by two-sided Mann–Whitney nonparametric test; if not indicated, p value is not significant. Source data are provided as a Source Data file.
Fig. 3
Fig. 3. Differentiation, activation, and exhaustion of CD8+ T-cell subsets.
a Gating strategy used to analyze markers of differentiation, activation status, senescence, and exhaustion, together with identification of TSCM within CD8+ T cells. Naïve T cells are identified as CCR7+CD45RA+CD28+CD27+; TSCM are CCR7+CD45RA+CD28+CD27+CD95+; central memory (CM) are CCR7CD45RA+CD28+CD27+/−, effector memory (EM) CCR7CD45RACD28+/−CD27+/−; terminal effector (TE) are CCR7CD45RA+CD28CD27+/−. Activated cells are CD38+HLA-DR+; exhausted/senescent are PD1+CD57+. b, c Percentages and absolute numbers of different CD8+ T cell subpopulations in controls (n = 13) and patients (n = 21), obtained by manual gating. Data represent individual values, mean (centre bar) ± SEM (upper and lower bars). Statistical analysis by two-sided Mann–Whitney nonparametric test; if not indicated, p value is not significant. Source data are provided as a Source Data file.
Fig. 4
Fig. 4. Unsupervised analysis of CD8+ T cells and their characterization.
a Uniform Manifold Approximation and Projection (UMAP) UMAP representation of CD8+ T cell landscape. b Heat map representing different clusters identified by FlowSOM, with relative identity and percentages in controls and patients. The color in the heat map represents the median of the arcsinh, 0–1 transformed marker expression calculated over cells from all the samples, varying from blue for lower expression to red for higher expression. The dendrogram on the left represents the hierarchical similarity between the metaclusters (metric: Euclidean distance; linkage: average). Each cluster has a unique color assigned (bar on the left). Barplots along the rows (clusters) and values on the right indicate the relative sizes of clusters. c Differential analysis between CTR (bar color: salmon; n = 13) and COVID-19 (emerald; n = 19). The heat represents arcsine-square-root transformed cell frequencies that were subsequently normalized per cluster (rows) to mean of zero and standard deviation of one. The color of the heat varies from blue indicating relative under-representation to orange indicating relative over-representation. Bar and numbers at the right indicate significant differentially abundant clusters (green) and adjusted p values. Clusters are sorted according to adjusted p values, so that the cluster at the top shows the most significant abundance changes between the two conditions. d Representative dot plots related to the expression of different chemokine receptors and lineage-specifying transcription factors in gated CD8+ T from a control donor (upper) and a patient (lower panel). Two experiments (one for the control group, one for patients) out of 13 are shown. Numbers indicate the percentage in each quadrant. The gating strategy for the identification of CD8+ T cells is reported in Supplementary Fig. 1. e Percentages of different CD8+ T cell subpopulations in controls (n = 6) and patients (n = 7), obtained by manual gating. Data represent individual values (dots), mean (centre bar) ± SEM (upper and lower bars). Statistical analysis is performed by two-sided Mann–Whitney nonparametric test; if not indicated, p value is not significant. Source data are provided as a Source Data file.
Fig. 5
Fig. 5. Cell proliferation of CD4+ and CD8+ T lymphocytes.
a Upper two rows: representative dot plots related to cell proliferation in different types of CD4+ T cells from a control donor (upper panel) and a patient (COVID, lower panel). Lower two rows indicate the proliferation index and the percentage of divided cells in all CD4+ T cells, or in naive, central memory (CM), effector memory (EM), or terminally differentiated (TE) cells. Data represent individual values (dots) from five patients and five controls, mean (centre bar) ± SEM (upper and lower bars). Statistical analysis is performed by two-sided Mann–Whitney nonparametric test; if not indicated, p value is not significant. The gating strategy for the identification of CD4+ T cells is reported in Supplementary Fig. 2. b Upper two rows: representative dot plots related to cell proliferation in different types of CD8+ T cells from a control donor (CTR, upper) and a patient (COVID, lower panel). Lower two rows indicate the proliferation index and the percentage of divided cells in all CD8+ T cells, or in naive, central memory (CM), effector memory (EM), or terminally differentiated (TE) cells. Data represent individual values (dots) from five patients and five controls, mean (centre bar) ± SEM (upper and lower bars). Statistical analysis is performed by two-sided Mann–Whitney nonparametric test; if not indicated, p value is not significant. The gating strategy for the identification of CD8+ T cells is reported in Supplementary Fig. 2.
Fig. 6
Fig. 6. Mitochondria bioenergetics of CD4+ T cells.
a Representative traces (out of 12 experiments) of oxygen consumption rate (OCR) of unstimulated (NS) and stimulated (S) CD4+ T cells from healthy controls (CTR; n = 7) and COVID patients (n = 5). OCR was measured in real time, under basal condition and in response to indicated mitochondria inhibitors: oligomycin (Oligo, 2 μM), cyanide-4-(trifluoromethoxy)phenylhydrazone (FCCP, 0.5 μM), and antimycin A plus rotenone (Rot/AA, 0.5 μM). Histograms show the quantification of basal respiration, maximal respiration, spare respiratory capacity (SRC), ATP-linked respiration (ATP), percentage of SRC, and area under the curve (AUC) in cell stimulated (S) with anti-CD3/28 or non-stimulated (NS) from controls and patients. The percentage of SRC represents the ratio between the seventh and the third measurement. AUC was obtained by analyzing the area under the curve from the sixth to the eleventh measurement. Data represent individual values (dots) from seven patients and five controls, mean (centre bar) ± SEM (upper and lower bars). Statistical analysis by two-sided Mann–Whitney nonparametric test shows no statistical differences between controls and patients. b Representative traces (out of 12 experiments) of extracellular acidification rates (ECAR) of unstimulated (NS) and stimulated (S) CD4+ T cells from one healthy control (CTR) and one COVID patient. ECAR was measured under basal conditions and in response to FCCP. Data represent individual values from seven controls and five patients, mean (centre bar) ± SEM (upper and lower bars) concerning the quantification of basal ECAR and maximal ECAR in cell stimulated (S) with anti-CD3/28 or non-stimulated (NS) from controls and patients. Statistical analysis by two-sided Mann–Whitney nonparametric test shows no statistical differences between controls and patients.
Fig. 7
Fig. 7. Plasma level of cytokines and chemokines from COVID-19 patients and controls.
Quantification of cytokines and other mediators in plasma obtained from COVID-19 patients (n = 23) and healthy controls (n = 15). Data represent individual values, mean (centre bar) ± SEM (upper and lower bars). Statistical analysis by two-sided Mann–Whitney nonparametric test; if not indicated, p value is not significant. Source data are provided as a Source Data file.
Fig. 8
Fig. 8. Cytokine production by CD4+ and CD8+ T cells after in vitro stimulation with anti-CD3/28.
a Representative dot plots (out of 18 experiments) related to the intracellular cytokine staining of CD4+ T cells of a control donor (upper panels) and a COVID patient (lower panels) after in vitro stimulation with anti-CD3/CD28. The gating strategy for the identification of CD4+ T cells is reported in Supplementary Fig. 3. b Representative dot plots (out of 18 experiments) related to the intracellular cytokine staining of CD8+ T cells of a control donor (upper panels) and a COVID patient (lower panels) after in vitro stimulation with anti-CD3/CD28. The gating strategy for the identification of CD8+ T cells is reported in Supplementary Fig. 3. c Comparison between the total production of IFN-γ, TNF, IL-17, IL-2, CD107a and granzyme-B by CD4+ T cells after in vitro stimulation with anti-CD3/CD28. Data represent individual values from six controls and eight patients, mean (centre bar) ± SEM (upper and lower bars). Statistical analysis by two-sided Mann–Whitney nonparametric test; if not indicated, p value is not significant. d Comparison between the total production of IFN-γ, TNF, IL-17, IL-2, CD107a and granzyme-B by CD8+ T cells after in vitro stimulation with anti-CD3/CD28. Data represent individual values from six controls and eight patients, mean (centre bar) ± SEM (upper and lower bars). Statistical analysis by two-sided Mann–Whitney nonparametric test; if not indicated, p value is not significant.
Fig. 9
Fig. 9. Polyfunctionality of CD4+ and CD8+ T cells after in vitro stimulation with anti-CD3/28.
a Pie charts representing the proportion of responding CD4+ (upper pies) and CD8+ (lower pies) T cells producing different combinations of CD107a, IL-2, IFN-γ, and TNF after anti-CD3/CD28 stimulation in control donors (left; n = 7) and patients (right; n = 11). Frequencies were corrected by background subtraction as determined in non-stimulated controls using SPICE software. Pie arches represent the total production of different cytokines. b Comparison between the production of different combinations of cytokines by CD4+ T cells after in vitro stimulation with anti-CD3/CD28. Data represent individual values from 7 controls and 11 patients, mean (centre bar) ± SEM (upper and lower bars). Statistical analysis by two-sided Mann–Whitney nonparametric test; if not indicated, p value is not significant.

References

    1. Li Q, et al. Early transmission dynamics in Wuhan, China, of novel coronavirus-infected pneumonia. N. Engl. J. Med. 2020;382:1199–1207. doi: 10.1056/NEJMoa2001316. - DOI - PMC - PubMed
    1. Cossarizza A, et al. SARS-CoV-2, the virus that causes COVID-19: cytometry and the new challenge for global health. Cytom. A. 2020;97:340–343. - PMC - PubMed
    1. Lu R, et al. Genomic characterisation and epidemiology of 2019 novel coronavirus: implications for virus origins and receptor binding. Lancet. 2020;395:565–574. - PMC - PubMed
    1. Rothe C, et al. Transmission of 2019-nCoV infection from an asymptomatic contact in Germany. N. Engl. J. Med. 2020;382:10–11. - PMC - PubMed
    1. Kuiken T, et al. Newly discovered coronavirus as the primary cause of severe acute respiratory syndrome. Lancet. 2003;362:263–270. - PMC - PubMed

MeSH terms