. 2020 Jul 6;11(1):3366.
doi: 10.1038/s41467-020-17136-1.

Requirements for the differentiation of innate T-bethigh memory-phenotype CD4+ T lymphocytes under steady state

Affiliations

Requirements for the differentiation of innate T-bethigh memory-phenotype CD4+ T lymphocytes under steady state

Takeshi Kawabe et al. Nat Commun. .

Erratum in

Abstract

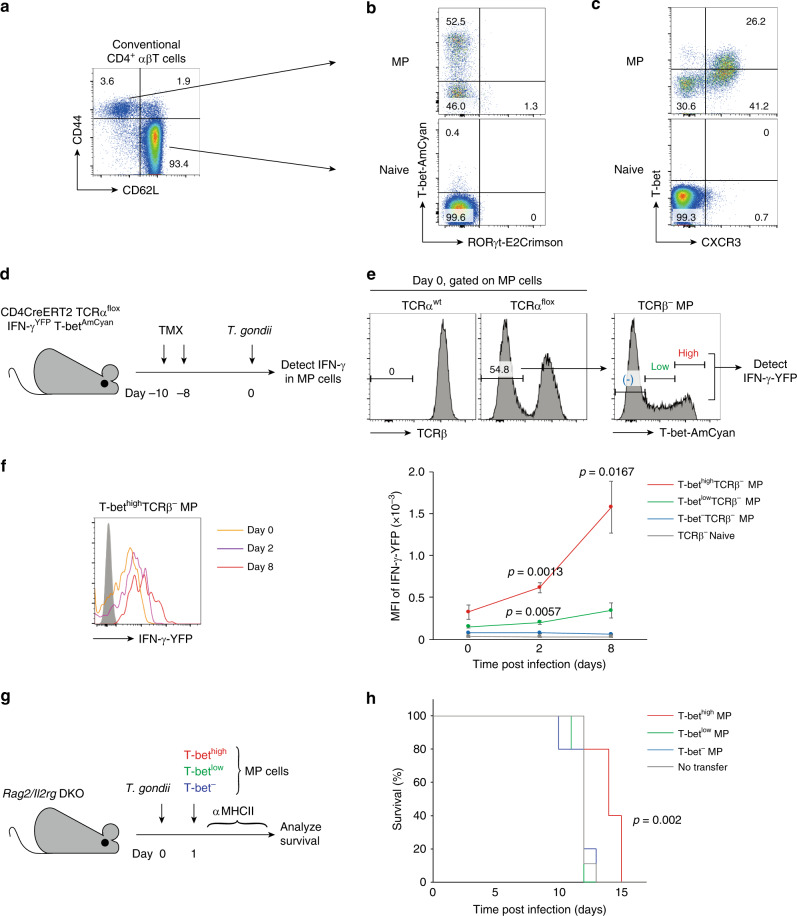
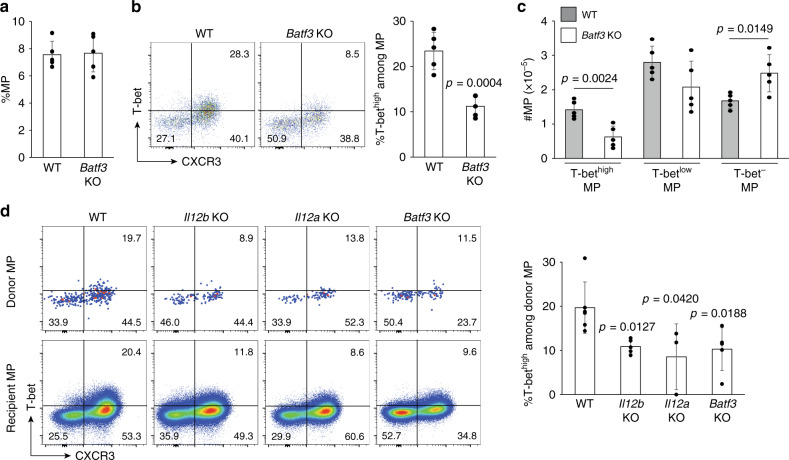
CD4+ T lymphocytes consist of naïve, antigen-specific memory, and memory-phenotype (MP) cell compartments at homeostasis. We recently showed that MP cells exert innate-like effector function during host defense, but whether MP CD4+ T cells are functionally heterogeneous and, if so, what signals specify the differentiation of MP cell subpopulations under homeostatic conditions is still unclear. Here we characterize MP lymphocytes as consisting of T-bethigh, T-betlow, and T-bet- subsets, with innate, Th1-like effector activity exclusively associated with T-bethigh cells. We further show that the latter population depends on IL-12 produced by CD8α+ type 1 dendritic cells (DC1) for its differentiation. Finally, our data demonstrate that this tonic IL-12 production requires TLR-MyD88 signaling independent of foreign agonists, and is further enhanced by CD40-CD40L interactions between DC1 and CD4+ T lymphocytes. We propose that optimal differentiation of T-bethigh MP lymphocytes at homeostasis is driven by self-recognition signals at both the DC and Tcell levels.


Conflict of interest statement

The authors declare no competing interests.

Figures

Fig. 1
Fig. 1. MP CD4+ T lymphocytes contain three subsets based on T-bet expression.
(a) Definition of MP cells. The representative dot plot shows CD44 and CD62L expression by Foxp3CD4+ αβT lymphocytes in spleen from five mice. (b and c) T-bet and RORγt expression in MP and naïve CD4+ T lymphocytes. The representative plots show (b) T-bet-AmCyan and RORγt-E2Crimson expression in the indicated cell populations obtained from three T-bet-AmCyan RORγt-E2Crimson double reporter mice and (c) T-bet and CXCR3 protein levels in the same populations from five mice. (df) T-bethigh MP cells produce IFN-γ in the absence of TCR signaling in Toxoplasma-infected mice. d Experimental design. CD4CreERT2 TCRαflox IFN-γ-YFP T-bet-AmCyan mice receiving TMX on Days -10 and -8 were infected with T. gondii on Day 0 and splenocytes measured for IFN-γ-YFP expression in T-bethigh, T-betlow, and T-betTCRβ MP subsets several days later. e TCRβ expression in MP cells and T-bet-AmCyan levels in their TCRβ fraction on Day 0. f IFN-γ-YFP expression in T-bethigh, T-betlow, and T-betTCRβ MP cells on Days 0, 2, and 8 following T. gondii infection. A representative histogram is shown (orange, purple, and red lines indicate YFP expression by T-bethighTCRβ MP cells on Days 0, 2, and 8, respectively) while the graph depicts the MFI (mean ± SD) of IFN-γ-YFP expression in the indicated populations (red T-bethighTCRβ MP; green T-betlowTCRβ MP; blue T-betTCRβ MP; gray TCRβ Naïve; Day 0 n = 6 mice; Day 2 n = 3 mice; Day 8 n = 3 mice). Data are representative of two independent experiments performed. (g and h) T-bethigh MP cells can prolong survival in T. gondii infection. g Experimental design. Rag2 / Il2rg DKO mice were infected with T. gondii on Day 0, received sorted T-bethigh, T-betlow, or T-bet MP cells on the next day, and were monitored for survival. h Survival of T. gondii-infected Rag2 / Il2rg DKO mice that received each MP subset (red, green, and blue lines show T-bethigh, T-betlow, and T-bet MP cells, respectively; T-bethigh MP n = 5 mice; T-betlow MP n = 5 mice; T-bet MP n = 5 mice; Untransferred controls n = 9 mice). Data are pooled from two experiments performed. (f) A two-sided t and (h) a log-rank tests were performed to assess significance. Source data are provided as a Source Data file.
Fig. 2
Fig. 2. MP lymphocytes differentiate into the T-bethigh subset in the presence of DC1-derived IL-12.
(a and b) IL-12 p40 and p35 are essential for optimal MP differentiation. a The frequency (mean ± SD) of MP cells among CD4+ T lymphocytes obtained from WT, Il12b KO, and Il12a KO mice is shown (WT n = 8 mice; Il12b KO n = 8 mice; Il12a KO n = 7 mice). b The representative plots show T-bet and CXCR3 expression in MP CD4+ T cells from each group while the bar graph indicates the frequency (mean ± SD) of T-bethighCXCR3+ fraction among the same CD4+ T cell population (WT n = 8 mice; Il12b KO n = 8 mice; Il12a KO n = 7 mice). Data are pooled from three independent experiments performed. (c) IL-23A p19 is dispensable for T-bethigh MP differentiation. The bar graph shows the frequency (mean ± SD) of T-bethighCXCR3+ cells among MP cells from WT and Il23a KO mice (n = 5 mice). Data are representative of two independent experiments performed. (d and e) DC1 tonically produce IL-12B p40. The representative contour plots in (d) show p40 expression by the indicated DC subsets from WT animals while the histograms in (e) depict YFP levels expressed by the same DC subsets from p40-YFP reporter mice. The filled histograms show negative control staining using non-reporter mice. The bar graphs indicate the p40+ and YFP+ fractions (mean ± SD) among indicated cell populations (n = 5 mice). Data are representative of three independent experiments. (f and g) Activated DC1 produce tonic IL-12B p40. The representative plots in (f) depict p40 expression in MHCIIvery highCD86highCD40high and MHCIIhighCD86lowCD40lowCD8α+ DCs from WT mice while the histograms in (g) show YFP expression in the same DC subsets from p40-YFP reporter mice. The bar graphs in (f) and (g) show the p40+ and YFP+ fractions (mean ± SD), respectively, among indicated CD8α+ DC subpopulations (n = 3 mice). Data are representative of two independent experiments performed. (h and i) p40+ DC1 are localized in the splenic T-cell zone. Different cell types in spleen of p40-YFP reporter mice were analyzed by multicolor tissue imaging. B220: yellow; CD4: purple; CD8: red; CD11c: blue; YFP: green. Scale bars show (h) 150 μm and (i) 15 μm. Images are representative of four sections from two mice. A two-sided t-test was performed to assess statistical significance. Source data are provided as a Source Data file.
Fig. 3
Fig. 3. DC1 are essential for optimal T-bethigh MP cell differentiation.
(ac) BatF3-sensitive DCs are essential for the optimal differentiation of MP cells. a The bar graph shows the frequency (mean ± SD) of MP cells among CD4+ T lymphocytes from WT and Batf3 KO mice (n = 5 mice). b The representative dot plots depict expression of T-bet and CXCR3 in MP CD4+ T cells from each group while the bar graph indicates the frequency (mean ± SD) of the T-bethighCXCR3+ subpopulation among the same MP population (n = 5 mice). c Total cell numbers (mean ± SD) of each of the MP subsets in (b) (n = 5 mice). Data are representative of two independent experiments. (d) CD4+ T cell-extrinsic BatF3 and IL-12 support differentiation of naïve CD4+ T lymphocytes toward the T-bethigh MP subset. Sorted naïve CD4+ T cells were transferred into congenic WT and the indicated KO mice and analyzed 3 weeks later. The representative dot plots depict T-bet and CXCR3 expression by donor- and recipient-derived MP cells while the bar graph shows the frequency (mean ± SD) of T-bethighCXCR3+ subpopulation among MP donor cells (WT n = 6 mice; Il12b KO n = 5 mice; Il12a KO n = 3 mice; Batf3 KO n = 5 mice). Data are pooled from two independent experiments performed. A two-sided t-test was performed to assess statistical significance. Source data are provided as a Source Data file.
Fig. 4
Fig. 4. Stability of mature T-bethigh, T-betlow, and T-bet MP cells and their IL-12-independence.
(a and b) Blockade of IL-12B p40 does not hamper the T-bethigh MP subpopulation. WT mice received anti-IL-12B p40 mAb or control IgG every other day for 1 week and were analyzed for MP CD4+ T cells. a The bar graph shows the frequency (mean ± SD) of MP cells among CD4+ T lymphocytes (Control n = 5 mice; Anti-IL-12B n = 3 mice). b The representative dot plots display T-bet and CXCR3 expression in MP cells while the bar graph indicates the frequency (mean ± SD) of T-bethigh subpopulation among MP cells from each group (Control n = 5 mice; Anti-IL-12B n = 3 mice). (c and dBatf3 KO MP cells have lower levels of T-bethigh subpopulation before and after transfer into congenic WT mice. Sorted MP cells from CD45.2+ WT and Batf3 KO mice were transferred into CD45.1+ WT recipients and the donor as well as recipient MP cells analyzed 10 days later. The representative dot plots show T-bet and CXCR3 expression in donor MP cells (c) before and (d) after transfer while the bar graph indicates the frequency (mean ± SD) of the T-bethigh subpopulation among transferred MP cells (n = 5 mice). (e) MP cells largely maintain their T-bet expression levels after generation. T-bethigh, T-betlow, or T-bet MP cells were sorted from CD45.2+ T-bet-ZsGreen reporter mice, transferred into CD45.1+ WT recipient animals, and analyzed for their T-bet and CXCR3 expression 10 days later. Representative dot plots display T-bet and CXCR3 expression by donor as well as recipient MP cells from three independent host mice per group. A two-sided t-test was performed to assess statistical significance. Source data are provided as a Source Data file.
Fig. 5
Fig. 5. TLR-MyD88 signaling homeostatically induces IL-12 and supports MP differentiation.
(a and b) MyD88 is essential for homeostatic IL-12B p40 production and optimal T-bethigh MP differentiation. a Representative contour plots indicating p40 expression in CD8α+ DCs from WT and Myd88 KO animals and a bar graph showing the fraction (mean ± SD) of p40+ among CD8α+ DCs from each group (n = 4 mice). b The dot plots show T-bet and CXCR3 expression in MP CD4+ T lymphocytes from each group while the bar graph indicates the frequency (mean ± SD) of T-bethighCXCR3+ cells among the total MP population (WT n = 5 mice; Myd88 KO n = 4 mice). Data are representative of two independent experiments performed. (c and d) T cell-extrinsic MyD88 supports T-bethigh MP differentiation from naïve precursors. Sorted naïve CD4+ T lymphocytes were transferred into congenic WT and Myd88 KO animals and analyzed 3 weeks later. The representative dot plots indicate expression of (c) CD44 and CD62L in the donor cell population and (d) T-bet and CXCR3 in MP donor cells from each group. The bar graphs show the frequency (mean ± SD) of (c) MP cells among donor cell population and (d) T-bethighCXCR3+ subset among MP donor cells (WT n = 5 mice; Myd88 KO n = 4 mice). Data are pooled from two independent experiments. (e) MyD88 tonically activates DC1. The bar graph indicates the frequency (mean ± SD) of MHCIIvery highCD86highCD40high cells among CD8α+ DCs (n = 3 mice). (f and g) IL-1/18 signaling is dispensable for tonic IL-12B p40 production and T-bethigh MP differentiation. The bar graphs show the frequency (mean ± SD) of (f) p40+ cells among CD8α+ DCs and (g) T-bethighCXCR3+ cells within MP cells from the indicated KO animals (n = 5 mice). (hj) Contribution of multiple TLRs to tonic IL-12B p40 production and MP differentiation. The bar graphs indicate the fraction (mean ± SD) of (h) p40+ cells among CD8α+ DCs, (i) MHCIIvery highCD86highCD40high cells among CD8α+ DCs, and (j) T-bethighCXCR3+ cells among MP lymphocytes obtained from indicated animals (WT n = 7 mice; Tlr2 KO n = 5 mice; Tlr4 KO n = 4 mice; 3D n = 3 mice). Data are pooled from two independent experiments. A two-sided t-test was performed to assess statistical significance. Source data are provided as a Source Data file.
Fig. 6
Fig. 6. CD40L on CD4+ T lymphocytes promotes tonic IL-12 expression and MP differentiation.
(a) CD4+ T cells express CD40L independently of MyD88 signaling. The open histograms depict CD40L expression by various subpopulations of lymphoid cells from indicated animals while the filled histograms show negative control staining. The bar graph depicts the ΔMFI (mean ± SD) of CD40L expression in the indicated cell populations from each group (n = 3 mice). Data shown are representative of two independent experiments performed. (b and c) CD40L enhances DC1 IL-12B p40 expression and T-bethigh MP differentiation. b The representative contour plots show p40 expression by CD8α+ DCs obtained from WT and Cd40l KO animals while the bar graph indicates the p40+ fraction (mean ± SD) among CD8α+ DCs from each group (n = 4 mice). c Dot plots displaying T-bet and CXCR3 expression in MP CD4+ T cells from each group with a bar graph showing the frequency (mean ± SD) of T-bethighCXCR3+ cells among the same T-cell subpopulation (n = 3 mice). Data shown are representative of two independent experiments. (d) CD40L tonically activates DC1. The bar graph indicates the frequency (mean ± SD) of MHCIIvery highCD86highCD40high cells among CD8α+ DCs (n = 4 mice). Data are representative of two independent experiments performed. (e and f) CD4+ T lymphocytes enhance IL-12B p40 expression in DC1 via CD40L to promote their own differentiation. CD4+ T lymphocytes sorted from WT or Cd40l KO mice were transferred into Rag KO animals, and donor and recipient cell populations examined 3 weeks later. WT and untransferred Rag KO animals were also analyzed. e The representative contour plots depict p40 expression in CD8α+ DCs of the hosts from indicated groups while the bar graph shows the frequency (mean ± SD) of p40+ cells among CD8α+ DCs from each group. f Contour plots displaying T-bet and CXCR3 expression in CD44highCD62LlowCD4+ T cells from the indicated groups and a bar graph indicating the frequency of T-bethighCXCR3+ cells (mean ± SD) among the same cell subpopulations (n = 4 mice). Data are representative of two independent experiments performed. A two-sided t-test was performed to assess statistical significance. Source data are provided as a Source Data file.
Fig. 7
Fig. 7. CD5 levels on CD4+ T lymphocytes correlate with their capacity to upregulate p40 and differentiate into T-bethigh cells.
(af) CD5 levels on TCR-Tg CD4+ T lymphocytes are positively associated with the extent of MP differentiation and DC1 p40 expression but not with CD40L expression or naïve cell levels. a CD5 levels on CD4+ T cells from P25, OT-II, and Marilyn TCR-Tg and WT mice. b CD44 and CD62L expression in CD4+ T lymphocytes from indicated animals. c MFI of CD5 expression obtained in (a) versus the frequency and the number of MP as well as naïve cells among CD4+ T cells obtained in (b) plotted against each other. d The representative histograms show CD40L expression on MP lymphocytes from each TCR-Tg animal while the scatter plot indicates the relationship between ΔMFI of CD40L and MFI of CD5. e The contour plots depict expression of T-bet and CXCR3 in MP cells from each TCR-Tg animal and the scatter plot displays the relationship between the frequency of T-bethighCXCR3+ cells among the MP population and the MFI of CD5. f The contour plots display p40 expression in CD8α+ DCs from the indicated animals while the bar graph shows the frequency (mean ± SD) of p40+ cells among the same DC subset. Data are pooled from two independent experiments (Marilyn n = 4 mice; OT-II n = 5 mice; P25 n = 3 mice). (gi) CD5 levels in CD4+ T lymphocytes positively correlate with their capacity to augment DC1 p40 expression. Naïve CD4+ T lymphocytes sorted from P25, OT-II, and Marilyn TCR-Tg mice were transferred into Rag KO animals and donor-derived CD4+ T cells and host-derived CD8α+ DCs analyzed 3 weeks later. g and h MFI of CD5 plotted against (g) the frequency and the number of CD44highCD62Llow as well as CD44lowCD62Lhigh donor cells and (h) ΔMFI of CD40L in the different transgenic T-cell populations following adaptive transfer. i Representative contour plots showing p40 expression in host-derived CD8α+ DCs from the indicated groups together with a scatter plot depicting the relationship between MFI of CD5 and the frequency of p40+CD8α+ DCs from each group. Results from the analysis of untransferred WT and Rag KO mice are also included. Data are pooled from two independent experiments (Marilyn n = 3 mice; OT-II n = 4 mice; P25 n = 4 mice). Red, green, and blue lines/dots show P25, OT-II, and Marilyn TCR-Tg T cells, respectively. A two-sided t-test was performed to assess significance. r, Pearson’s correlation coefficient. Source data are provided as a Source Data file.
Fig. 8
Fig. 8. Microbial products are dispensable for tonic p40 expression and T-bethigh MP differentiation.
(a and b) Commensal bacteria are not required for IL-12B p40 expression or MP differentiation. a Representative contour plots comparing p40 expression in splenic CD8α+ DCs from SPF and GF mice together with a bar graph showing the frequency of p40+ cells (mean ± SD) among CD8α+ DCs from each group (n = 4 mice). b Representative dot plots depicting T-bet and CXCR3 expression in MP cells together with a summary graph indicating the frequency (mean ± SD) of T-bethighCXCR3+ lymphocytes among the same CD4+ T-cell subpopulations from each group (n = 3 mice). Data are representative of two independent experiments performed. (ce) AF mice display homeostatic IL-12B p40 expression and MP differentiation indistinguishable from both SPF and GF mice. The bar graphs show the frequency (mean ± SD) of (c) p40+ cells among CD8α+ DCs and (d) T-bethighCXCR3+ cells among MP CD4+ T lymphocytes as well as (e) ΔMFI of CD40L expression in the indicated cell populations from SPF, GF, and AF mice (n = 4 mice). A two-sided t-test was performed to assess statistical significance. Source data are provided as a Source Data file.

References

    1. Sprent J, Surh CD. Normal T cell homeostasis: the conversion of naive cells into memory-phenotype cells. Nat. Immunol. 2011;12:478–484. - PMC - PubMed
    1. Kawabe T, et al. Memory-phenotype CD4(+) T cells spontaneously generated under steady-state conditions exert innate TH1-like effector function. Sci. Immunol. 2017;2:eaam9304. - PMC - PubMed
    1. Artis D, Spits H. The biology of innate lymphoid cells. Nature. 2015;517:293–301. - PubMed
    1. Kawabe T, Zhu J, Sher A. Foreign antigen-independent memory-phenotype CD4(+) T cells: a new player in innate immunity? Nat. Rev. Immunol. 2018;18:1. - PubMed
    1. White JT, Cross EW, Kedl RM. Antigen-inexperienced memory CD8(+) T cells: where they come from and why we need them. Nat. Rev. Immunol. 2017;17:391–400. - PMC - PubMed

Publication types

MeSH terms