. 2020 Aug;17(8):833-843.
doi: 10.1038/s41592-020-0880-2. Epub 2020 Jul 6.

ZipSeq: barcoding for real-time mapping of single cell transcriptomes

Affiliations

ZipSeq: barcoding for real-time mapping of single cell transcriptomes

Kenneth H Hu et al. Nat Methods. 2020 Aug.

Abstract

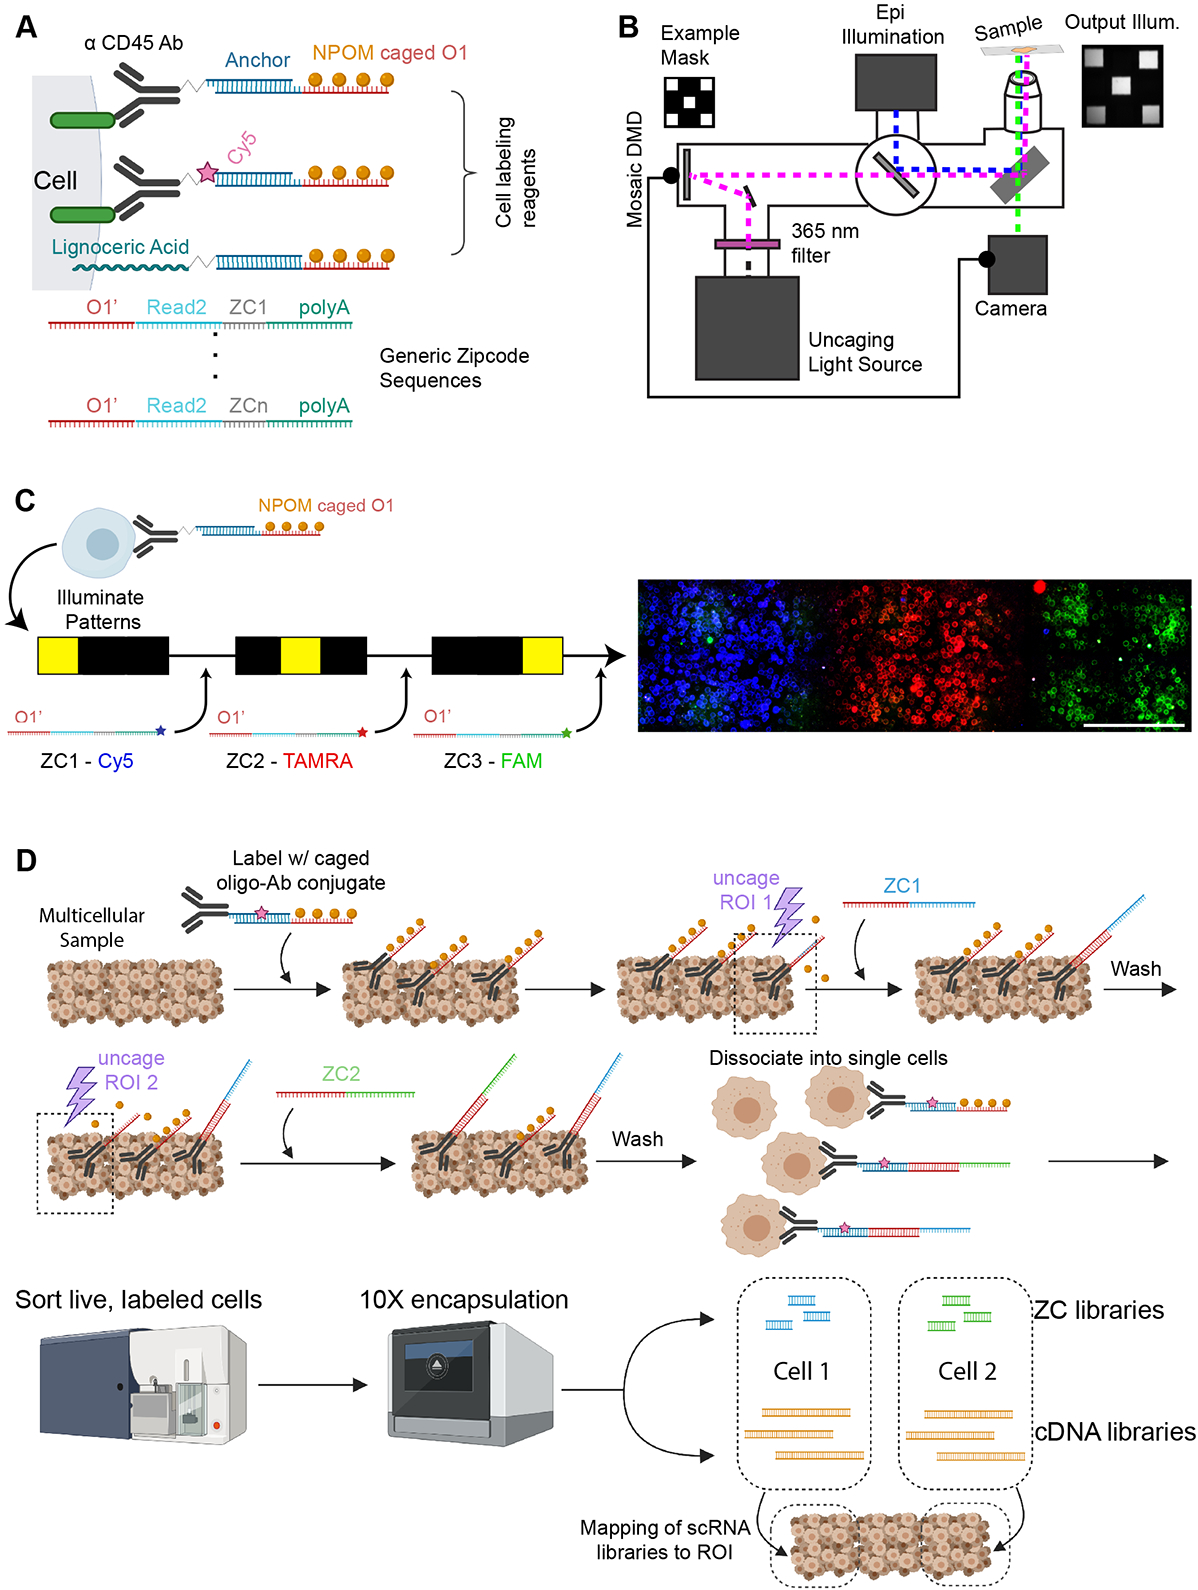
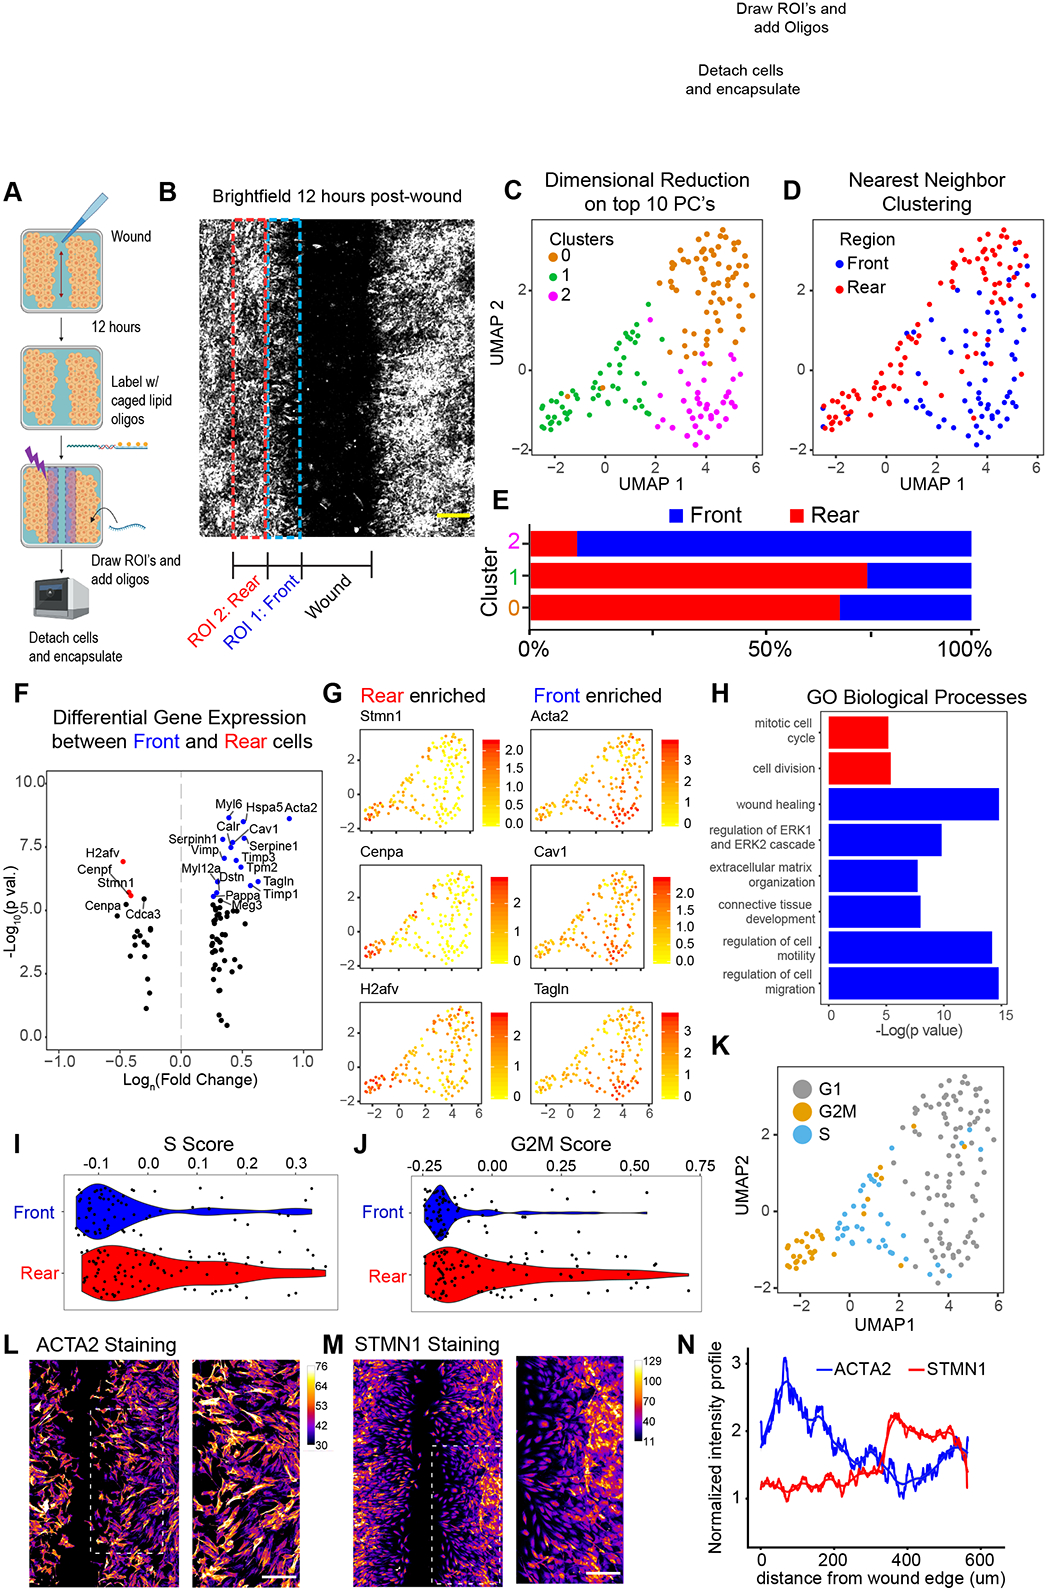
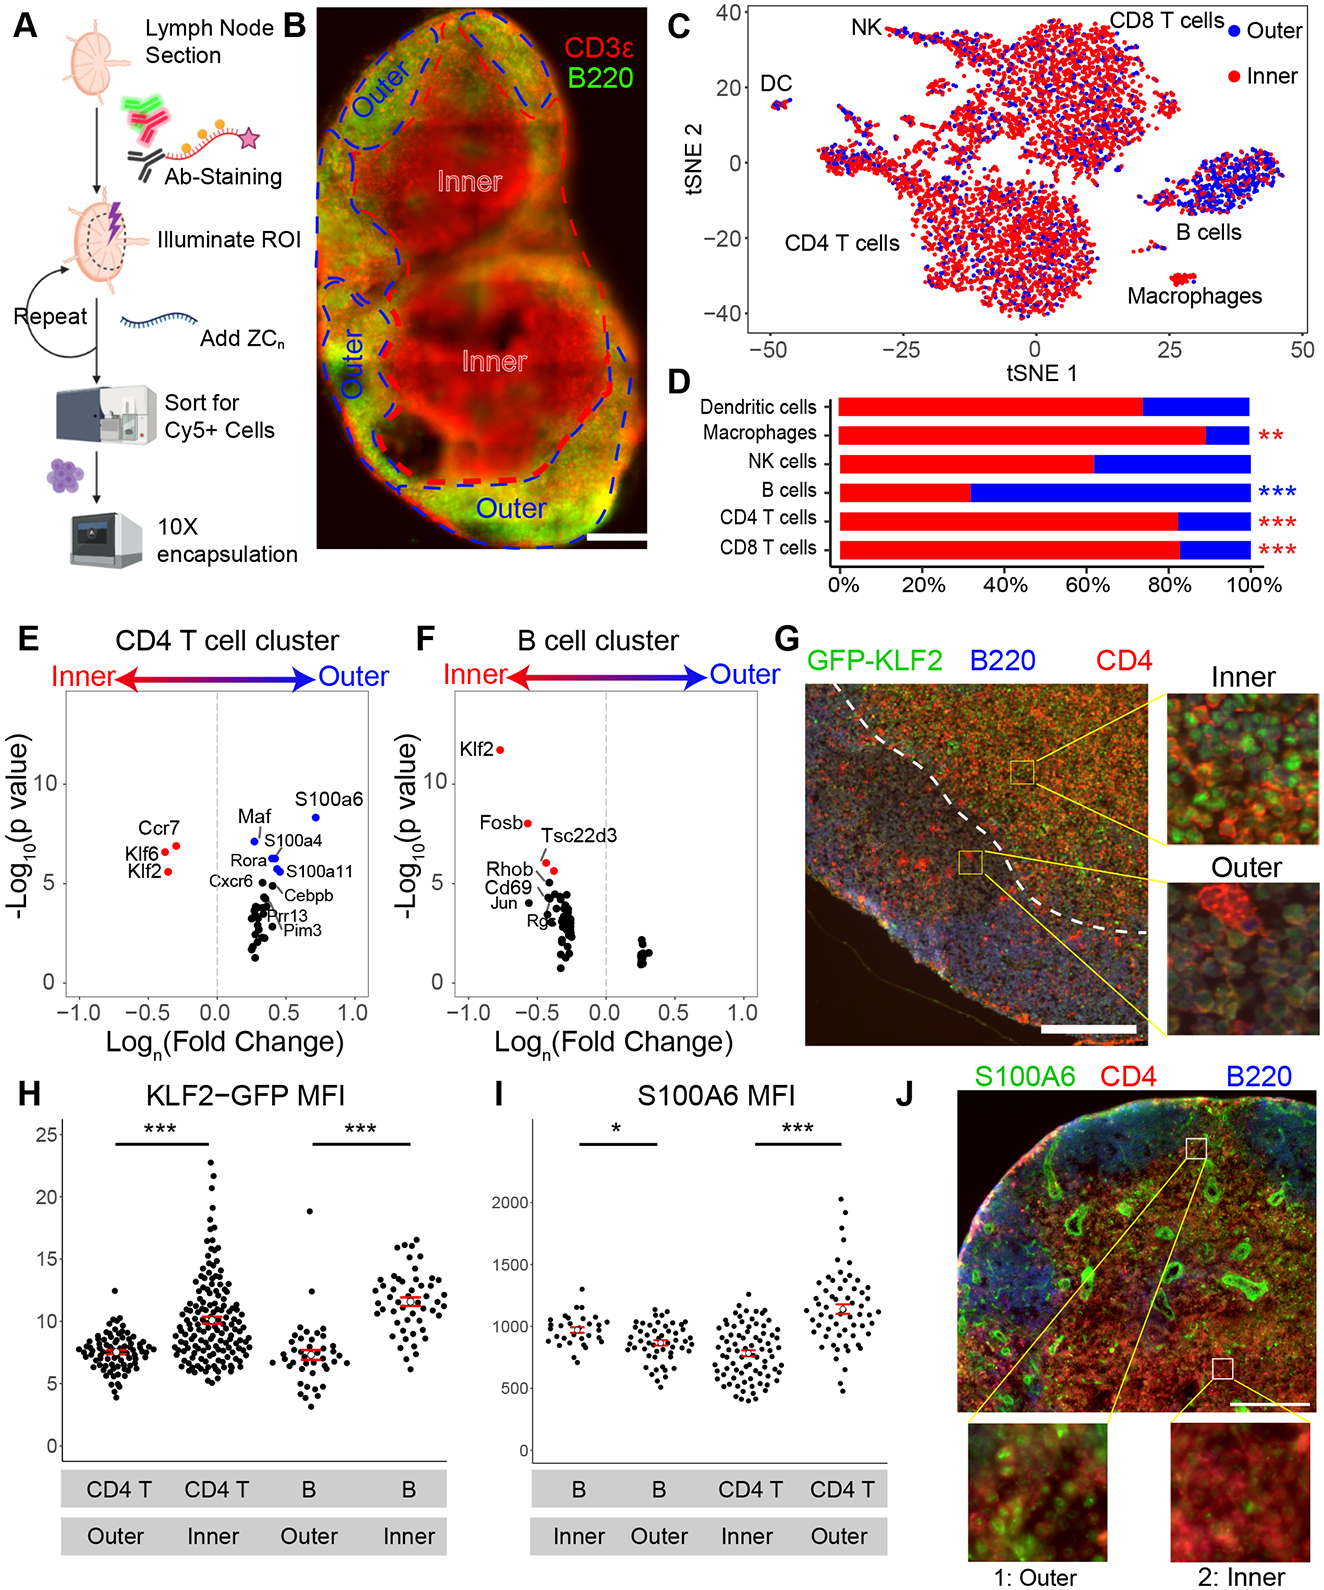
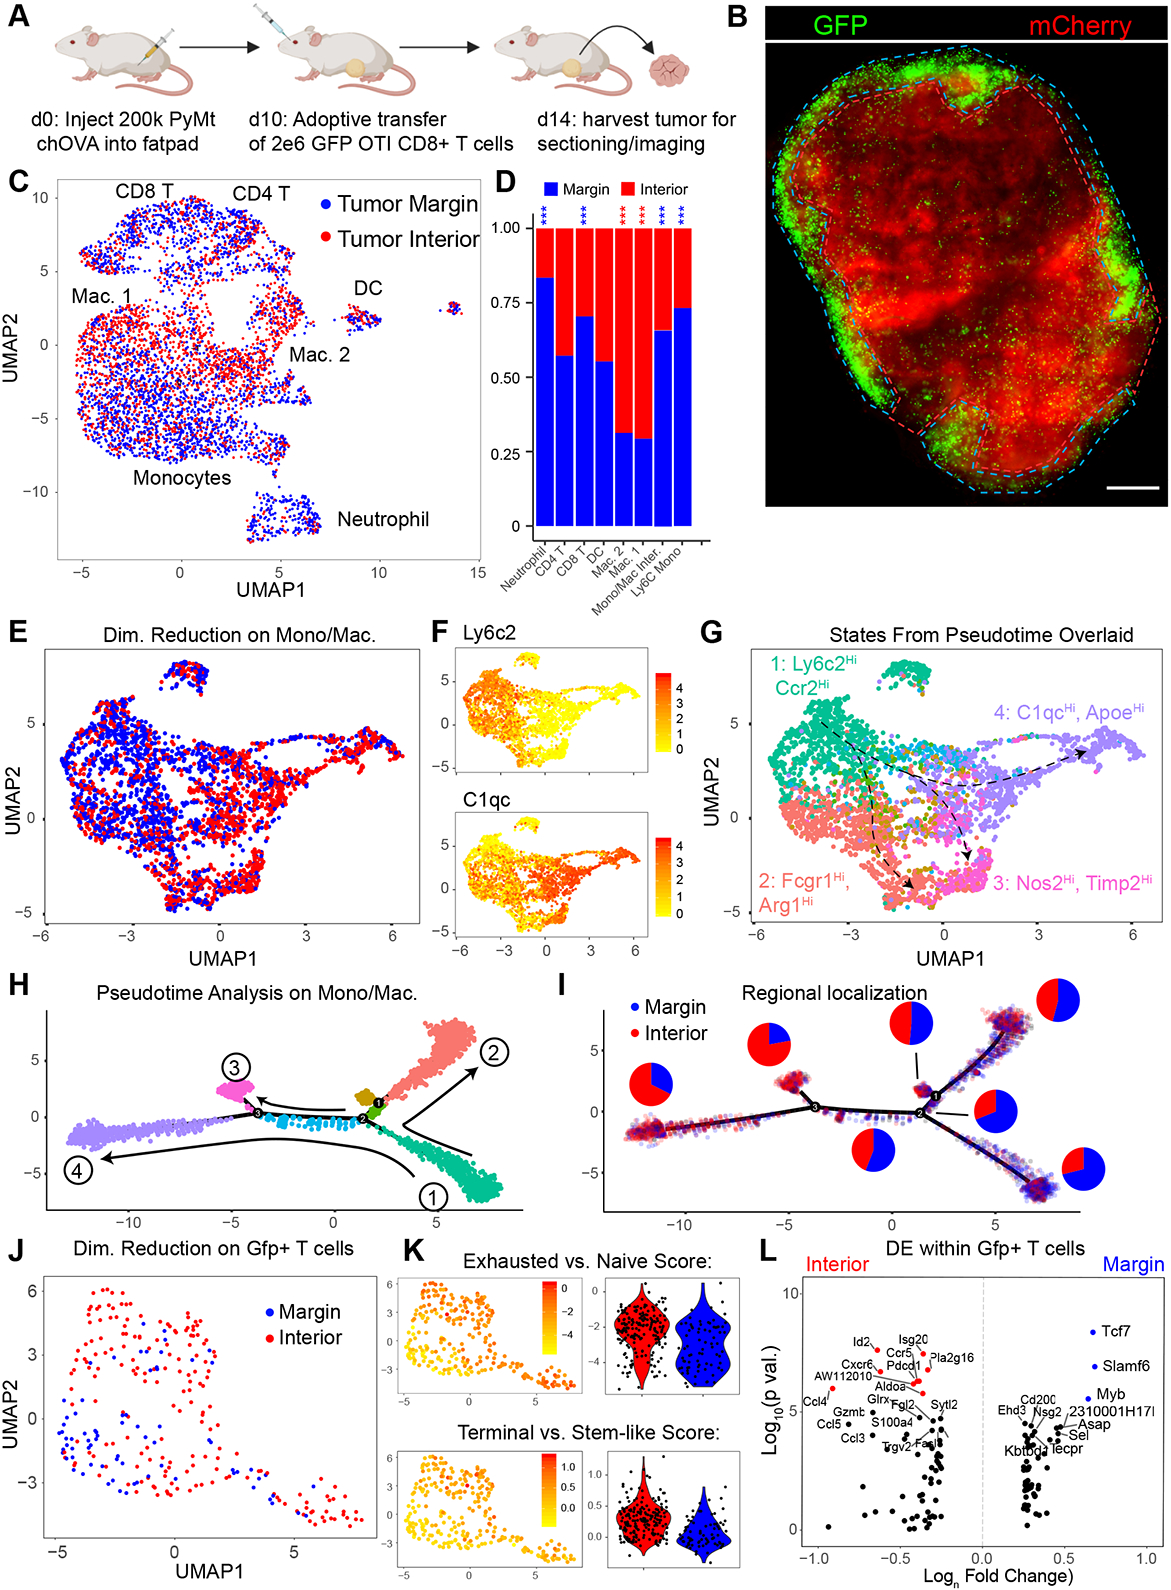
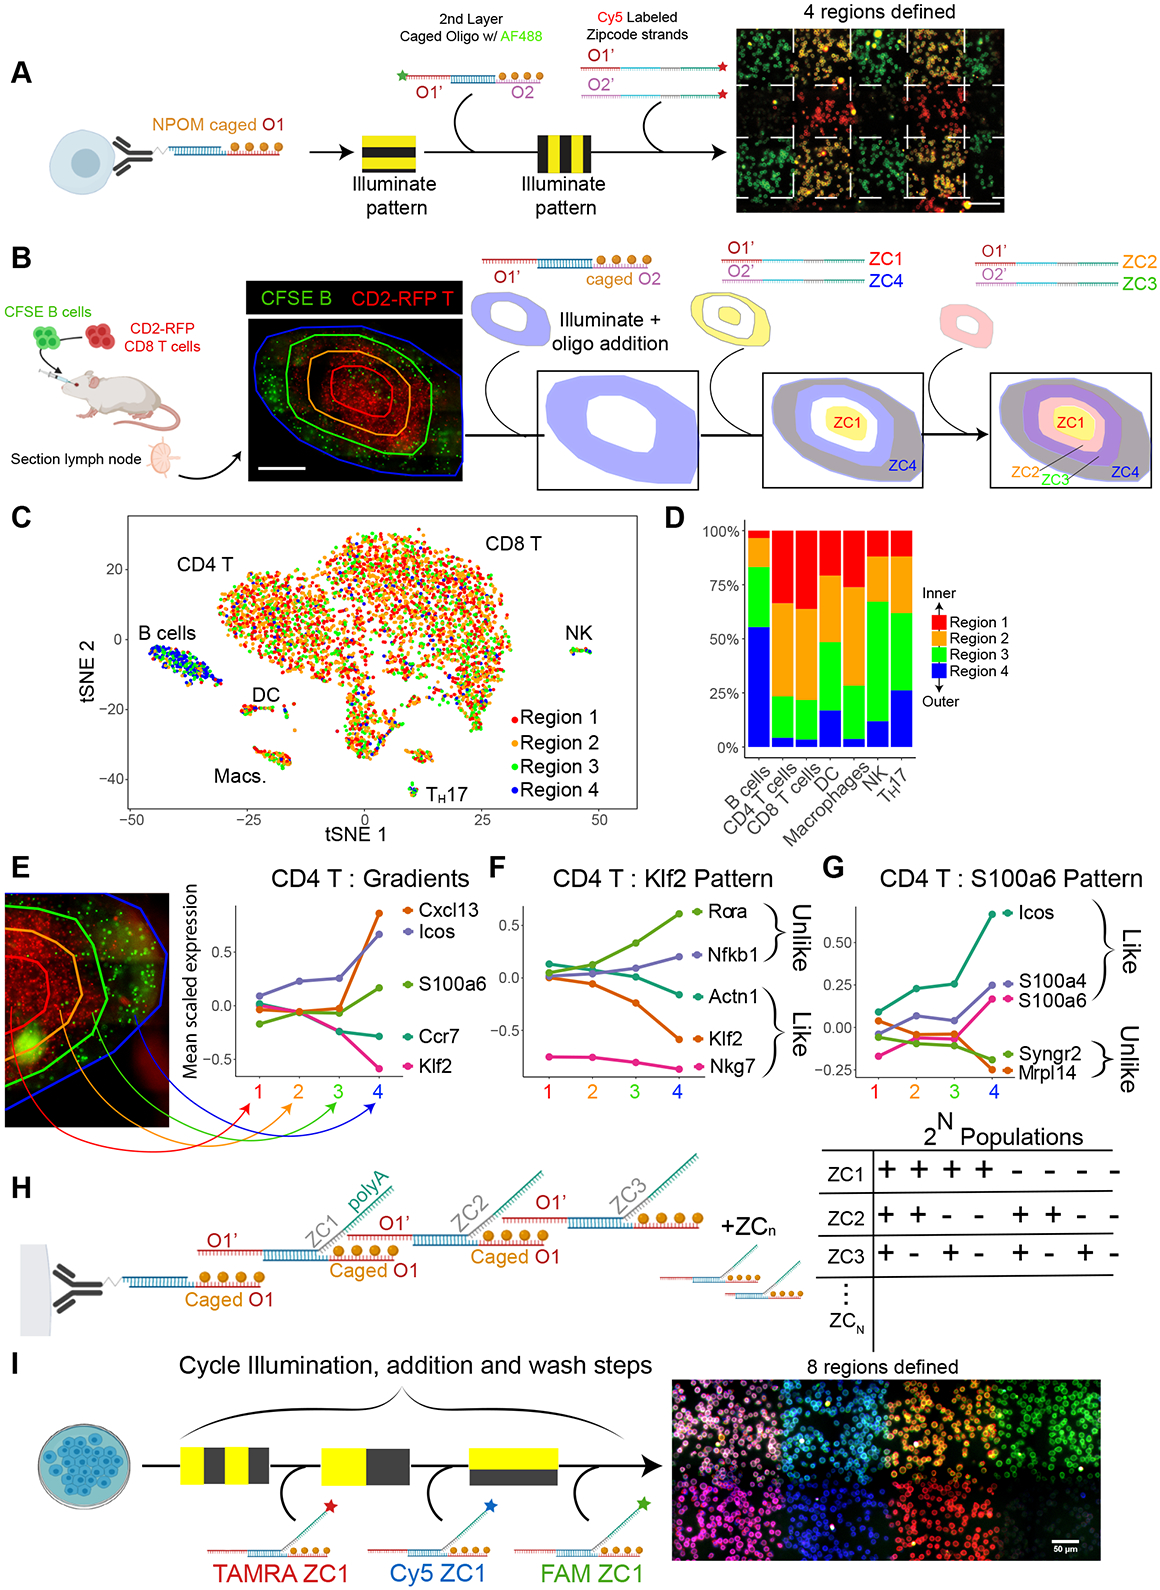
Spatial transcriptomics seeks to integrate single cell transcriptomic data within the three-dimensional space of multicellular biology. Current methods to correlate a cell's position with its transcriptome in living tissues have various limitations. We developed an approach, called 'ZipSeq', that uses patterned illumination and photocaged oligonucleotides to serially print barcodes ('zipcodes') onto live cells in intact tissues, in real time and with an on-the-fly selection of patterns. Using ZipSeq, we mapped gene expression in three settings: in vitro wound healing, live lymph node sections and a live tumor microenvironment. In all cases, we discovered new gene expression patterns associated with histological structures. In the tumor microenvironment, this demonstrated a trajectory of myeloid and T cell differentiation from the periphery inward. A combinatorial variation of ZipSeq efficiently scales in the number of regions defined, providing a pathway for complete mapping of live tissues, subsequent to real-time imaging or perturbation.


Conflict of interest statement

COMPETING FINANCIAL INTERESTS

K.H.H. and M.F.K. are listed on a patent application regarding the ZipSeq approach.

Figures

Figure 1:
Figure 1:
(a) Schematic of oligonucleotide sequences and labeling moieties used in this paper. Both lipid and antibody are covalently conjugated to an ‘anchor’ sequence. Meanwhile a caged strand consisting of 4 photocaging groups on an overhang sequence linked to the reverse complement of the anchor strand can hybridize with the Ab or lipid DNA conjugate prior to labeling cells. Readout strand or ‘Zipcodes’ consist of a reverse complement sequence to the caged overhang sequence 1 or 2, followed by a partial Illumina Small RNA Read 2 sequence for downstream amplification. In addition, each Zipcode strand bears a 8bp barcode and a 28 polyA sequence for capture by poly dT primers during reverse transcription. (b) A microscope light path for simultaneous imaging and photo-uncaging of a sample. Spatially directed photo-uncaging is accomplished through directing light from a mercury arc-lamp onto a Mosaic DMD with an 800 × 600 micromirror array in plane with the sample. The sample can be simultaneously imaged using epi-fluorescent excitation. In the imaging software, a user defined ROI is converted into a mask which is reflected in the micromirror array. This spatially patterned light is then directed through the microscope and objective onto the sample. An example mask is shown with the resulting illumination pattern visualized on a mirrored slide. (c) Illustration of proof-of-concept demonstrating ability to spatially control hybridization of fluorescently labelled oligonucleotides. Briefly, a monolayer of primary mouse CD8 T cells was plated, labeled w/ the anti-CD45 Ab conjugated anchor strand (here without internal Cy5 modification) hybridized to a caged overhang (O1) strand. The leftmost square ROI of 300 μm size was illuminated with 365 nm light and the first oligonucleotide with single stranded O1’ conjugated to Cy5 was added and allowed to hybridize. Following wash steps, the process was repeated 2x at other positions with distinct O1’-fluorophore combinations (TAMRA and FAM) resulting in 3 defined regions. Scale bar = 200 μm (d) Schematic for workflow for labeling two regions of interest in a tissue section beginning with labeling of cells in a dish/in tissue with appropriate labeling moiety hybridized to a strand bearing the photocaged ssDNA overhang. Manual delineation of an ROI is followed by a pulse of UV illumination. Addition of a readout strand or Zipcode 1 allows for labeling of uncaged overhangs i.e. cells within ROI. Following washout of this Zipcode 1, the process is repeated for ROI #2. Cells are then harvested or dissociated from tissue, (FACS-)sorted for labelled cells, and passed to the 10X Chromium Controller for encapsulation and reverse transcription.
Figure 2:
Figure 2:. ZipSeq Mapping of a Live Cell Monolayer Following Wounding
(a) Experimental setup. NIH/3T3 cells were plated 48 hours prior to imaging and allowed to reach confluency. 12 hours prior to imaging, a pipette tip was used to cleanly scrape away a band. The wound was imaged after 12 hours and ROI’s defined. Cells were then labeled with a lipid-oligo conjugate and then uncaged in a series of vertical bands alternating with Zipcode addition. Harvested cells were then passed into the modified 10X workflow. (b) Brightfield of wound 12 hours post-wounding with ROI’s overlaid. Two vertical bands of 200 μm width were drawn with increasing distance from the wound edge (0-200 μm) and (200-400 μm), referred to as ‘front’ and ‘rear’ respectively for illumination and zipcoding. Scale bar = 200 μm. (c) UMAP representation of Zipcode labeled cells with majority Zipcode identity overlaid. UMAP was calculated using the top 10 principal components. (n=160 cells, nFront=67, nRear=93) (Mean nUMI = 17.3k, Mean nGene = 3550, Cutoffs: nGene > 1000, percent.mito < 0.15) (d) UMAP representation of labeled cells with cluster overlay. Clusters calculated using Seurat’s built-in SNN based clustering algorithm. (e) Percentage of cells belonging to either Front or Rear populations within each cluster as defined in (d). (f) Volcano plot from differential expression analysis between Front and Rear cells. Colored points represent genes with an adjusted p-value (Bonferroni corrected) <0.05. (g) Feature plots overlaid on UMAP representation for 3 selected genes from DE analysis enriched in either Front (Acta2, Cav1, and Tagln) or Rear cells (Stmn1, Cenpa, H2afv). Color scale indicates Log-Normalized gene read counts. (h) Hits from DE analysis were passed through GO analysis. Significantly enriched biological processes shown with -Log(p-value) (Bonferroni corrected). Violin plots for (i) S phase and (j) G2M phase signature score for Front and Rear cells. Gene lists used are shown in Methods. (k) Assignment to cell cycle phase (S, G2M or G1 phase) based on the signature scores calculated in (i) and (j). Immunofluorescence imaging of fixed NIH/3T3 cells 12 hours post-wounding stained for either (l) ACTA2 or (m) STMN1. Fire LUT from ImageJ applied. Zoomed in insets shown for indicated regions. Scale bar = 100 μm. (N) Line plot with quantification of mean fluorescence intensity vs. distance from edge. IF images from (l and m) were first masked for pixels belonging to cells vs. background. Then in-cell pixels within vertical bands stepping away from the wound were averaged to create the indicated line-scan profiles with a smoothed fit applied.
Figure 3:
Figure 3:
(a) Schematic of workflow for lymph node study. A lymph node was taken from a C57BI/6 mouse and sectioned. Following this, the section was stained for B220 and CD3ε along with the anti-CD45 Ab conjugated anchor strand (with internal Cy5 modification) hybridized to a caged strand. The section was imaged and ROI’s were illuminated prior to Zipcode 1 or 2 addition. Tissue was then dissociated and labeled live cells (Cy5+) were sorted for 10X encapsulation, (b) Composite stitched image of lymph node section used with B220 marked in green and CD3ε in red to delineate inner and outer regions used for Zipcoding in subsequent study. Scale bar = 400 μm. (c) tSNE dimensional reduction of sorted live, Cy5+ cells following 10X scRNA-Seq workflow. Assigned regional id based on ZC1:ZC2 counts overlaid. Immune cell populations were identified using known expression markers on Immgen. (n=7019 cells)(Mean nUMI = 4.1k, Mean nGene = 1057. Cutoffs used: nGene > 400, percent.mito < 0.15) (d) Regional distributions of major immune cell populations as identified in (c). Asterisks denote significance of enrichment with color indicating direction (Inner vs. Outer). ***: p<0.0001 **: p<0.001 and *: p<0.01 (e) Volcano plot showing differential gene expression analysis within the CD4 T cell subpopulation. Colored points represent genes with a p-value < 0.05 (Bonferroni adjusted). (f) Same as in e for the B cell population. (g) Immunofluorescence imaging of fixed lymph node section taken from a GFP-KLF2 reporter mouse. Section was stained for GFP, CD4 and B220. Dotted line represents demarcation between inner and outer regions used during quantification. Scale bar = 200 μm. Zoomed in insets show representative fields within inner and outer regions. (h) Mean fluorescence intensity of GFP-KLF2 signal intensity within CD4 T and B cells in IF image from (g) either inner or outer region. (n=84,152,51,42 for B outer, B inner, T outer, T inner respectively) (i) Mean fluorescence intensity of S100A6 signal within CD4 T and B cells found in outer and inner regions of the lymph node in IF image from (j). Bee swarm plots represent intensities of individual cells with bars denoting standard error. *** p-value < 0.0001, ** p-value < 0.001 * p-value < 0.05 by Wilcoxon’s rank sum test. (n=81,60,31,52 for T Inner, T outer, B Inner, B outer) (j) Fixed frozen lymph node section stained for CD4, B220, and S100A6. Zoomed-in insets show representative fields from outer and inner regions, Scale bar = 200 μm.
Figure 4:
Figure 4:
(a) Schematic of experimental setup. 200k PyMT-ChOVA tumor cells were injected into the inguinal mammary fatpad of 8-week-old female C57Bl/6 mice. After 14 days, 2e6 CD8 T cells from a GFP OTI mouse were adoptively transferred. Following 4 more days, tumor was harvested, sectioned, imaged, and labelled with anti-CD45 Ab conjugated anchor strand (with internal Cy5 modification) hybridized to a caged strand. The section was imaged and ROI’s were illuminated prior to Zipcode 1 or 2 addition as denoted in (b). Imaging of 180 μm live tumor section used for scRNA-Seq in following experiments. Red channel denotes mCherry signal from PyMT-ChOVA tumor cells and green channel denotes adoptively transferred GFP OTI T cells. ROI’s used for Zipcode labeling shown overlaid. Scale bar = 400 μm. (c) UMAP representation of sorted live Cy5+ cells following 10X scRNA-Seq workflow. Cells below nUMI and ZC count threshold or above mitochondrial percentage threshold were filtered out. Assigned regional id based on ZC1:ZC2 counts overlaid. Large scale populations annotated based on similarity to known markers on Immgen. (n=4916 cells) (Mean nUMI = 22.5k, Mean nGene = 3939, Mean nZC = 6564, Cutoffs: nGene > 500, percent mitochondrial < 0.15) (d) Stacked bar charts denoting regional distributions of major immune cell populations from data in (c). (e) UMAP dimensional reduction on Monocyte/Macrophage population subset with regional identity as determined by ZC1:ZC2 ratio. (n=3144 cells) (Mean nUMI = 25k, Mean nGene = 4239, Mean nZC = 5268, Cutoffs: nGene = 500, percent mitochondrial = 0.1) (f) Feature plot of UMAP representation in (e) with normalized gene expression denoted by color scale for Ly6c2 as a marker for monocytes and C1qc as tumor-associated macrophage (TAM) marker. (g) UMAP representation of monocyte/macrophage population with state identity calculated from Monocle pseudotime analysis in (h) overlaid. Arrows represent differentiation trajectory from the monocyte population to the terminal macrophage populations. Each major state is annotated with a selected marker genes. (h) DDR Tree dimensional reduction of monocyte/macrophage population as computed by Monocle with state identities overlaid. Arrows denote increasing pseudotime with the Ly6CHi, Ccr2Hi state designated as the root. (i) DDR Tree dimensional reduction of monocyte/macrophage population plotted with regional localization overlaid. Pie charts represent regional distributions (marginal vs. interior) for each state. (j) UMAP dimensional reduction on cells within the T cell clusters expressing at least one GFP transcript. Regional identity as determined by ZC1:ZC2 ratio overlaid. (n=265 cells)(Mean nUMI = 24.7k, Mean nGene = 4083, Mean nZC = 12k, Cutoffs: nGene > 500, percent mitochondrial < 0.15) (k) UMAP representation with gene expression signature scores overlaid. Exhaustion vs. naive gene signature scores ere calculated for the Gfp+ T cell subpopulation (cells within lymphoid clusters with at least one Gfp transcript) and these scores overlaid on the UMAP representation. Violin plot represents this score distribution based on regional identity. Bottom row represent similar quantification of a terminal vs. stem-like exhausted signature score. (l) Volcano plot showing top differentially expressed genes in the Gfp+ T cell subpopulation based on regional identity. Colored points represent genes with a p-value < 0.05 (Bonferroni adjusted).
Figure 5:
Figure 5:
(a) Schematic of oligonucleotide design used for defining 4 regions by adding a second layer of caged oligonucleotides. A secondary oligonucleotide duplex bearing an orthogonal caged O2 overhang can hybridize to the uncaged O1 sequence. With a combination of Zipcode strands with either an overhang region O1’ or O2’, 4 distinct regions can be defined by 4 Zipcode species. Workflow illustrates the ability to define 4 such regions through fluorescence tagging of these oligonucleotide strands. Scale bar = 100 μm. (b) B cells extracted from C57Bl/6 mice were labeled with CFSE and CD8 T cells were extracted from a CD2-RFP mouse and adoptively transferred into a C57Bl/6 mouse. Lymph nodes were harvested, sectioned and labeled with anti-CD45 Ab conjugated anchor strand (with internal Cy5 modification) hybridized to a caged strand. Following imaging, 4 regions were defined with a unique Zipcode 1-4 as overlaid onto the micrograph. These 4 regions were generated using the sequence of illumination and oligonucleotide additions shown. Scale bar = 400 μm. (c) tSNE dimensional reduction of sorted live, Cy5+ cells from LN section shown in (b) with regional identity overlaid following 10X workflow. Major immune populations are annotated. (n=5489 cells) (Mean nUMI = 3.9k, mean nGene = 1273, Cutoffs: nGene > 400, percent.mito < 0.15) (d) Bar chart illustrating distribution of cells in each of the 4 regions for selected immune cell populations in (c). (e) Plots of mean scaled gene expression levels within the CD4 T cell cluster as a function of regional assignment for selected genes. (f) Plots of average scaled gene expression levels within the CD4 T cell cluster as a function of regional assignment for Klf2 and two similar and dissimilar genes as calculated by cross-correlation score. Genes with significantly different expression levels and a logFC threshold of 0.4 between at least one pair of regions were considered for analysis. Cross-correlation scores were calculated between the averaged scaled expression levels of these genes and the reference gene. (g) Similar analysis with S100a6 as reference. (n=171/262/141/49 cells) (h) Schematic of second design iteration. An anchoring moiety is conjugated to an anchor sequence which is hybridized to an oligonucleotide with a NPOM caged overhang sequence. Each additive Zipcode duplex block consists of a Zipcode strand with a complement to the overhang sequence, a universal hybridization sequence, an 8 nt barcode, and a 28 nt polyA sequence. Meanwhile, a strand with a caged overhang is hybridized to the Zipcode sequence through the universal hybridization sequence. In this way, Zipcode blocks are added on in a combinatorial manner, defining 2N populations based on presence or absence of a given Zipcode block. (i) Demonstration of combinatorial spatial barcoding of a field of cells in an exponentially scaling manner. Conjugate labeled CD8 T cell were plated and subjected to a 3X sequence of illumination patterns and Zipcode block additions bearing distinct fluorophores resulting in 8 regions with distinct fluorophore combinations. Scale bar = 50 μm.

Comment in

  • A zipcode for transcriptomes.
    Burgess DJ. Burgess DJ. Nat Rev Genet. 2020 Sep;21(9):508-509. doi: 10.1038/s41576-020-0266-4. Nat Rev Genet. 2020. PMID: 32661360 No abstract available.

Similar articles

Cited by

References

    1. Galli SJ, Borregaard N, Wynn TA. Phenotypic and functional plasticity of cells of innate immunity: Macrophages, mast cells and neutrophils. Nat Immunol. 2011;12(11):1035–1044. doi:10.1038/ni.2109 - DOI - PMC - PubMed
    1. Stegle O, Teichmann SA, Marioni JC. Computational and analytical challenges in single-cell transcriptomics. Nat Rev Genet. 2015;16(3):133–145. doi:10.1038/nrg3833 - DOI - PubMed
    1. Goltsev Y, Samusik N, Kennedy-Darling J, et al. Deep Profiling of Mouse Splenic Architecture with CODEX Multiplexed Imaging. Cell. 2018;174(4):968–981.e15. doi:10.1016/j.cell.2018.07.010 - DOI - PMC - PubMed
    1. Angelo M, Bendall SC, Finck R, et al. Multiplexed ion beam imaging of human breast tumors. Nat Med. 2014;20(4):436–442. doi:10.1038/nm.3488 - DOI - PMC - PubMed
    1. Ståhl PL, Salmén F, Vickovic S, et al. Visualization and analysis of gene expression in tissue sections by spatial transcriptomics. Science (80- ). 2016;353(6294):78–82. doi:10.1126/science.aaf2403 - DOI - PubMed

Publication types