. 2020 Sep;5(9):1158-1169.
doi: 10.1038/s41564-020-0749-2. Epub 2020 Jul 6.

Collective interactions augment influenza A virus replication in a host-dependent manner

Affiliations

Collective interactions augment influenza A virus replication in a host-dependent manner

Kara L Phipps et al. Nat Microbiol. 2020 Sep.

Abstract

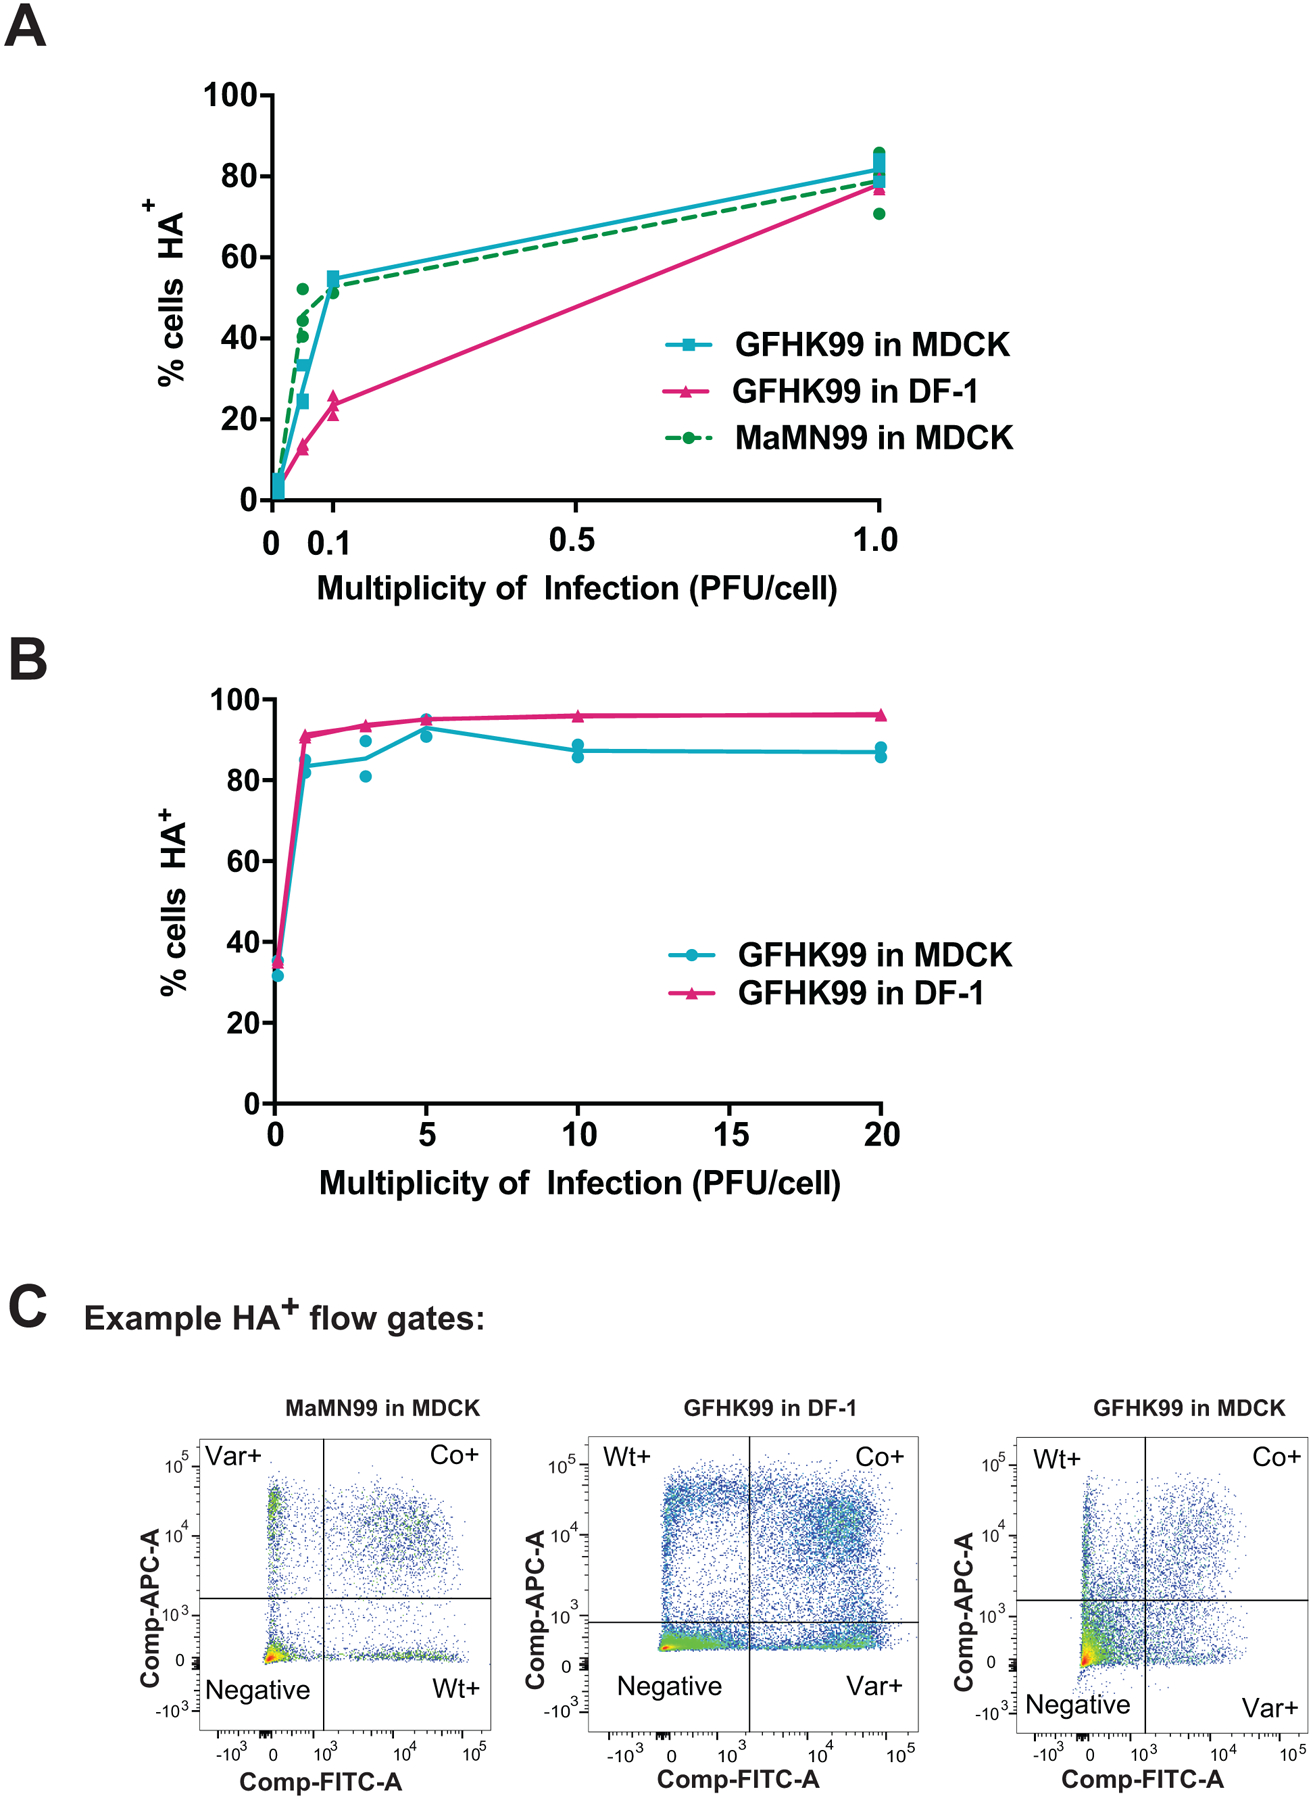
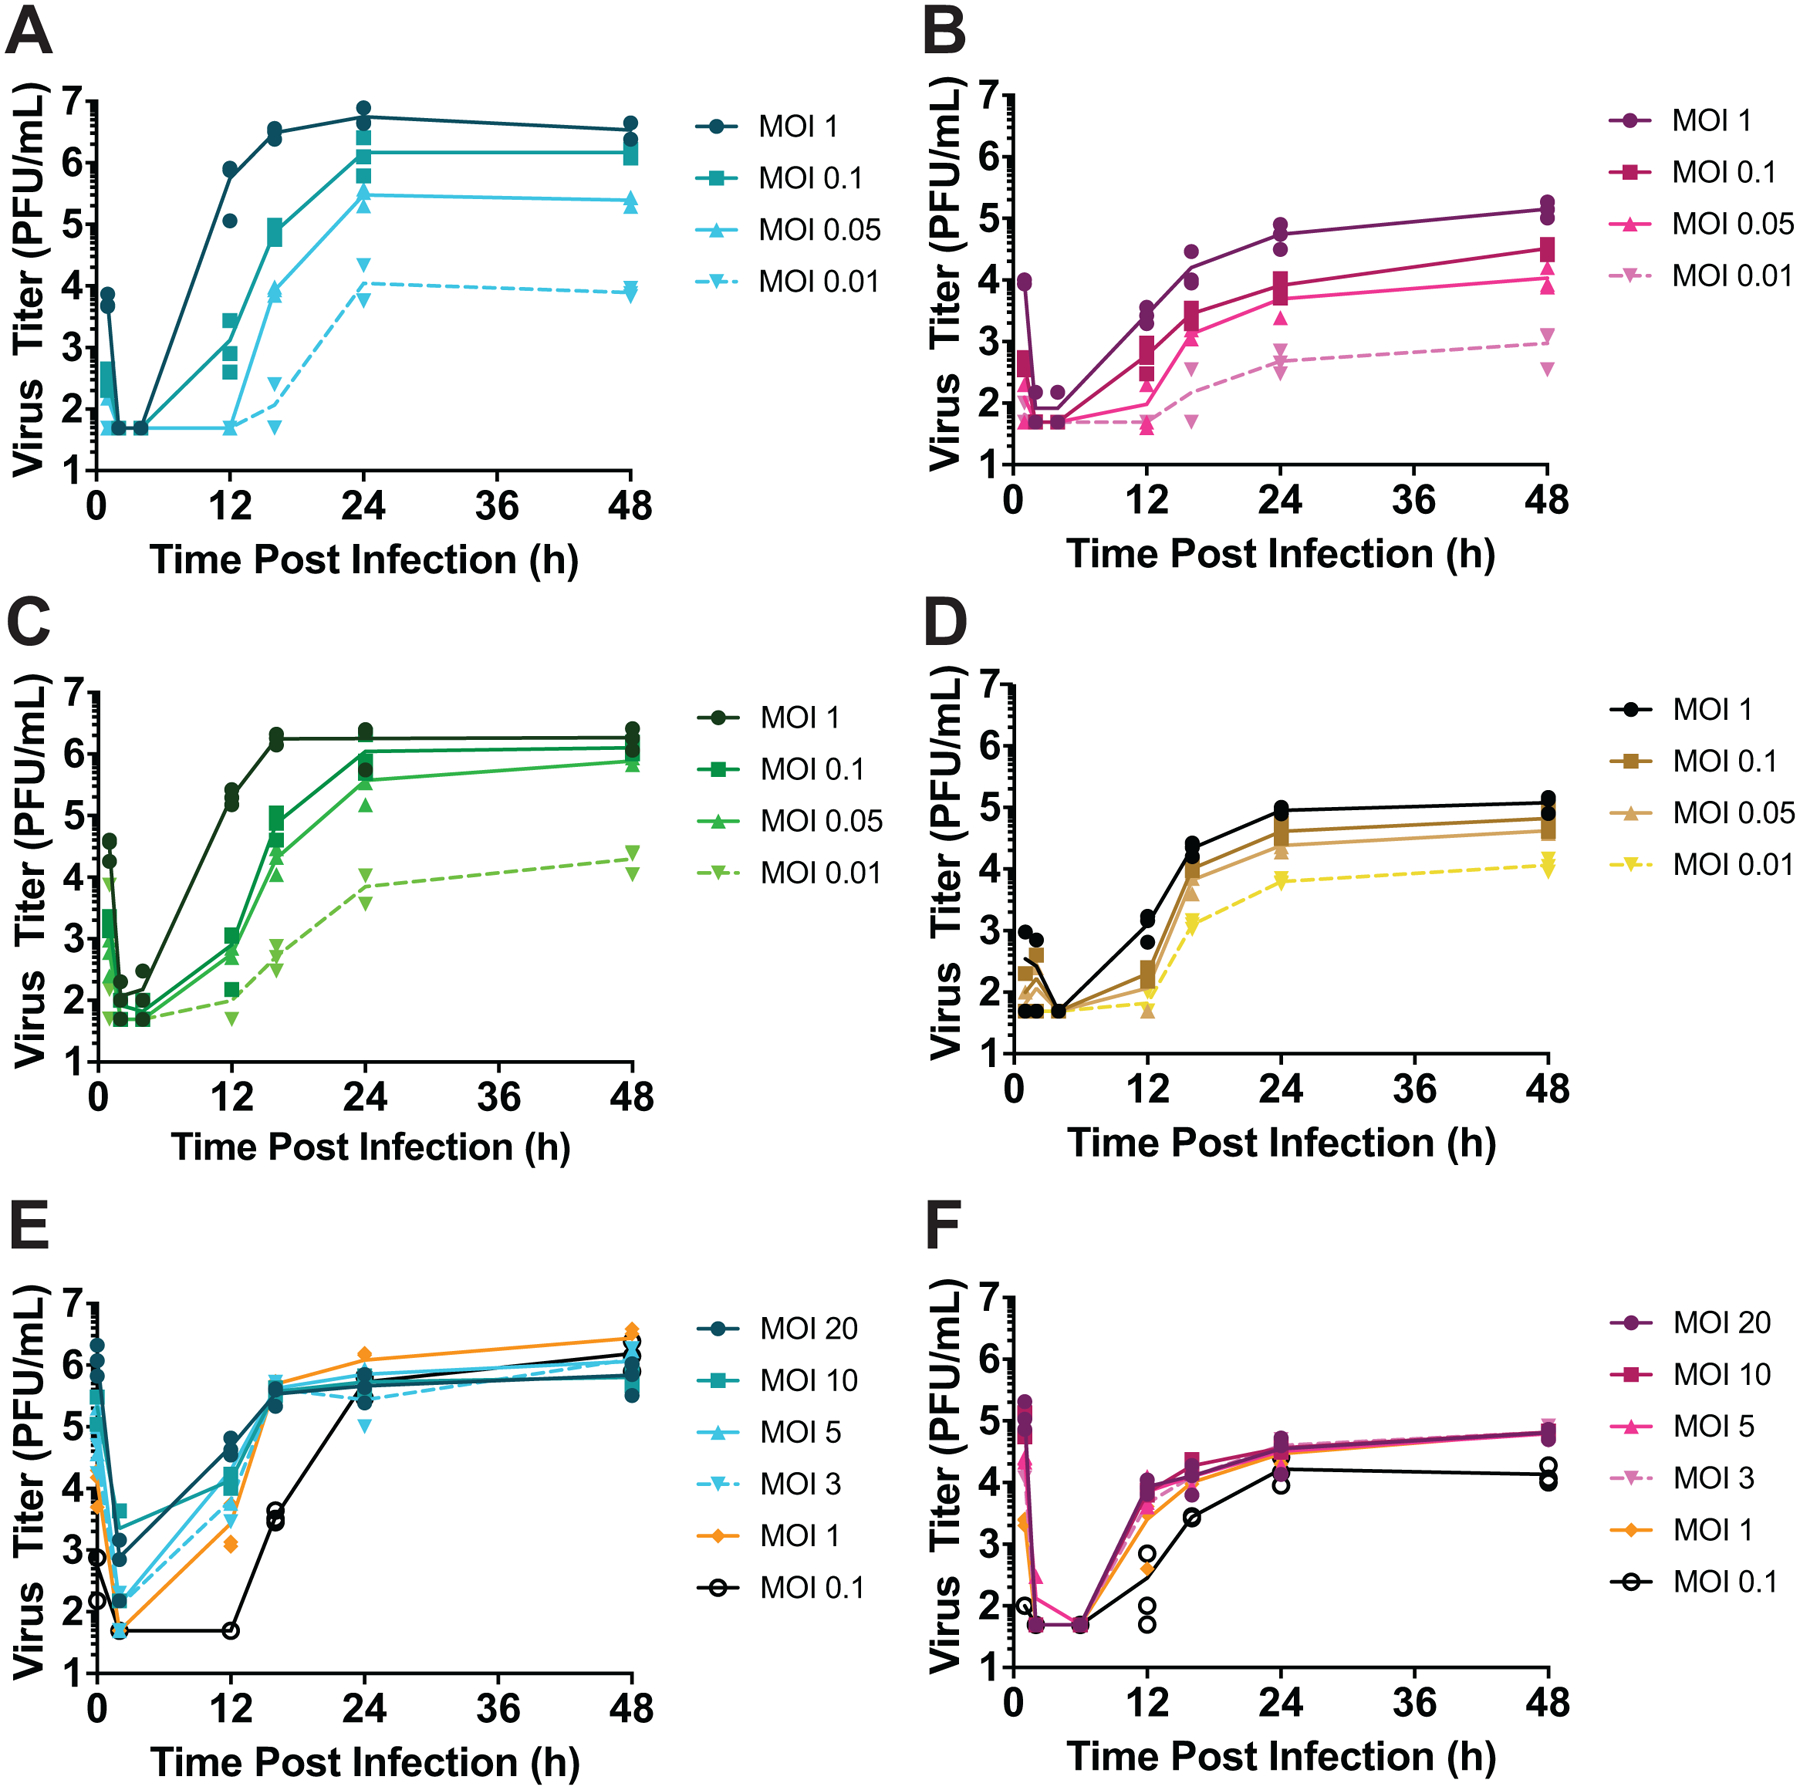
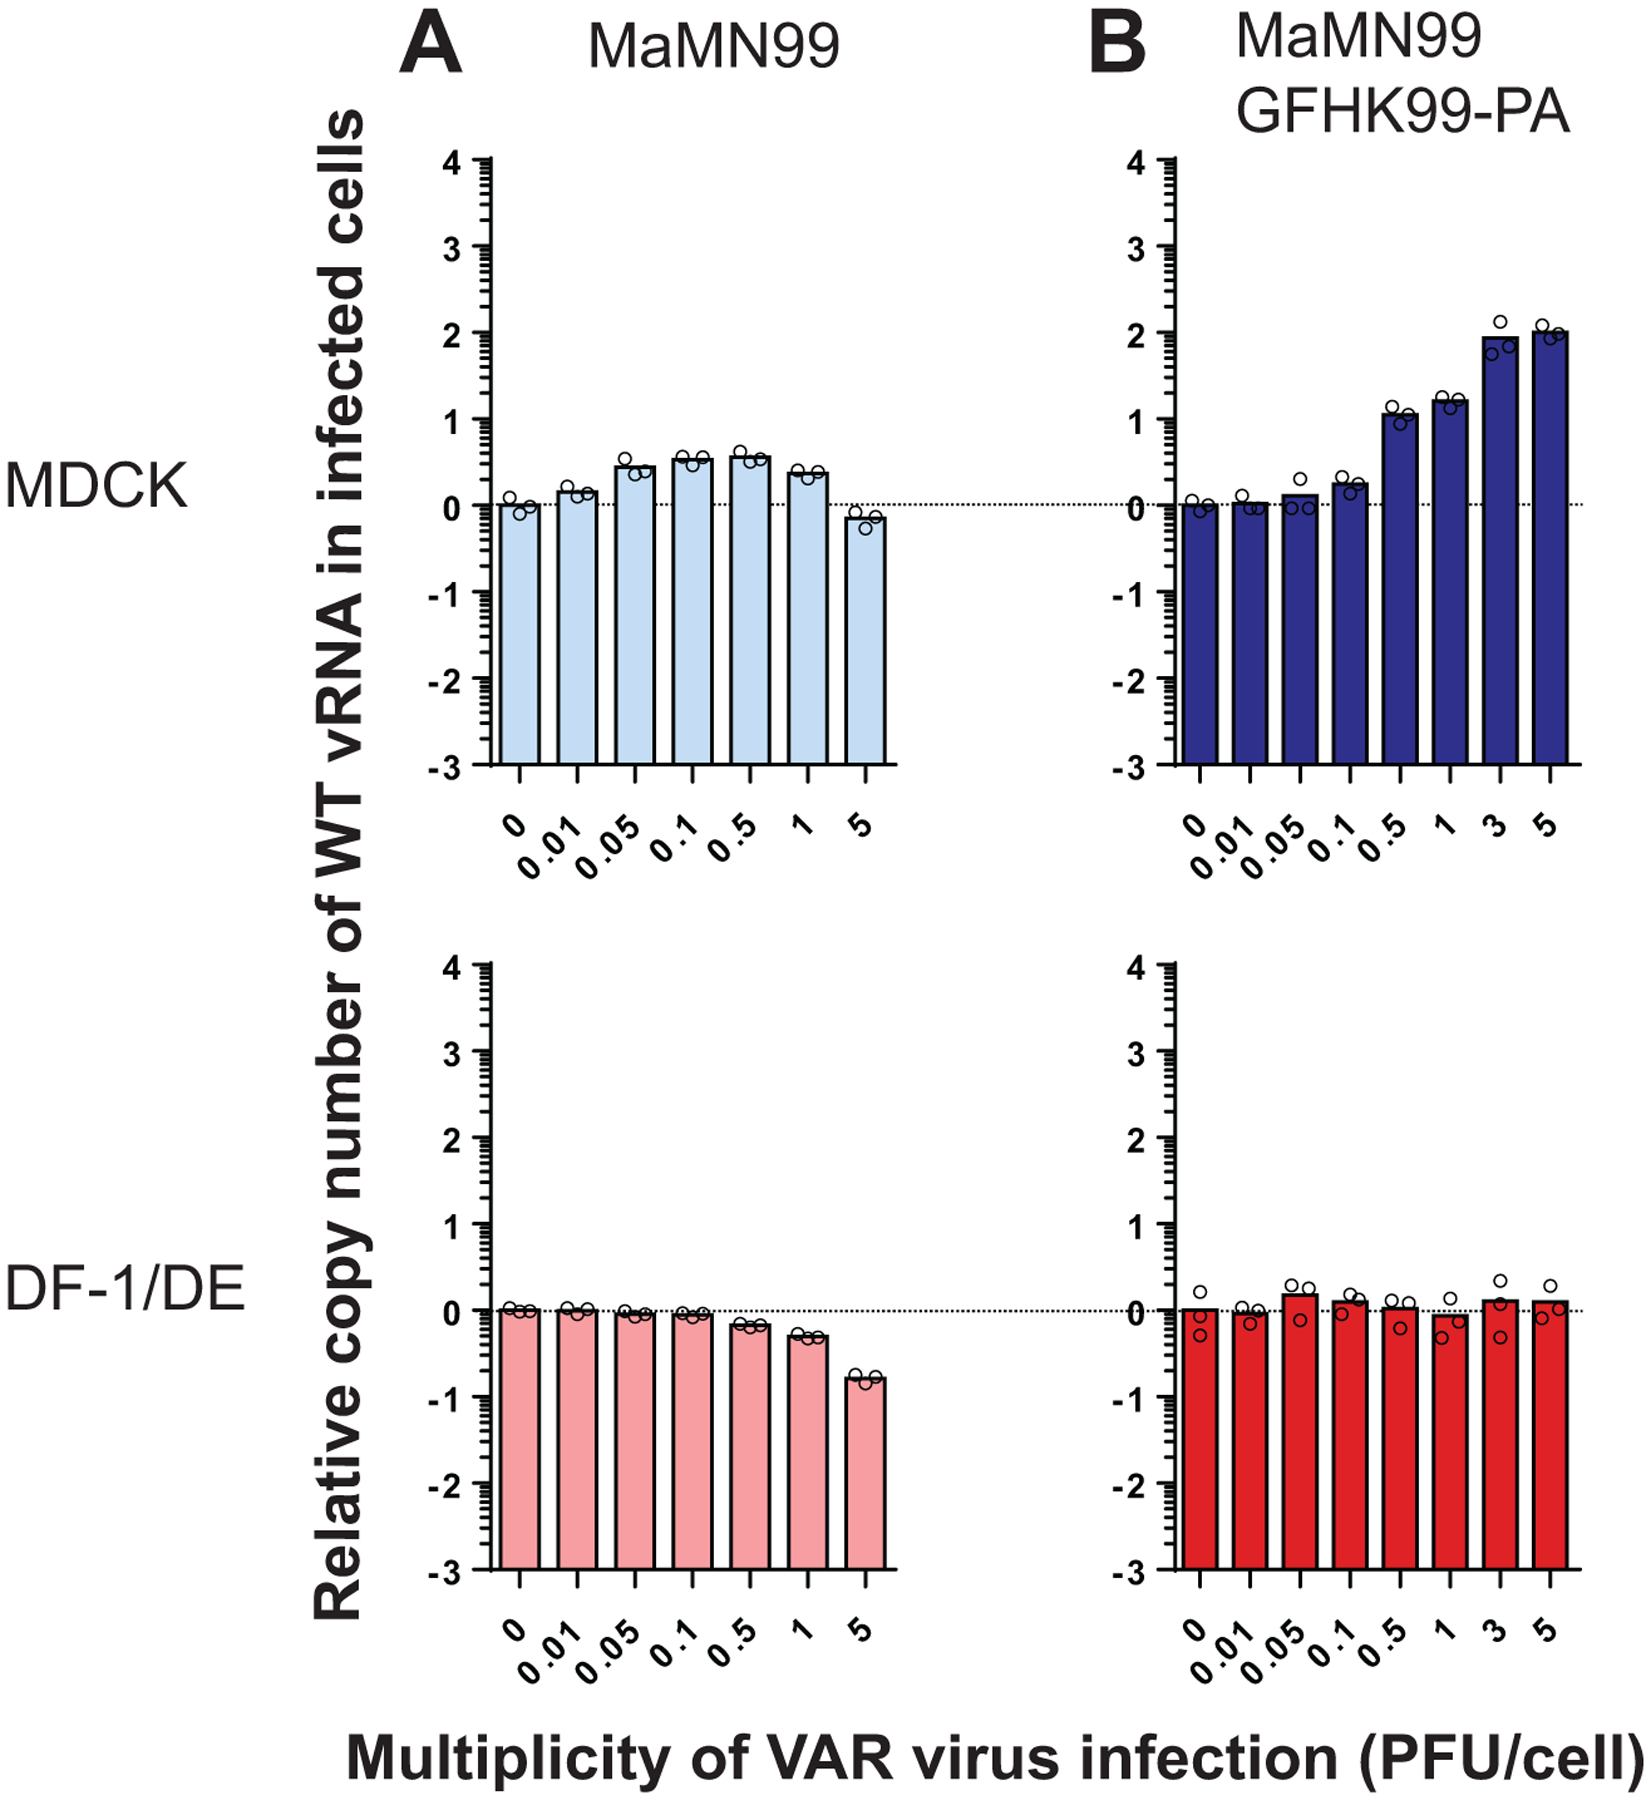
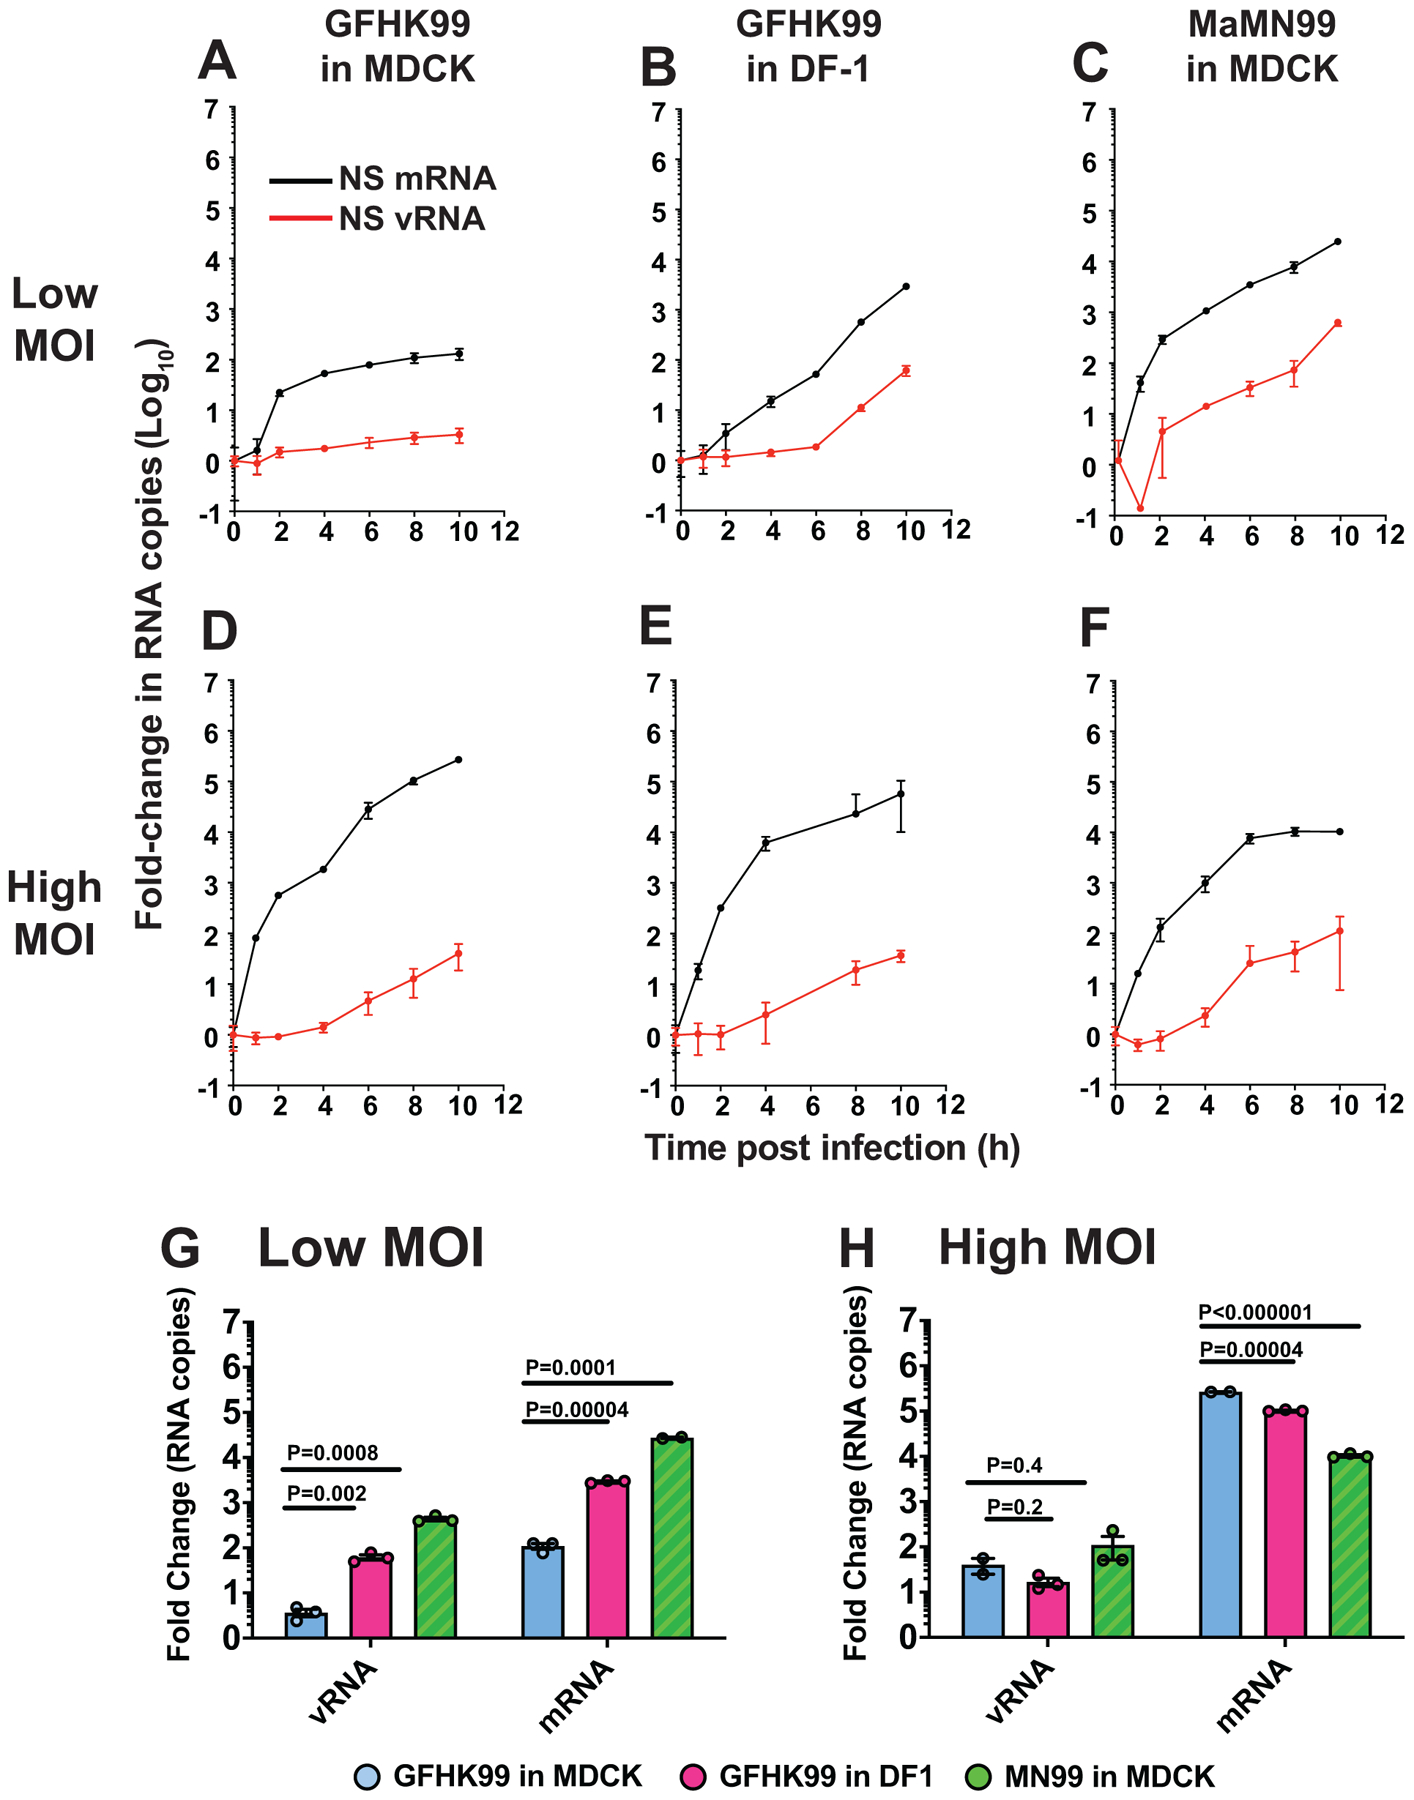
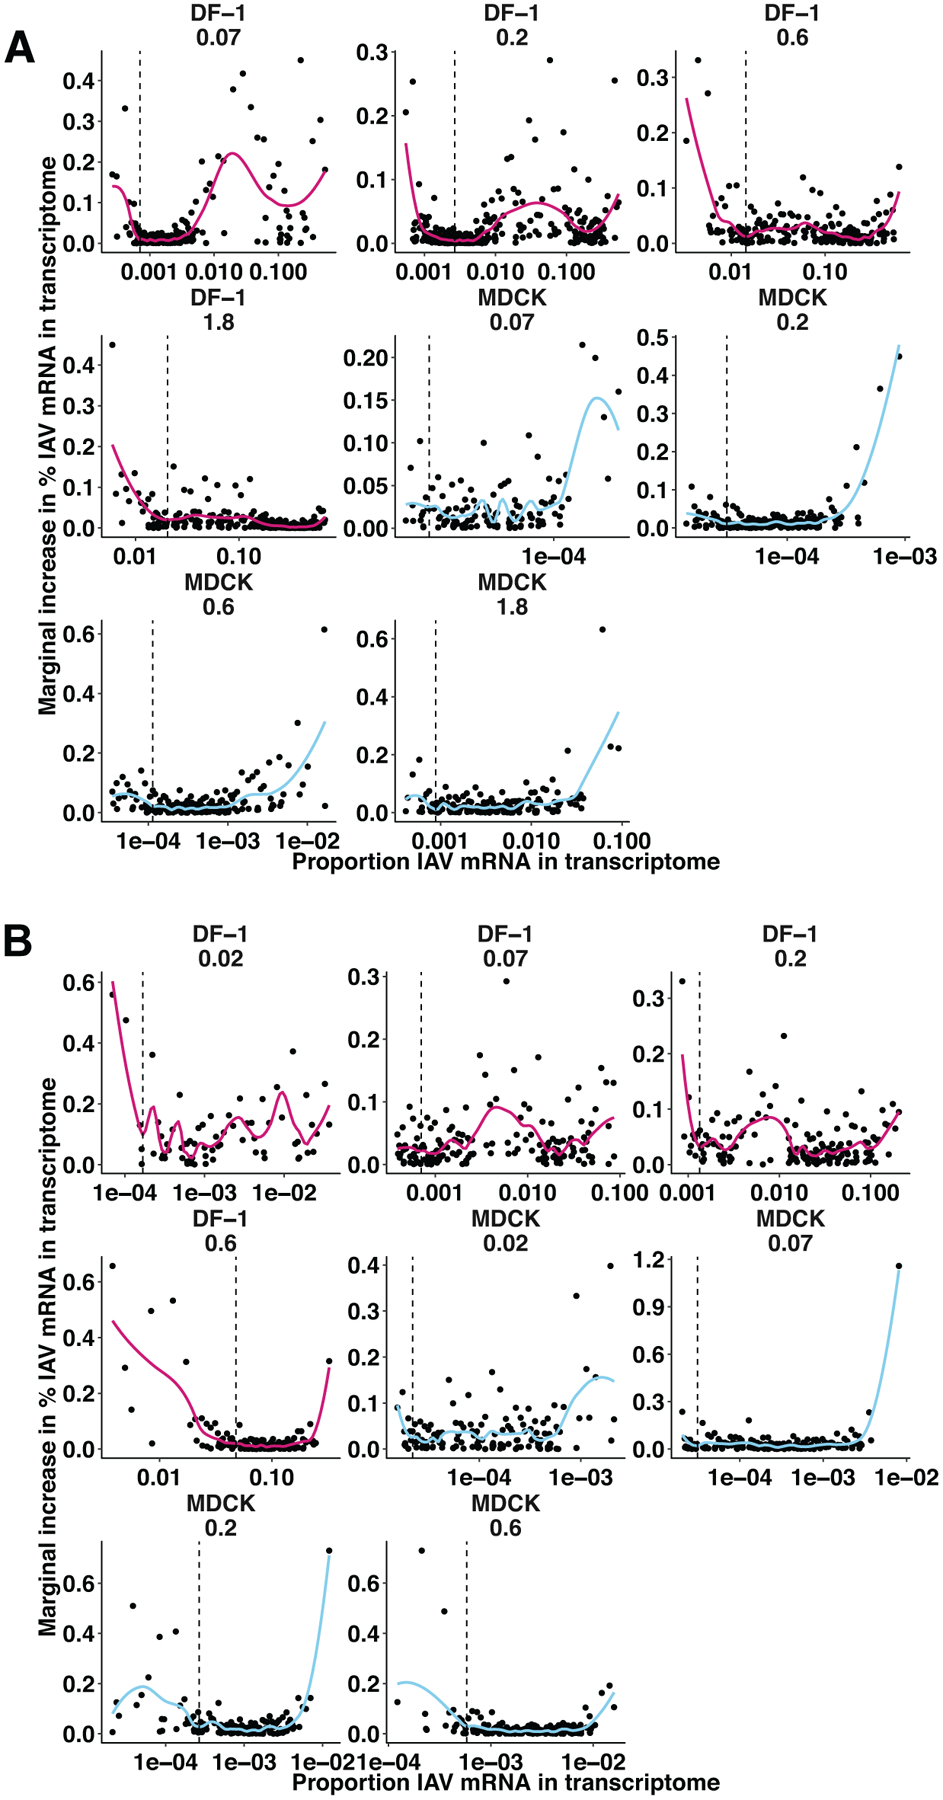
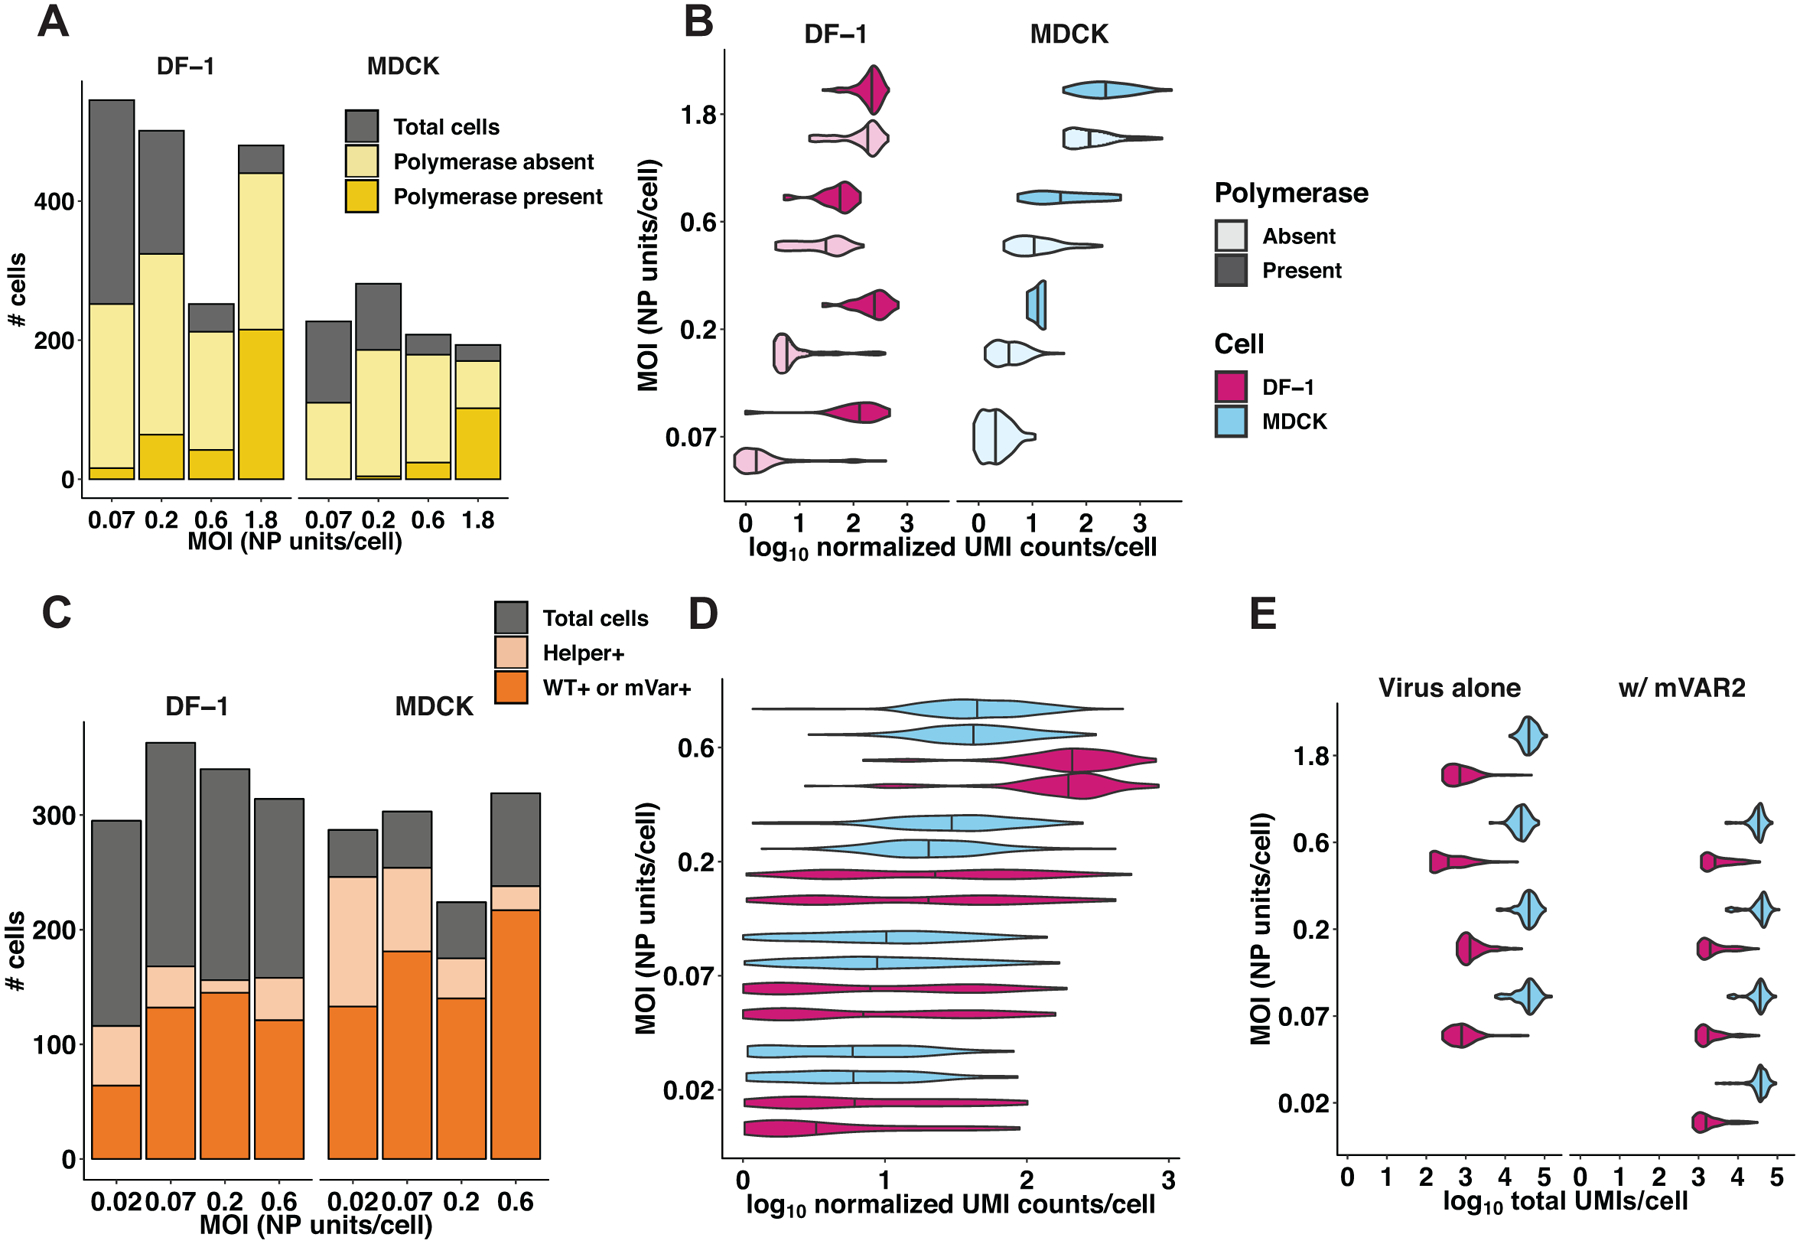
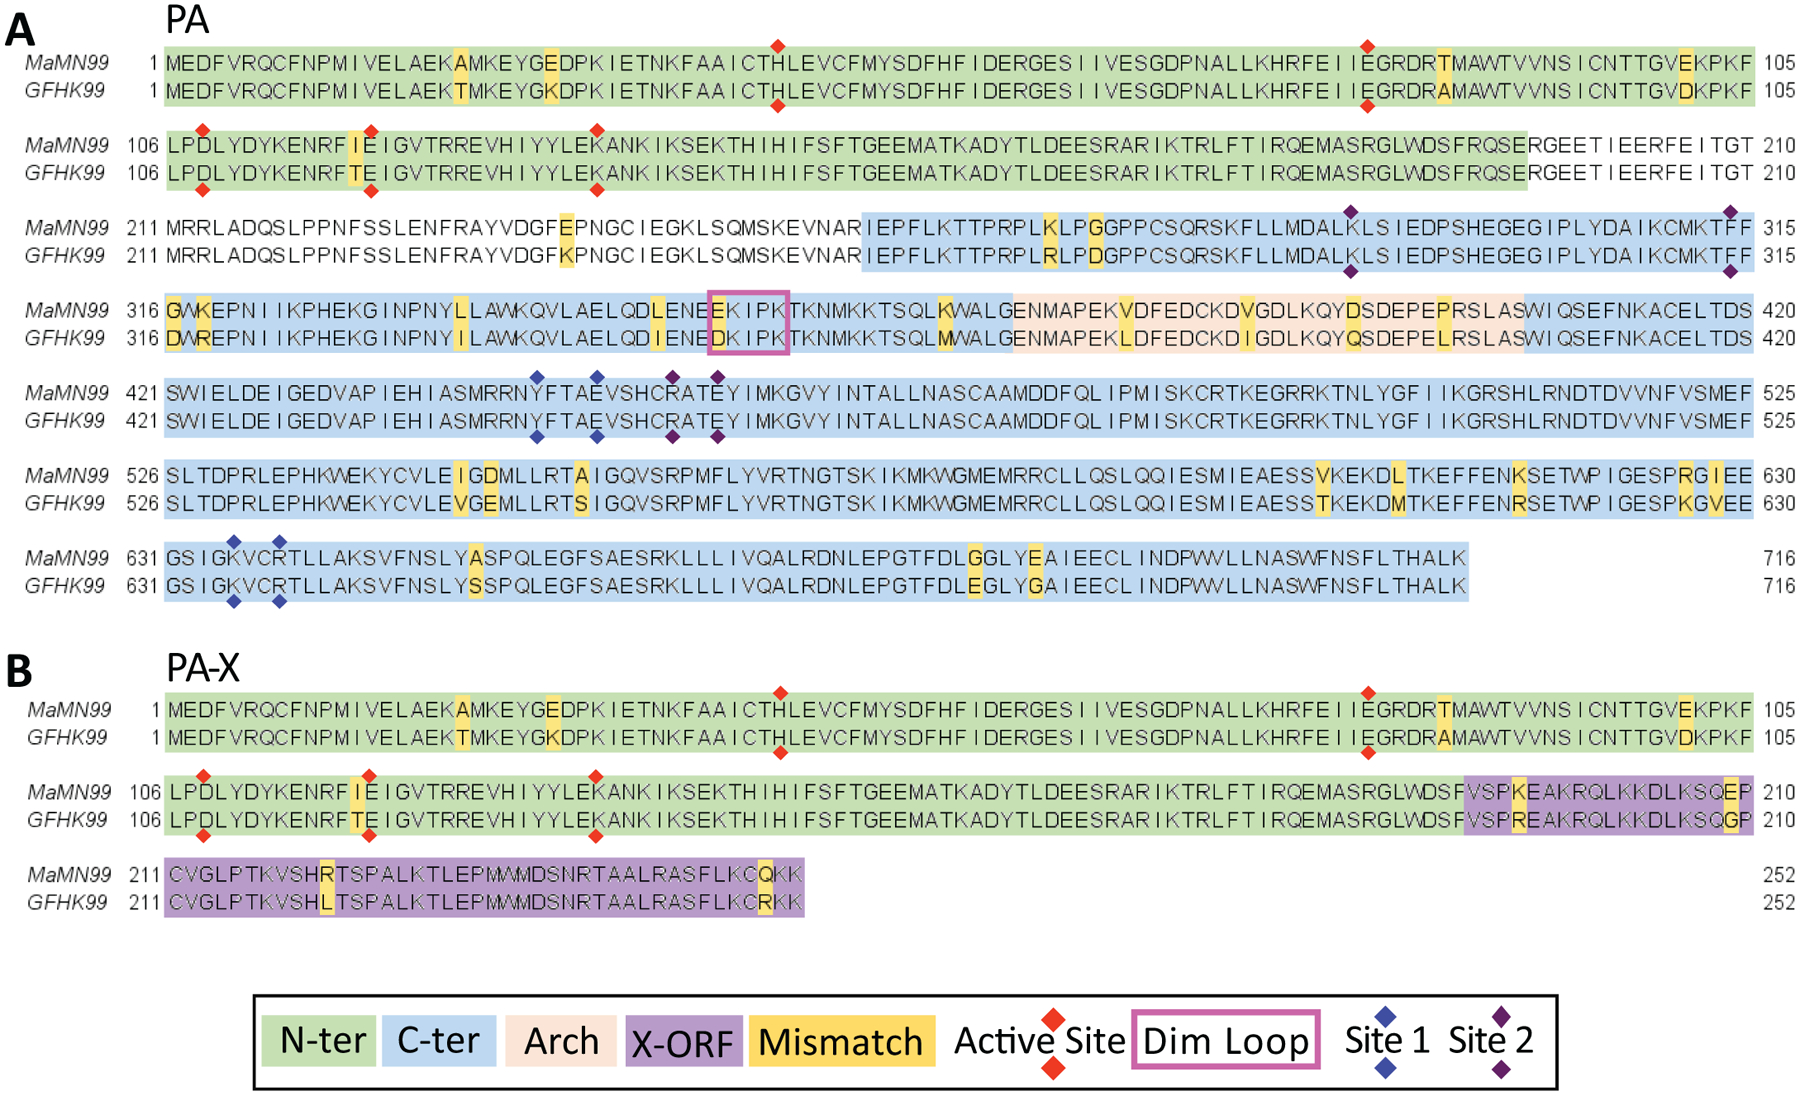
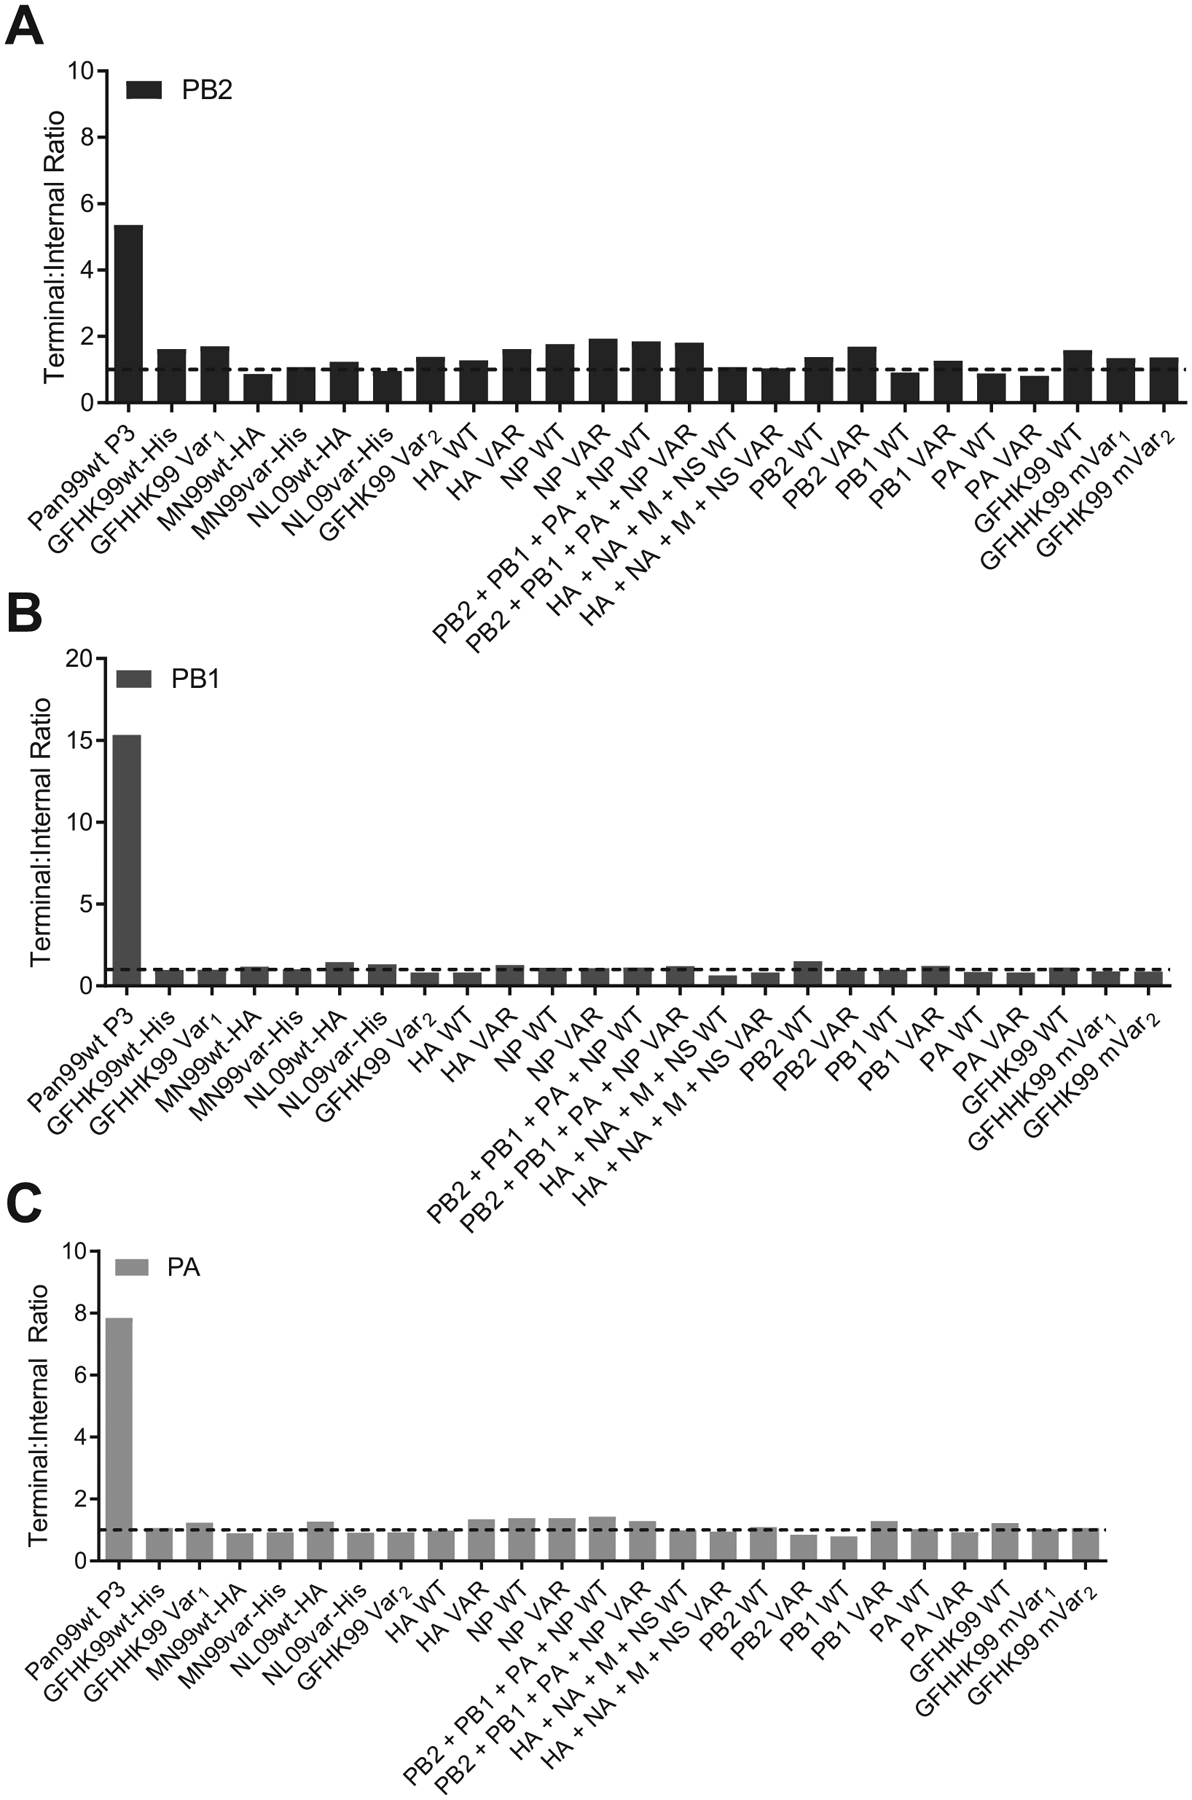
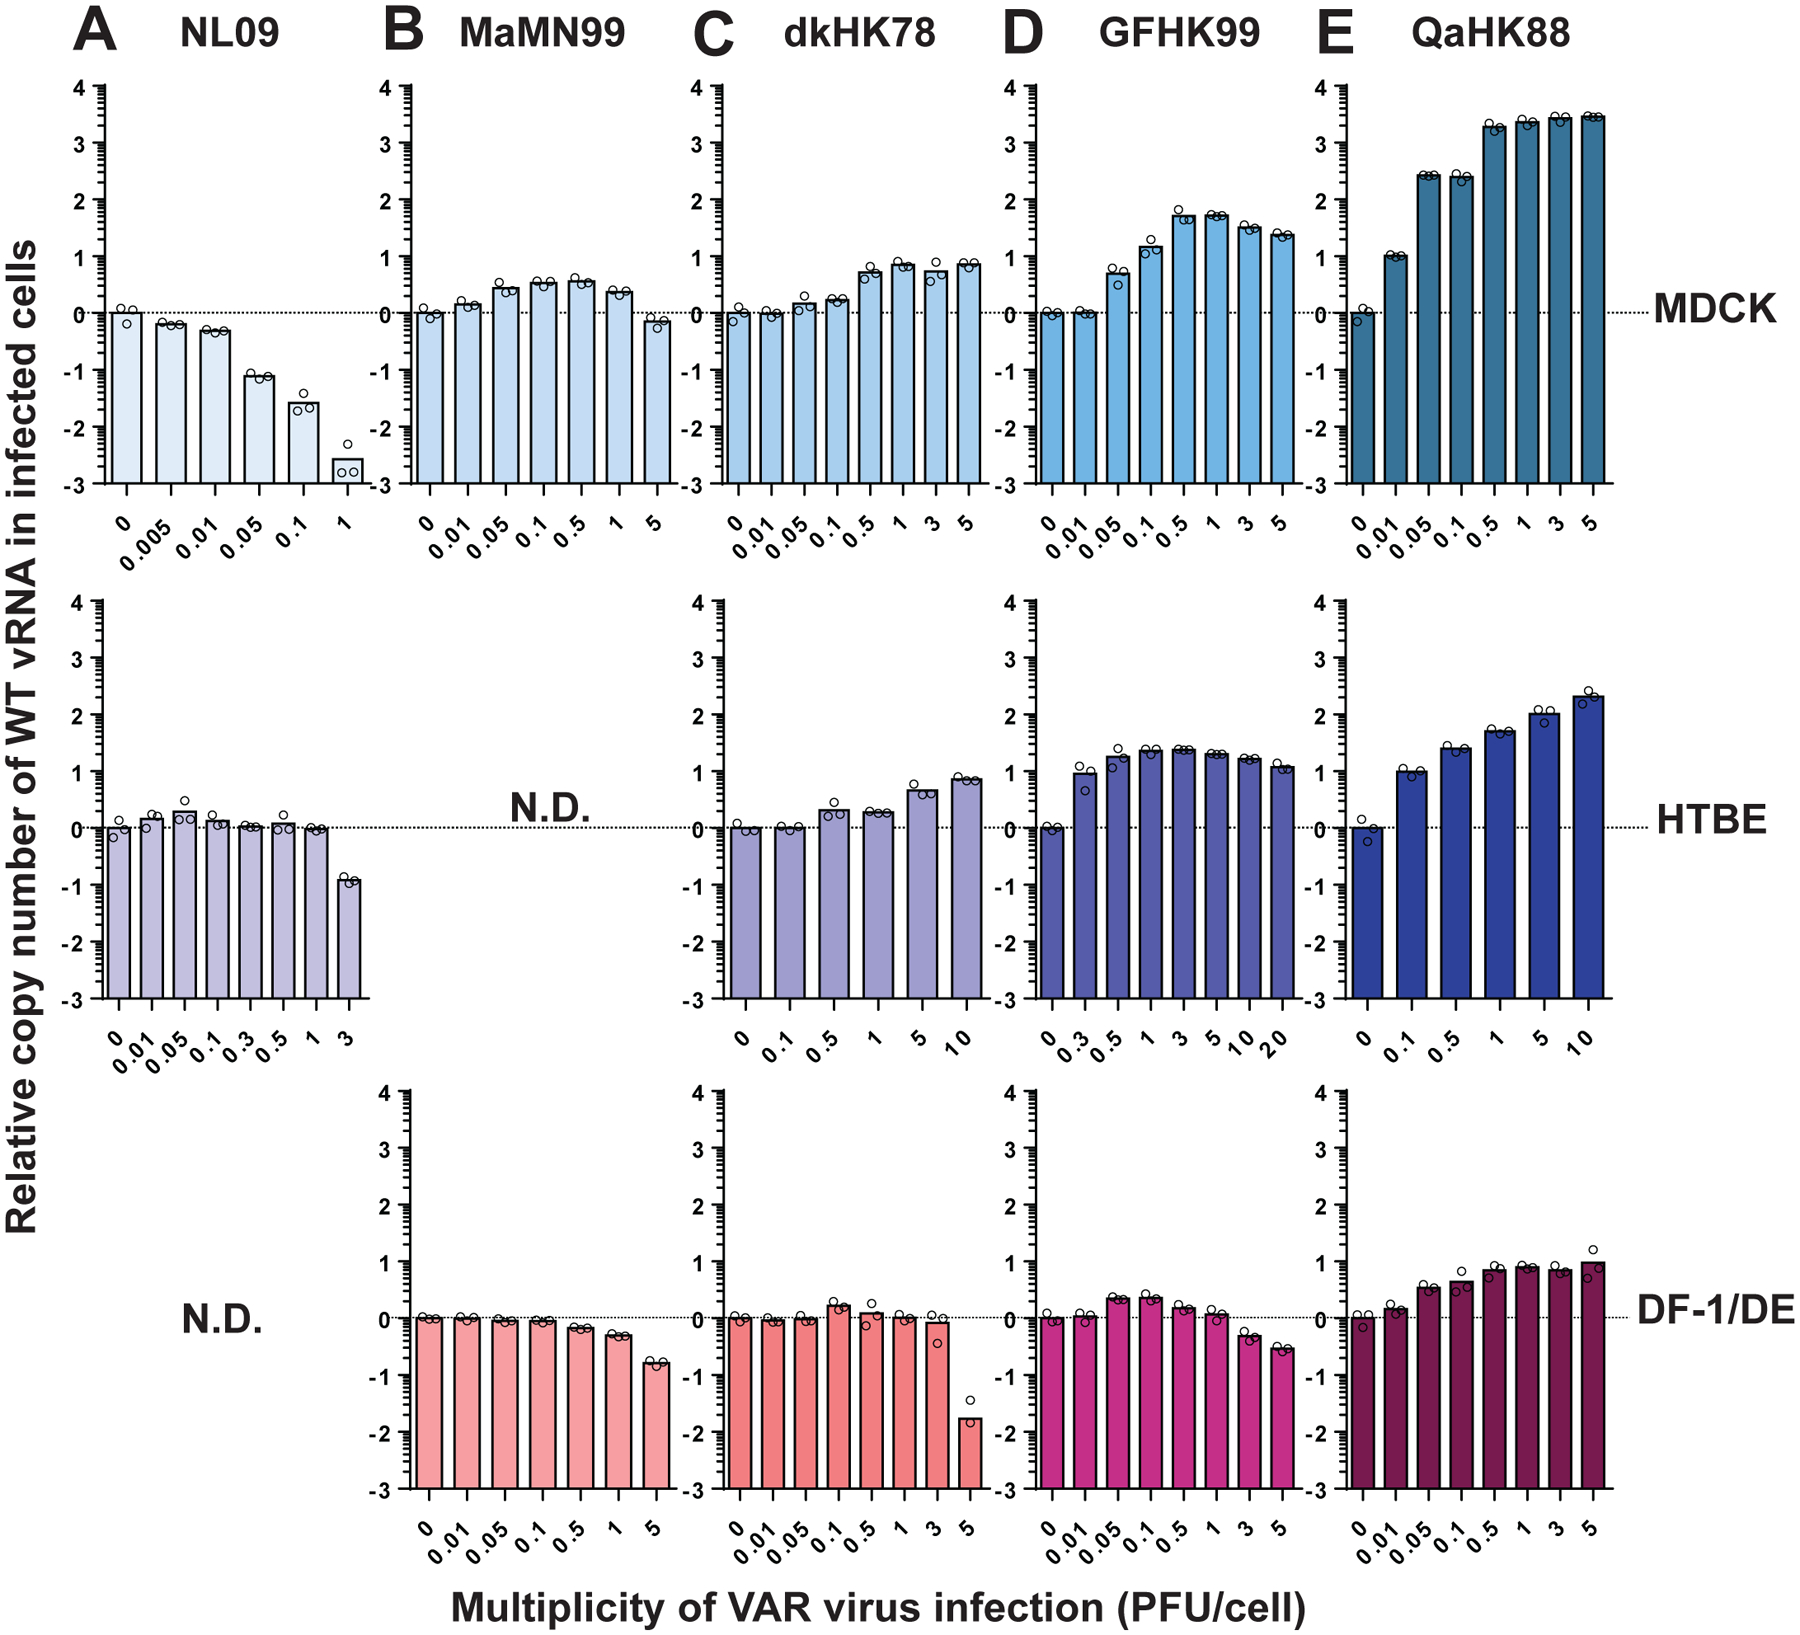
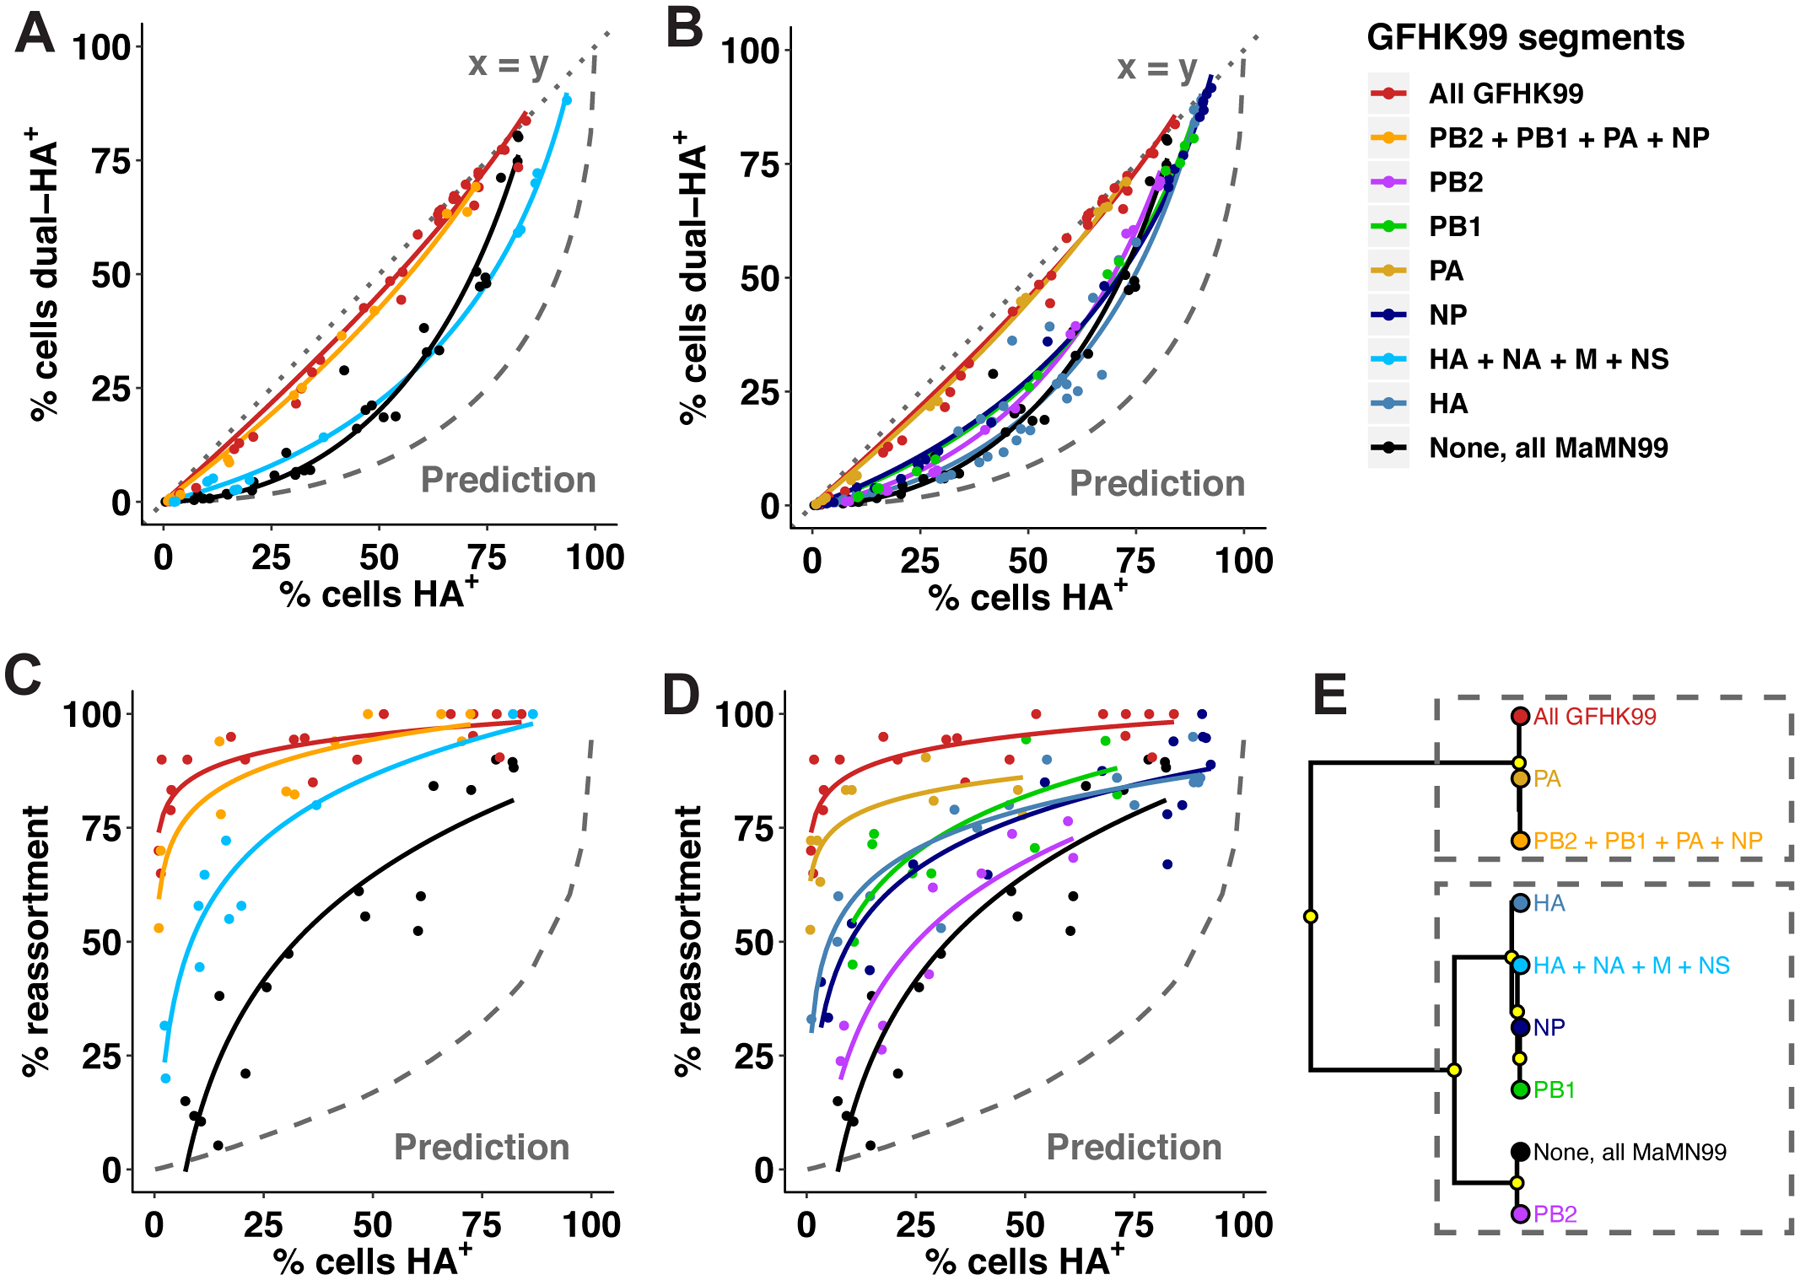
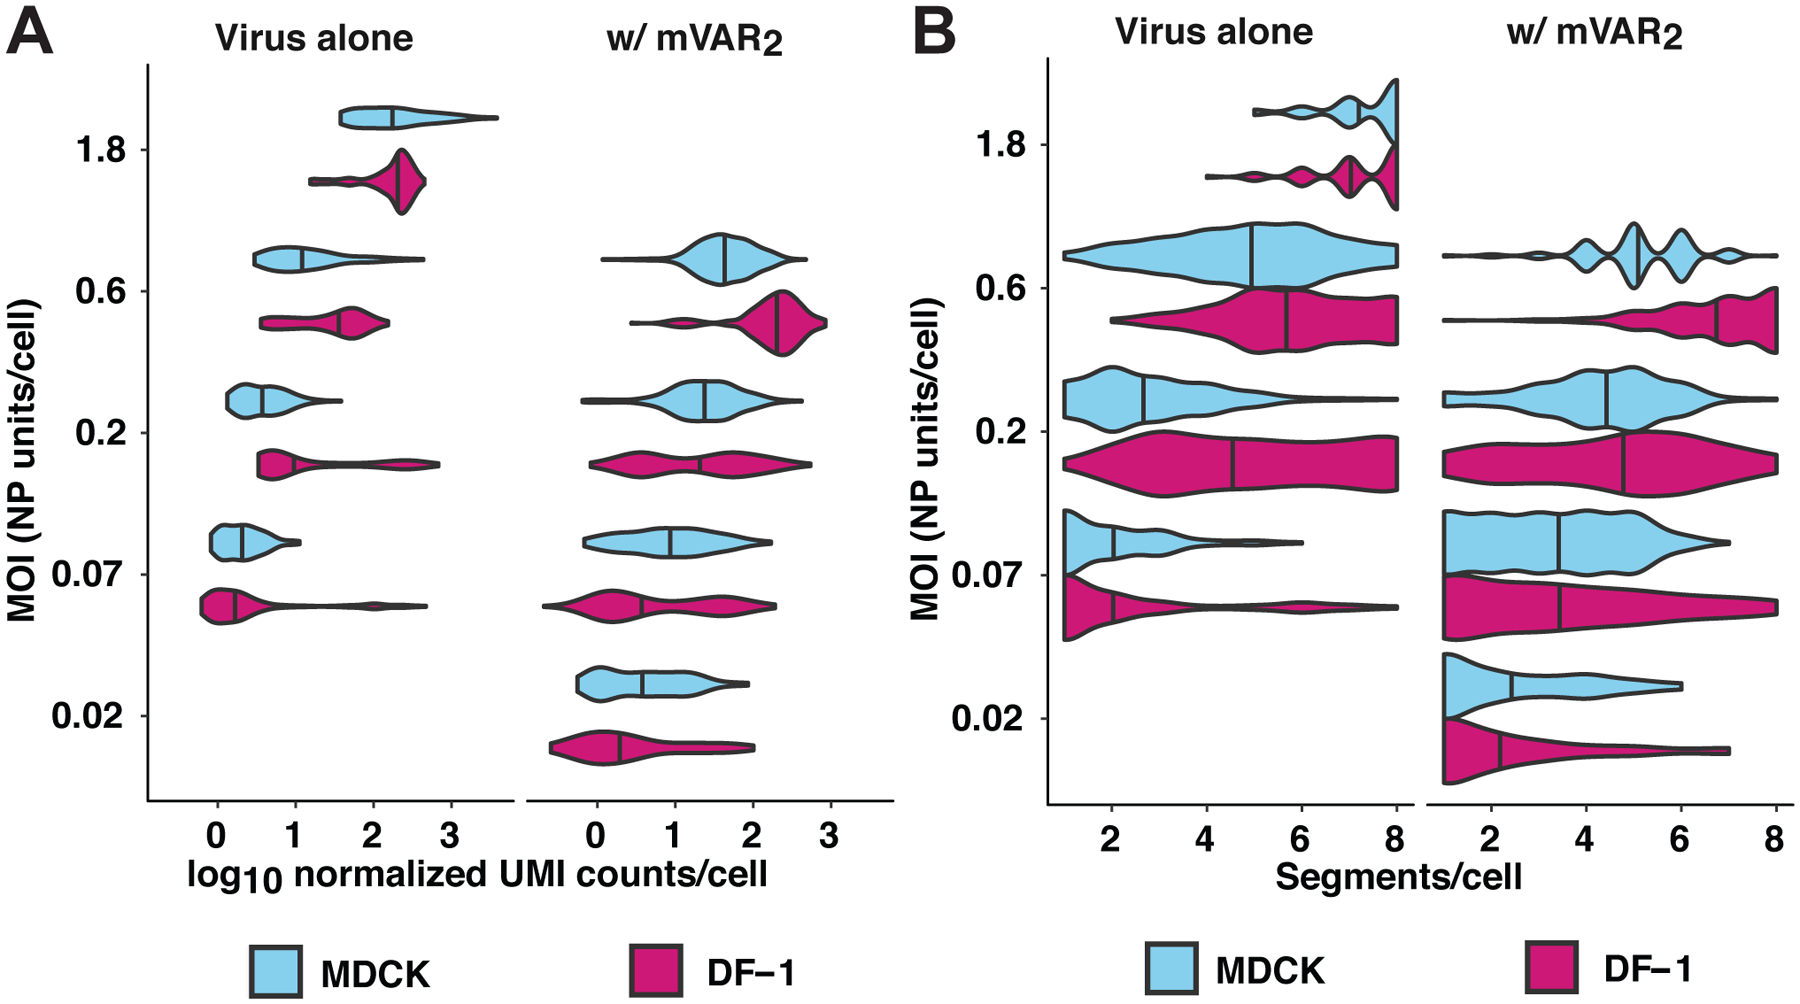
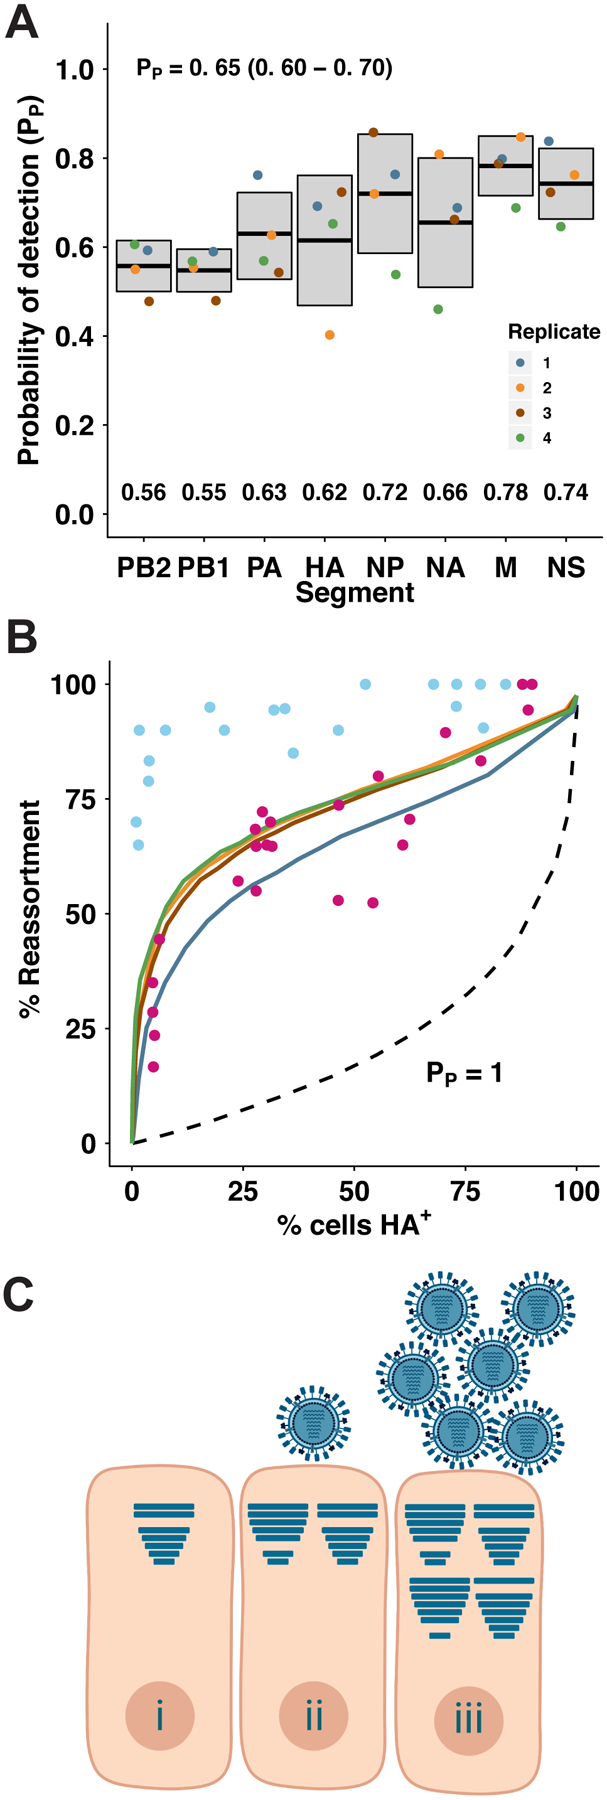
Infection with a single influenza A virus (IAV) is only rarely sufficient to initiate productive infection. Instead, multiple viral genomes are often required in a given cell. Here, we show that the reliance of IAV on multiple infection can form an important species barrier. Namely, we find that avian H9N2 viruses representative of those circulating widely at the poultry-human interface exhibit acute dependence on collective interactions in mammalian systems. This need for multiple infection is greatly reduced in the natural host. Quantification of incomplete viral genomes showed that their complementation accounts for the moderate reliance on multiple infection seen in avian cells but not the added reliance seen in mammalian cells. An additional form of virus-virus interaction is needed in mammals. We find that the PA gene segment is a major driver of this phenotype and that both viral replication and transcription are affected. These data indicate that multiple distinct mechanisms underlie the reliance of IAV on multiple infection and underscore the importance of virus-virus interactions in IAV infection, evolution and emergence.


Conflict of interest statement

Conflict of interest statement

The authors declare no conflicts of interest.

Figures

Extended Data Fig. 1
Extended Data Fig. 1. Level of infection achieved in single cycle growth assays, as determined by flow cytometric detection of HA protein.
Triplicate or duplicate wells of cells were harvested at 24 h post-infection and stained to detect surface expression of HA and HIS epitope tags. Panel A) corresponds to Extended Data Figure 2 A–C and Panel B) corresponds to Extended Data Figure 2 E–F. Lines connect the means of n=2 or n=3 replicate samples. C) Flow gating was performed by excluding cell debris and multiplet cells. Quadrant gates were used to quantify each population. Flow cytometry results are representative of those obtained in three independent experiments.
Extended Data Fig. 2
Extended Data Fig. 2. Increasing MOI increases viral productivity at sub-saturating, but not saturating MOIs.
Data relate to Figure 2. MDCK or DF-1 cells were infected under single-cycle conditions at a range of MOIs. Low MOI range is shown in panels (A) to (D) and high MOI range is shown in panels (E) and (F). As shown in Extended Data Figure 1, MOIs < 1 PFU/cell were found to be sub-saturating. Viral titers observed at the indicated MOIs are plotted against time post-infection for GFHK99 virus in MDCK cells (A), GFHK99 virus in DF-1 cells (B), MaMN99 virus in MDCK cells (C), NL09 virus in MDCK cells (D), GFHK99 virus in MDCK cells (E), and GFHK99 virus in DF-1 cells (F). Lines connect the mean values for technical replicates sampled at each time point.
Extended Data Fig. 3
Extended Data Fig. 3. Introduction of the PA gene segment from GFHK99 virus into MaMN99 virus confers increased dependence on multiple infection for vRNA synthesis.
Cells were coinfected with WT virus and increasing doses of VAR virus. WT virus MOI was 0.005 PFU per cell. The fold change in WT vRNA copy number, relative to that detected in the absence of VAR virus, is plotted for MaMN99 virus (A) and MaMN99-GFHK99-PA virus (B). Bars represent the mean of n=3 replicate cell cultures per condition. Data shown in panel (A) are also shown in Figure 3. MaMN99 virus was tested in MDCK and DE cells; MaMN99 GFHK99-PA virus was tested in MDCK and DF-1 cells.
Extended Data Fig. 4
Extended Data Fig. 4. High multiplicity of infection is needed for robust GFHK99 polymerase activity in MDCK cells.
MDCK or DF-1 cells were infected with GFHK99 or MaMN99 virus at low (0.5 RNA copies per cell) or high (3 HA-expressing units per cell) MOI. NS segment vRNA and mRNA was quantified at the indicated time points (A–F). The average fold change from initial (t=0) to peak RNA copy number is plotted for low MOI infections (G) and high MOI infections (H). Mean and standard deviation are plotted for n=3 replicate cell cultures sampled sequentially. Significance was assessed by multiple unpaired, two-sided t-tests with correction for multiple comparisons using the Holm-Sidak method, with alpha = 5.0%. Each row was analyzed individually, without assuming a consistent SD.
Extended Data Fig. 5
Extended Data Fig. 5. Preliminary analysis of single-cell mRNA sequencing data to exclude cells with viral mRNA that are likely uninfected.
A) Within each infection, cells in which viral RNA was detected were rank ordered by the proportion of their transcriptome that comprised viral RNA (% viral RNA), and the relative gain in % viral RNA from one cell to the next was plotted against the proportion of viral RNA in each cell. Local regression was performed separately for each infection, and the first local minimum of the resulting functions (indicated by dashed lines) indicated the point at which the marginal gain in % viral RNA was more consistent and less sensitive to the % viral RNA of the prior cell. Cells with % viral RNA values below this threshold were deemed falsely positive and considered uninfected for the analyses shown in Figure 5 and Extended Data Figure 6. Facets indicate individual infections, with lines colored by cell type (DF-1 = pink, MDCK = blue). B) The same analysis in panel A) was applied to the data from the second experiment, in which cells were co-inoculated with a 1:1 mixture of WT and mVAR1 viruses, as well as mVAR2 virus at an MOI of 0.1 PFU per cell in DF-1 cells, or 1.0 PFU per cell in MDCK cells. Only cells containing all eight mVAR2 segments were analyzed in this manner.
Extended Data Fig. 6
Extended Data Fig. 6. Validation of single-cell mRNA sequencing data.
(A, B, E) In the first single-cell sequencing experiment, DF-1 or MDCK cells were infected with GFHK99 WT virus at four different MOIs (0.07, 0.2, 0.6, 1.8 NP units per cell), and the transcriptomes of individual cells were sequenced using the 10x Genomics Chromium platform (n = 1,228 DF-1 cells, 645 MDCK cells, 1 sequencing replicate per infection condition). A) The total number of cells sequenced, infected, and containing PB2, PB1, PA, and NP segments are represented by the cumulative heights of the gray, light yellow, and dark yellow bars, respectively. Cells that were excluded by the analysis shown in Extended Data Figure 5 are contained within the gray bar. B) Each violin plot shows the full distribution of log10-transformed viral mRNA abundance, for all eight viral transcripts combined, in individual infected cells. Vertical lines represent the median of each distribution. The data are stratified by cell type (MDCK cells in blue, DF-1 cells in pink), MOI, and the presence of polymerase complex (light shading = cells missing PB2, PB1, PA, or NP; dark shading = cells in which PB2, PB1, PA and NP are all detected). The absence of a dark shaded distribution for MDCK cells at the lowest MOI is due to the absence of any cells in which all four of these segments were detected. (C, D, E) In the second single-cell sequencing experiment, DF-1 or MDCK cells were infected with GFHK99 WT and mVAR1 viruses at total MOIs of 0.07, 0.2, 0.6, 1.8 NP units per cell, and simultaneously with a constant dose of mVAR2 virus (n = 462 DF-1 cells, 671 MDCK cells, 1 sequencing replicate per infection condition). C) The total number of cells sequenced, containing all eight mVAR2 genome segments, and infected with either WT or mVAR1 virus are represented by the cumulative heights of the gray, light orange, and dark orange bars, respectively. As in panel (A), cells that were deemed falsely positive are contained within the gray bar. D) Distributions of viral UMIs per cell are shown separately for WT (bottom of each cell-MOI pair) and mVAR1 (top of each cell-MOI pair). Vertical lines represent the median of each distribution. As expected, no significant difference was detected between WT and mVAR1 transcript levels (p = 0.061, linear mixed effects model). E) The distributions of total UMIs detected per cell are shown for each cell type, MOI, and infection type, from both experiments. Vertical lines represent the median of each distribution.
Extended Data Fig. 7
Extended Data Fig. 7. Alignment of MaMN99 and GFHK99 virus PA and PA-X amino acid sequences.
Sequences and functional domains of the PA protein are displayed in panel (A), and those of the PA-X protein are shown in panel (B). N-ter = the N-terminal endonuclease domain; C-ter = C-terminal domain; X-ORF = the 61 amino acid region of PA-X encoded in frame 2 of the PA gene; Active site = the active site of the endonuclease; Dim. Loop = dimerization loop important for formation of polymerase dimers; Site 1 and Site 2 = sites mediating the interaction of PA with cellular Pol II C-terminal domain.
Extended Data Fig. 8
Extended Data Fig. 8. Quantification of defective interfering RNA content in virus stocks.
Defective interfering RNA content for A) PB2, B) PB1 and C) PA segments was determined by ddPCR using primer pairs targeting terminal and internal portions of each polymerase gene segment to determine their absolute copy number and produce a ratio of terminal:internal copies. All virus stocks used in this study contained low DI content (terminal:internal ratio less than or equal to 2). A DI-rich control virus, Pan99wt P3 (A/Panama/2007/99 [H3N2]), is included for comparison. This virus stock was passaged three times in MDCK cells at high MOI. For the MaMN99-GFHK99 chimeric viruses, the segments derived from GFHK99 virus are listed in place of the full strain names.
Extended Data Fig. 9
Extended Data Fig. 9. Example gating for flow cytometry to evaluate HA positive cell numbers.
Plots shown were generated in the course of experiments reported in Figure 1 and are representative of results obtained in at least three independent experiments. Following staining for cell-surface HA protein: 1) A population of cells was selected by gating out cell debris by SSC-A vs FSC-A. 2) Multiplets were excluded by gating for single cells in SSC-H vs SSC-W. 3) Populations of infected cells were gated based on expression of the appropriate epitope tag.
Extended Data Fig. 10
Extended Data Fig. 10. Titration of virus stocks for HA expressing units and NP expressing units by flow cytometry.
A) The doses to be used in RNA kinetics studies shown in Extended Data Figure 4 were determined via flow titration of HA-expressing units in the relevant cell lines. GFHK99 and MaMN99 virus mixtures were titrated in MDCK and DF-1 cells to calculate HA-èxpressing units/mL for each virus-cell combination. Serial dilutions of virus were used to infect cells under synchronized, single cycle conditions. Cells were harvested at 24 h post infection and stained for epitope tags. Data within the linear range were used to calculate the viral titer. B) GFHK99 viruses used in mRNA sequencing experiments shown in Figure 5 were titered in DF-1 cells. DF-1 cells are more permissive to infection and thus give more sensitive detection of infectious virus compared to MDCK cells. As the virus strains used did not contain epitope tags, virus detection was accomplished through cell permeabilization and detection of the viral NP protein. Data within the linear range were used to calculate viral titers. Representative flow plots show gates used following exclusion of cell debris and doublets.
Figure 1.
Figure 1.. Coinfection and reassortment frequencies indicate that IAV multiplicity dependence varies with virus strain and host species.
A–D) MDCK or DF-1 cells were coinfected with homologous WT and VAR viruses of either GFHK99, MaMN99, or NL09 strain backgrounds at MOIs ranging from 10 to 0.01 PFU/cell. The relationship between % cells HA+ and % cells dual-HA+ (A) varies with strain and cell type, resulting in curves of differing % linearity (B). GFHK99, MaMN99, and NL09 viruses exhibit different reassortment levels in MDCK cells, but all show high reassortment relative to a theoretical prediction in which singly infected and multiply infected cells have equivalent burst sizes (C). GFHK99 virus reassortment levels differ in MDCK and DF-1 cells, but again reassortment in DF-1 cells remains high relative to the theoretical prediction in which multiple infection confers no advantage (C). Clustering analysis of reassortment and HA co-expression regression models determines that GFHK99 virus exhibits unique behavior in MDCK cells compared to DF-1 cells or other viruses in MDCK cells (D). Yellow circles indicate nodes with >95% bootstrap support. Panels (E) and (F) show results of WT/VAR coinfections performed in vivo. Because multicycle replication in vivo allows the propagation of reassortants, analysis of genotypic diversity rather than percent reassortment is more informative for these experiments. Thus, the effective diversity was calculated for each dataset and plotted as a function of time post-inoculation. In guinea pigs (n=6), GFHK99 WT and VAR1 viruses exhibit higher reassortment than MaMN99 or NL09 WT and VAR viruses, as indicated by increased genotypic diversity (E). The GFHK99 WT and VAR1 viruses exhibit higher reassortment in guinea pigs than in quail (n=5) (F). Guinea pig data shown in panels E and F are the same. NL09 virus reassortment data shown in (C) were reported previously. Lines and shading represent prediction mean and 95% prediction interval (mean ± 1.96 * standard error) of robust linear regression.
Figure 2.
Figure 2.. Increasing MOI increases viral productivity at sub-saturating, but not saturating MOIs.
MDCK or DF-1 cells were infected under single-cycle conditions at a range of MOIs with the viruses indicated, and released virus was sampled over the course of 24 h. A) Fold change in amplification (maximum PFU output / PFU input) relative to the MOI=0.01 PFU per cell condition is plotted for each virus-cell pairing. B) Burst size, calculated as maximum PFU output / number of HA+ cells detected by flow cytometry, is plotted for each virus-cell pairing tested in the higher MOI range. MOIs shown are in units of PFU per cell, as determined in MDCK cells. Data are shown from n=3 replicate cell cultures per condition; bars show the mean.
Figure 3.
Figure 3.. Coinfection enhances GFHK99 vRNA synthesis in a dose and host dependent manner.
Cells were coinfected with WT virus and increasing doses of VAR virus. WT virus MOI was 0.05 PFU per cell in NHBE cells and 0.005 PFU per cell in all other cell types. The fold change in WT vRNA copy number, relative to that detected in the VAR virus, is plotted for NL09 virus in MDCK and NHBE cells (A), MaMN99 virus in MDCK and duck embryo (DE) cells (B), dkHK78 virus in MDCK, NHBE, and DF-1 cells (C), GFHK99 virus in MDCK, NHBE, and DF-1 cells (D) and QaHK88 virus in MDCK, NHBE, and DF-1 cells (E). Bars represent the mean of n=3 cell cultures per condition.
Figure 4.
Figure 4.. Coinfection and reassortment of chimeric viruses reveal a major role for the viral PA gene segment.
Reverse genetics was used to place one or more genes from GFHK99 virus into a MaMN99 background. Coinfections with homologous WT and VAR strains were performed in MDCK cells as in Figure 1. The relationship between % cells HA positive and % cells dually HA positive (A, B) and reassortment levels (C, D) are shown for each genotype. Experimental results are compared to a theoretical prediction based on Poisson statistics and in which singly infected and multiply infected cells have equivalent burst sizes (Prediction). Clustering analysis of the regression models shown in (A-D) is used to partition the behavior of each chimeric genotype into one of two clusters, denoting closer similarity to GFHK99 or MaMN99 (E). Yellow circles indicate nodes with >95% bootstrap support. Data shown for GFHK99 and MaMN99 viruses are the same as those displayed in Figure 1.
Figure 5.
Figure 5.. Homologous coinfecting virus boosts GFHK99 viral transcription in single cells and reveals comparable rates of segment detection in MDCK and DF-1 cells.
DF-1 or MDCK cells were infected with GFHK99 virus (left facet) at MOIs of 0.07, 0.2, 0.6, or 1.8 NP-expressing units per cell (n = 1,228 DF-1 cells, 645 MDCK cells), or a 1:1 mixture of GFHK99 WT and GFHK99 mVAR1 viruses at four different total MOIs (0.02, 0.07, 0.2, 0.6 NP-expressing units per cell, n = 462 DF-1 cells, 671 MDCK cells) and a constant amount of GFHK99 mVAR2 virus (0.1 PFU per cell in DF-1 cells, 1.0 PFU per cell in MDCK cells) (right facet). Per condition, two replicate wells were infected and cells from these replicates were pooled prior to analysis, giving n=1 sequencing replicate per infection condition. The number of cells analyzed per condition is shown in Extended Data Figure 6. Each violin plot shows the full distribution of total viral RNA (A) or distinct viral genome segments (B) per cell in each cell-MOI infection condition. Vertical lines denote the median of each distribution. UMI = unique molecular identifier.
Figure 6.
Figure 6.. Incomplete GFHK99 virus genomes are present but not sufficiently abundant to account for observed reassortment in MDCK cells.
Incomplete viral genomes were quantified experimentally by a single-cell assay which relies on the amplification of incomplete viral genomes of GFHK99 WT virus (0.018 PFU per cell) by a genetically similar coinfecting virus, GFHK99 VAR2. Based on the rate of detection of GFHK99 WT virus segments in this assay, the probability that a given segment would be present and replicated in a singly infected MDCK cell is reported as PP. A) Summary of experimental PP data. n = 4 biological replicates, distinguished by color. Horizontal bars and shading represent mean ± standard deviation. Mean PP,i values for each segment are indicated at the bottom of the plot area. Average PP for each experiment was calculated as the geometric mean of the eight PP,i values, and the mean ± standard deviation of those four summary PP values is shown at the top of the plot area. B) Experimentally obtained PP,i values in (A) were used to parameterize a computational model. Levels of reassortment predicted using the experimentally determined parameters are shown with colors corresponding to points in (A). Levels of reassortment predicted if PP=1.0 are shown with the dashed line. Observed reassortment of GFHK99 WT and VAR viruses in MDCK cells are shown with blue circles. Observed reassortment of GFHK99 WT and VAR viruses in DF-1 cells are shown with pink circles. Observed data are the same as those plotted in Figure 1. C) Model: complementation of incomplete viral genomes is necessary but not sufficient for robust progeny production from mammalian cells infected with GFHK99 virus. Cells infected with single virions often replicate incomplete viral genomes and therefore do not produce viral progeny (i). In mammalian cells, complementation of incomplete viral genomes through coinfection may allow progeny production (ii), but robust viral yields require the delivery of additional genomes to the cell, beyond the levels needed for complementation (iii). Horizontal bars within cells represent segments successfully delivered and replicated.

Comment in

  • Influenza virus hedges its bets.
    York A. York A. Nat Rev Microbiol. 2020 Sep;18(9):475. doi: 10.1038/s41579-020-0422-z. Nat Rev Microbiol. 2020. PMID: 32669680 No abstract available.

References

    1. Leeks A, Sanjuan R & West SA The evolution of collective infectious units in viruses. Virus Res 265, 94–101, doi: 10.1016/j.virusres.2019.03.013 (2019). - DOI - PMC - PubMed
    1. Brooke CB Population Diversity and Collective Interactions during Influenza Virus Infection. J Virol 91, doi: 10.1128/JVI.01164-17 (2017). - DOI - PMC - PubMed
    1. Sanjuan R Collective Infectious Units in Viruses. Trends Microbiol 25, 402–412, doi: 10.1016/j.tim.2017.02.003 (2017). - DOI - PMC - PubMed
    1. Brooke CB, Ince WL, Wei J, Bennink JR & Yewdell JW Influenza A virus nucleoprotein selectively decreases neuraminidase gene-segment packaging while enhancing viral fitness and transmissibility. Proc Natl Acad Sci U S A 111, 16854–16859, doi: 10.1073/pnas.1415396111 (2014). - DOI - PMC - PubMed
    1. Brooke CB et al. Most influenza a virions fail to express at least one essential viral protein. J Virol 87, 3155–3162, doi: 10.1128/JVI.02284-12 (2013). - DOI - PMC - PubMed

Publication types

MeSH terms