. 2020 Sep;23(9):1055-1066.
doi: 10.1038/s41593-020-0654-2. Epub 2020 Jul 6.

Microglia phagocytose myelin sheaths to modify developmental myelination

Affiliations

Microglia phagocytose myelin sheaths to modify developmental myelination

Alexandria N Hughes et al. Nat Neurosci. 2020 Sep.

Abstract

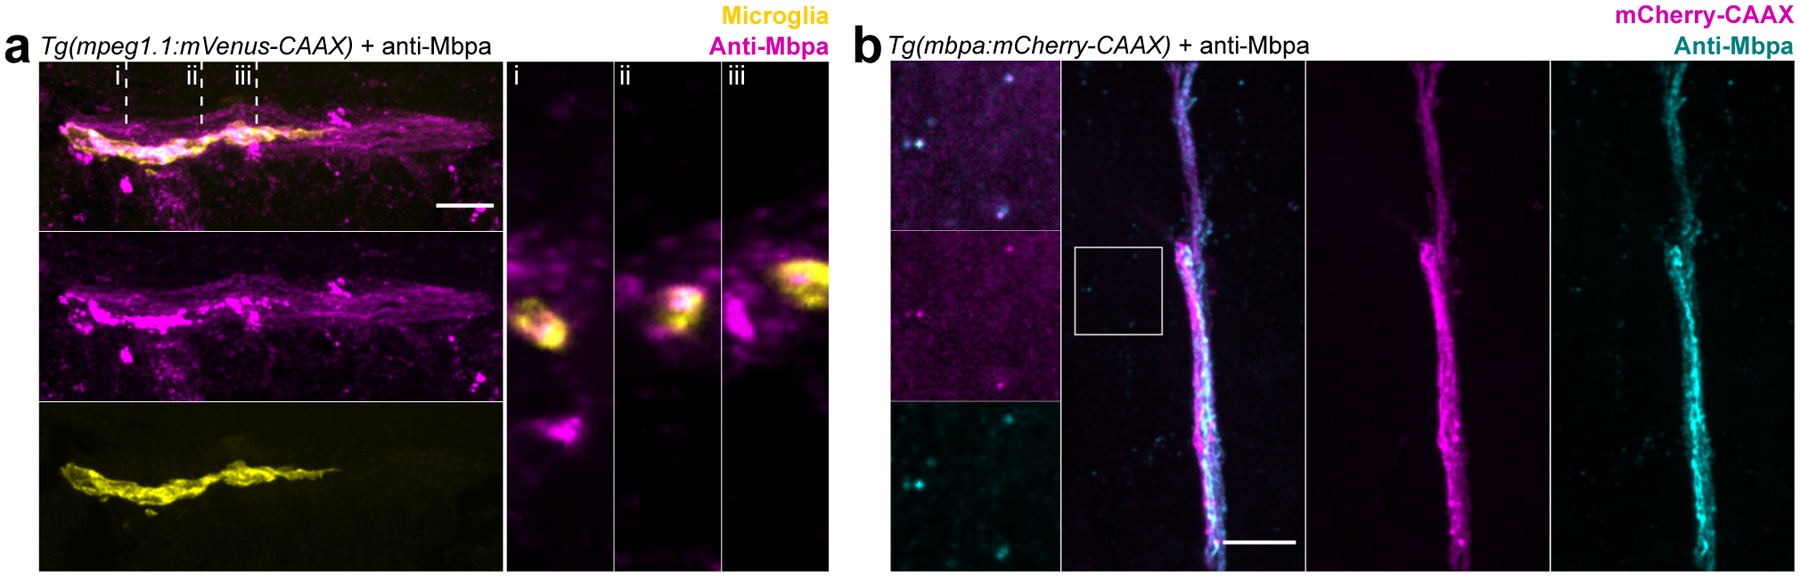
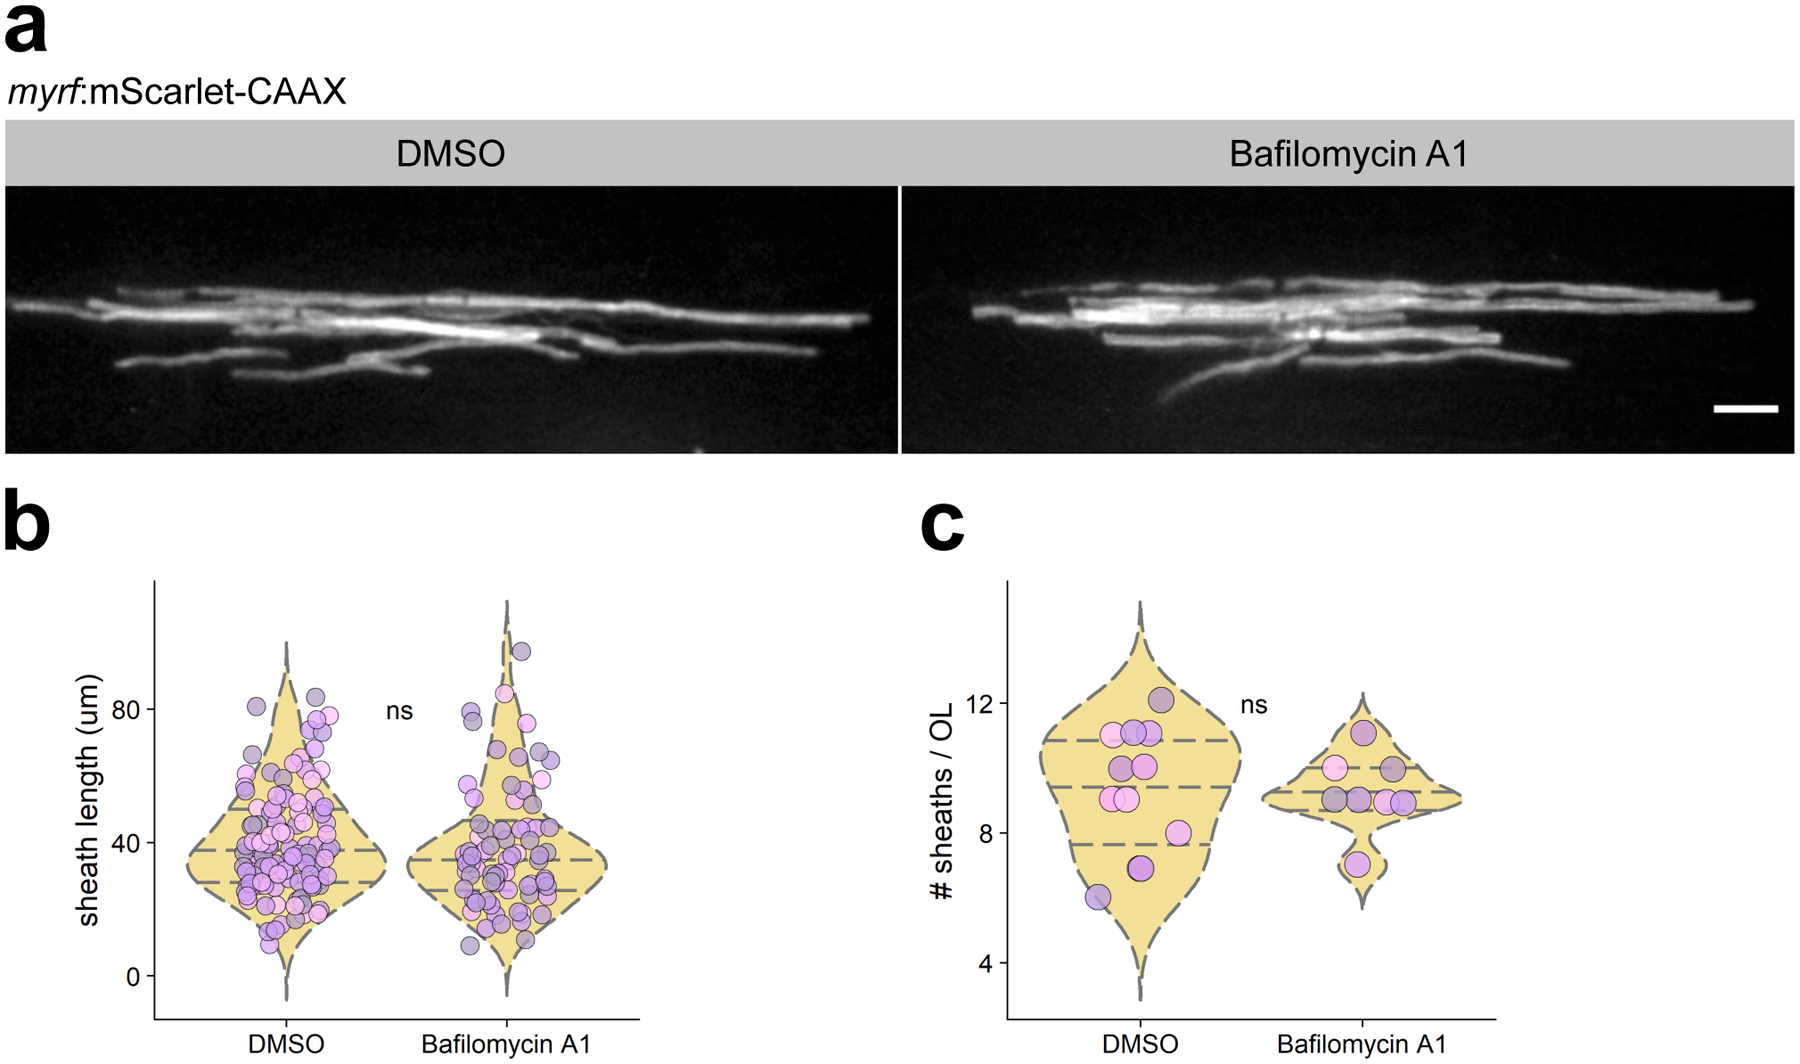
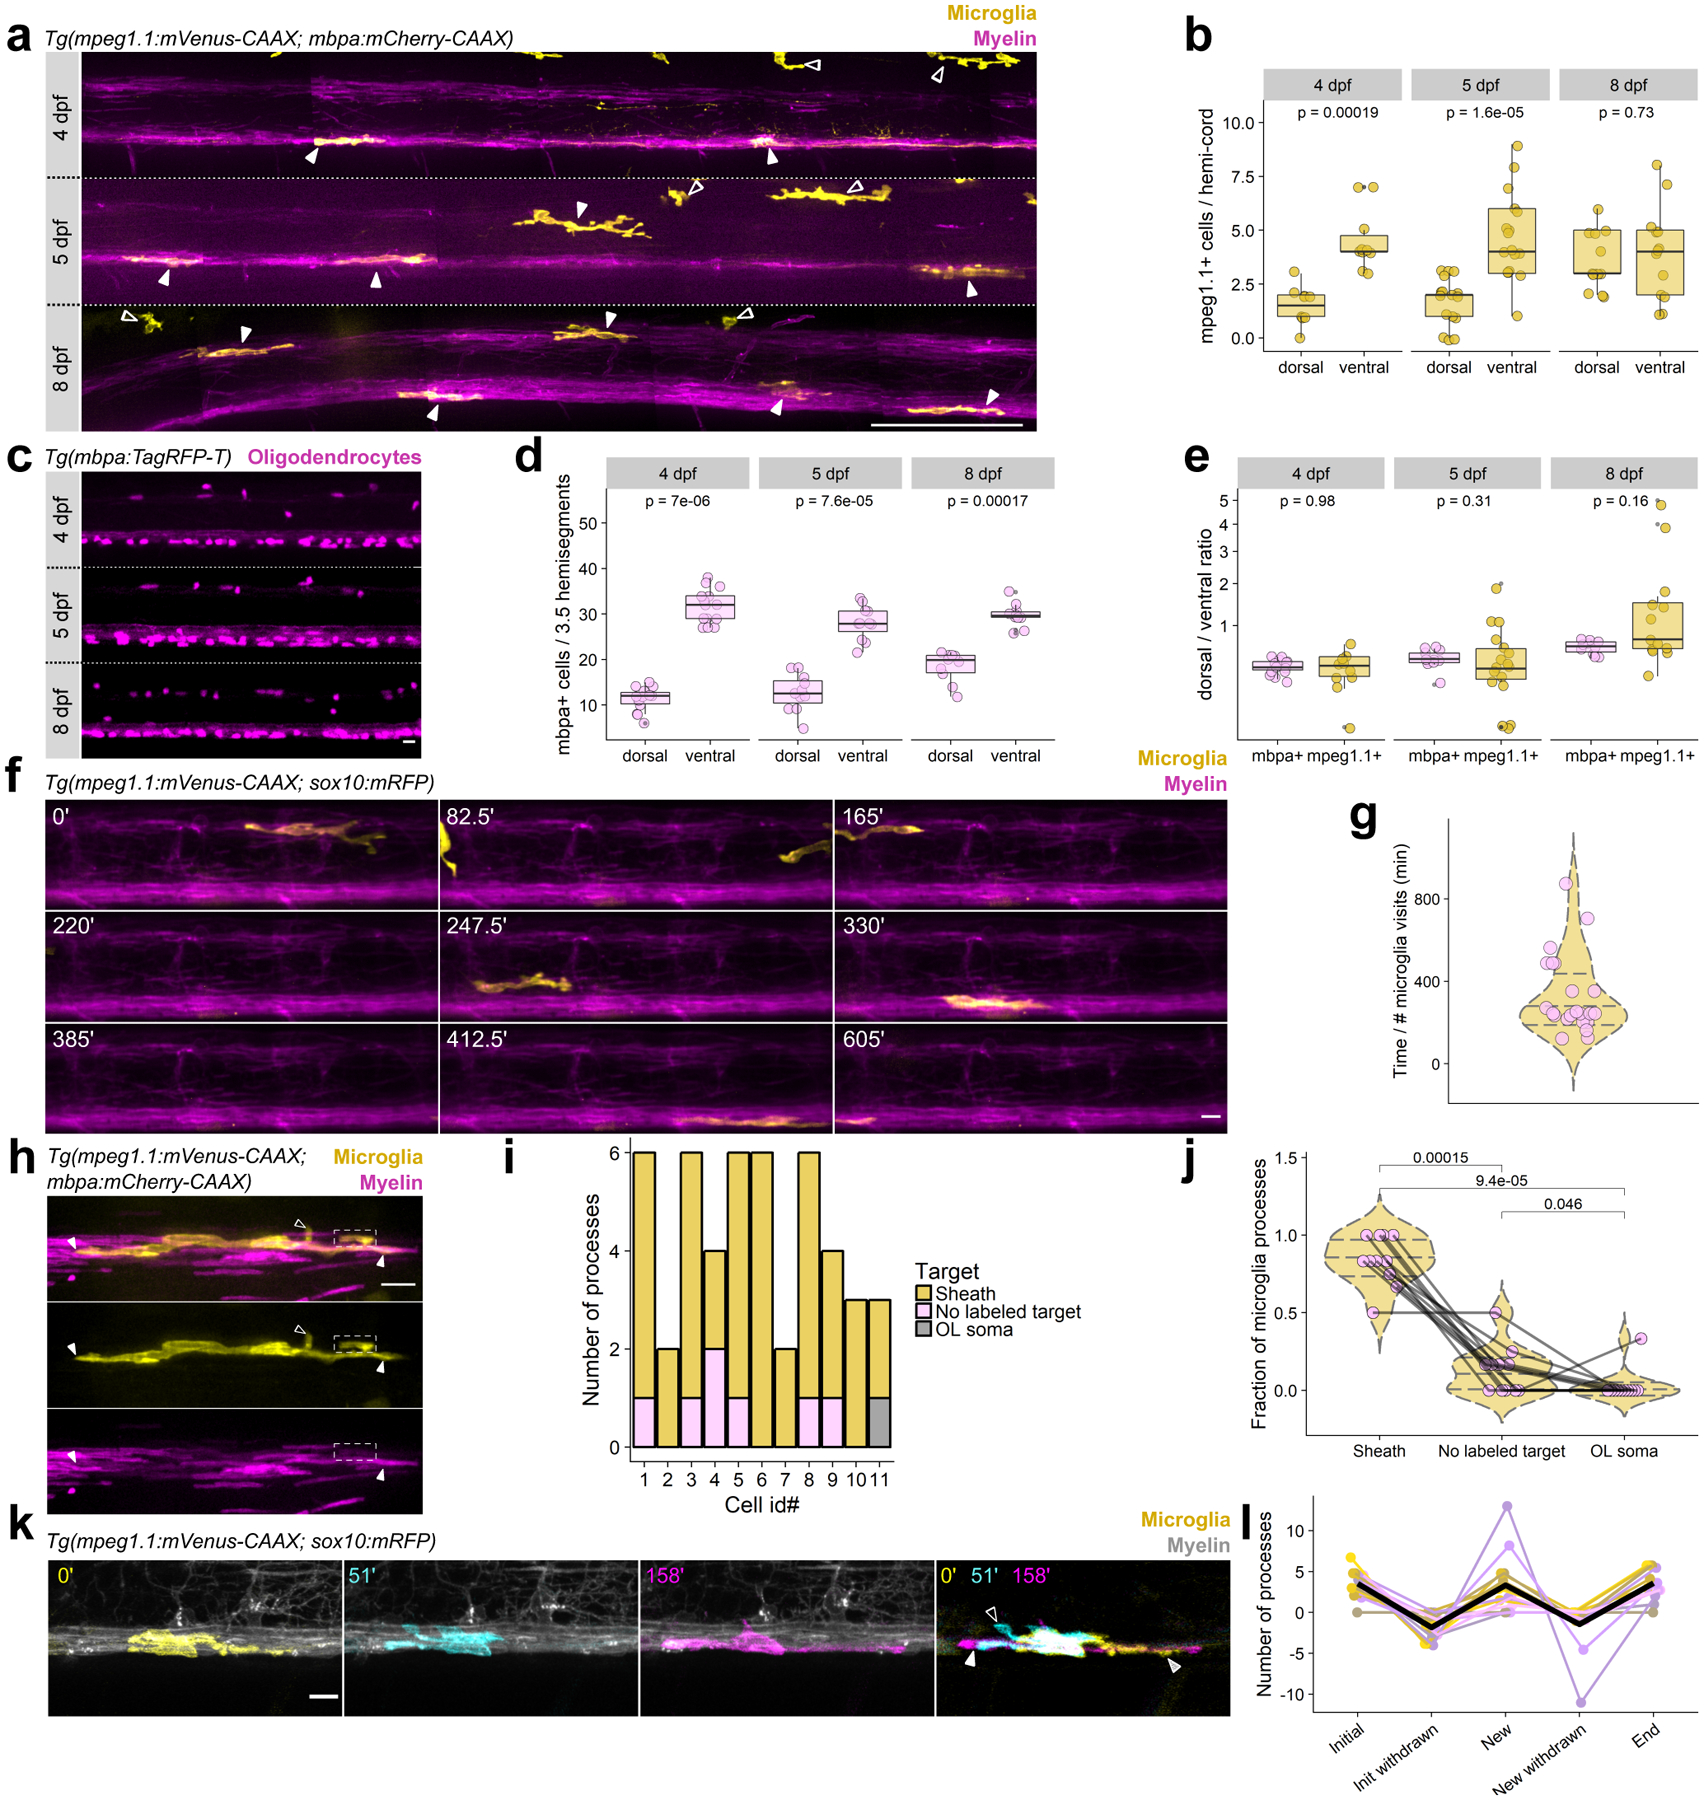
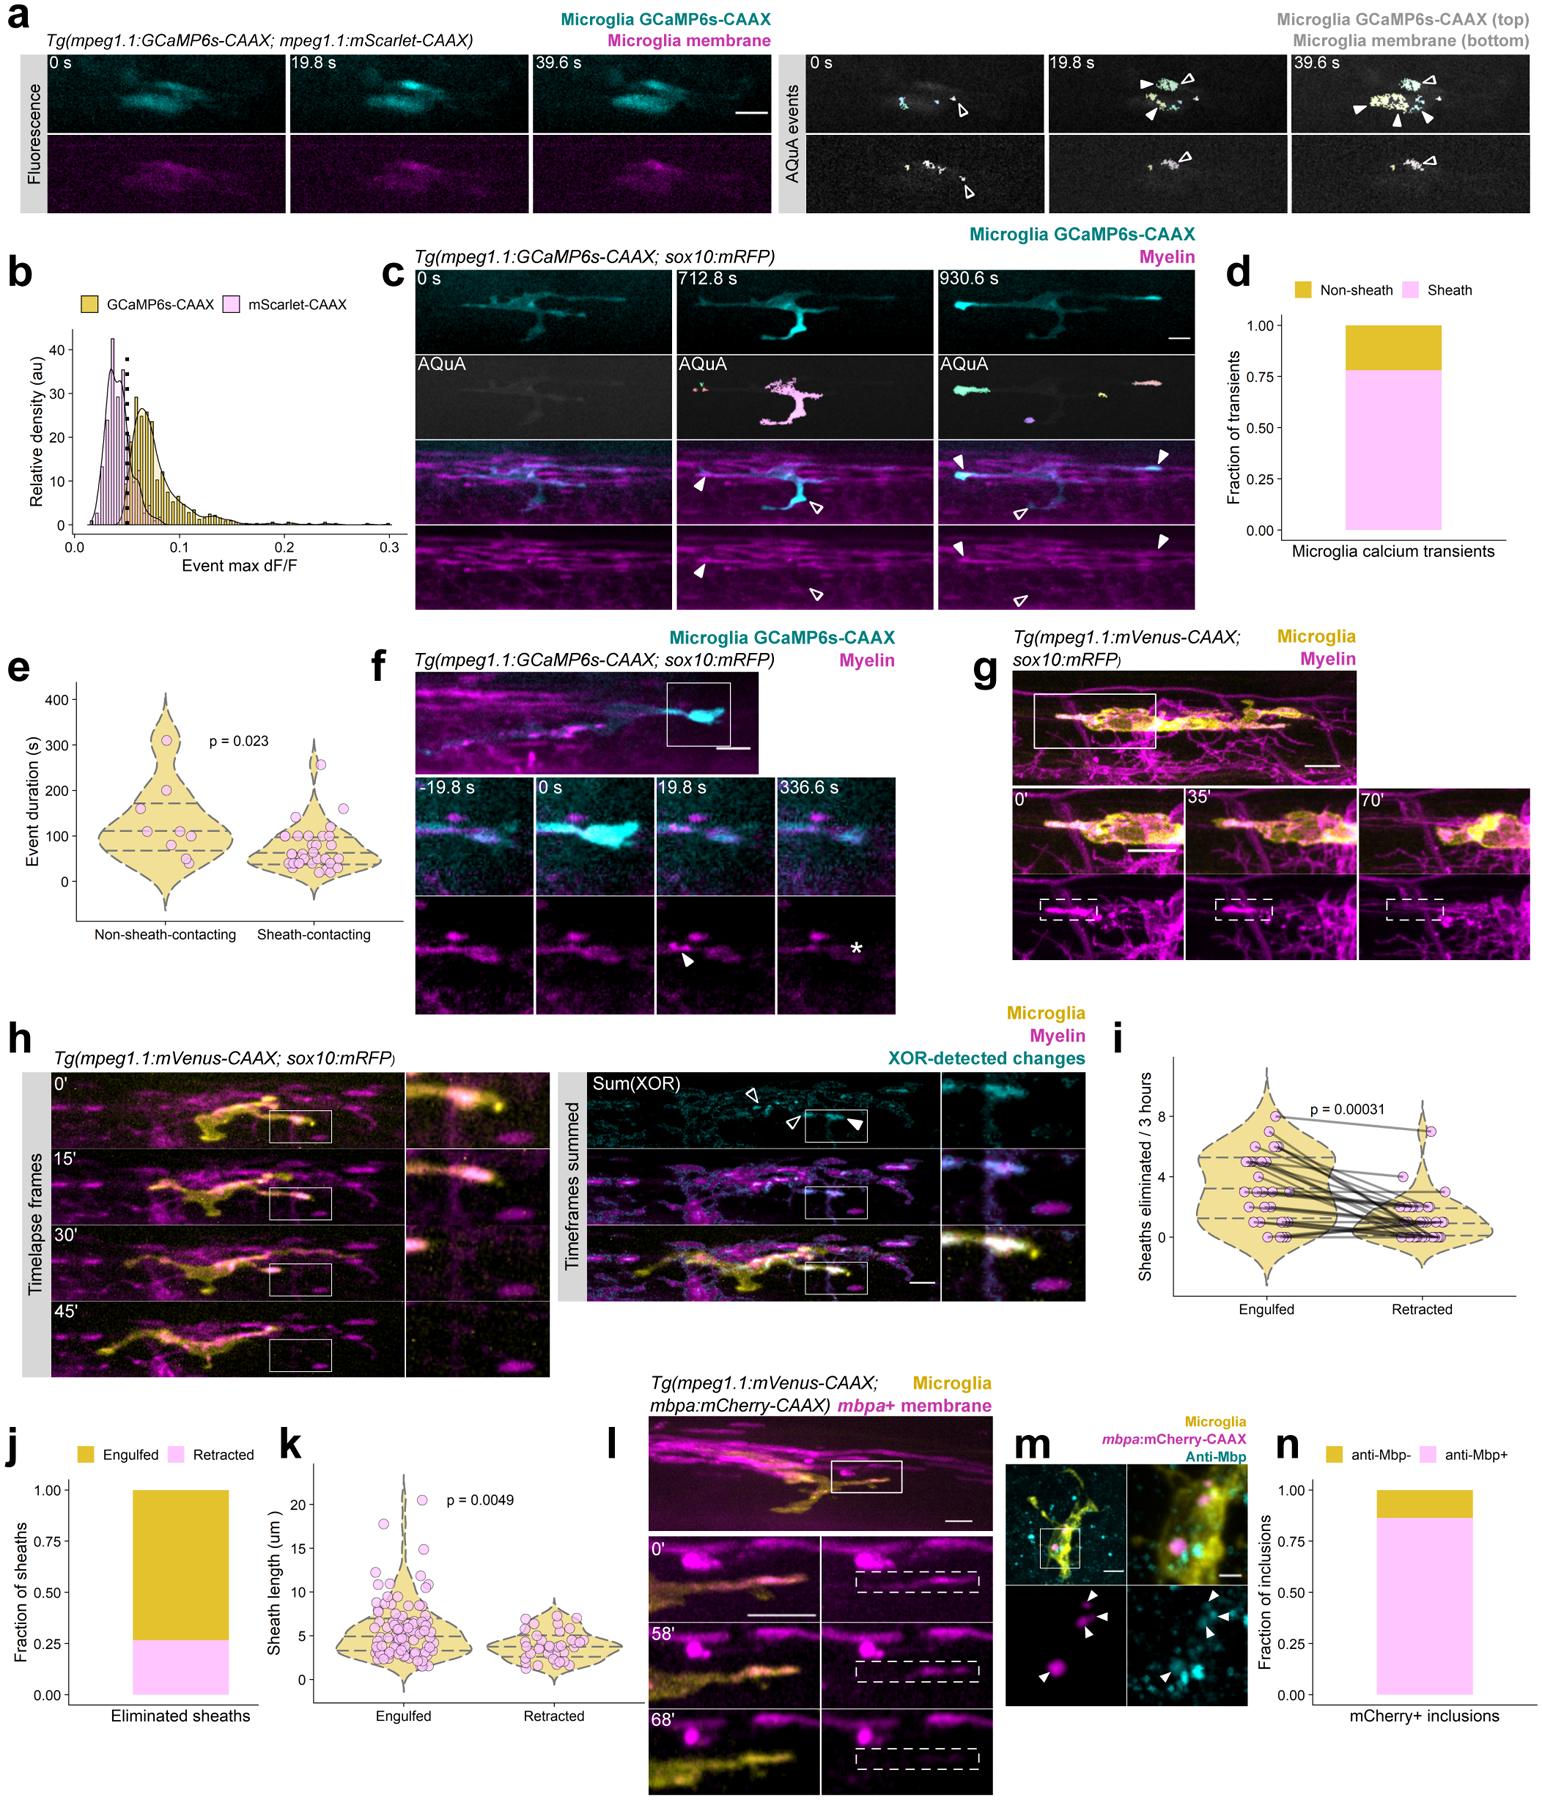
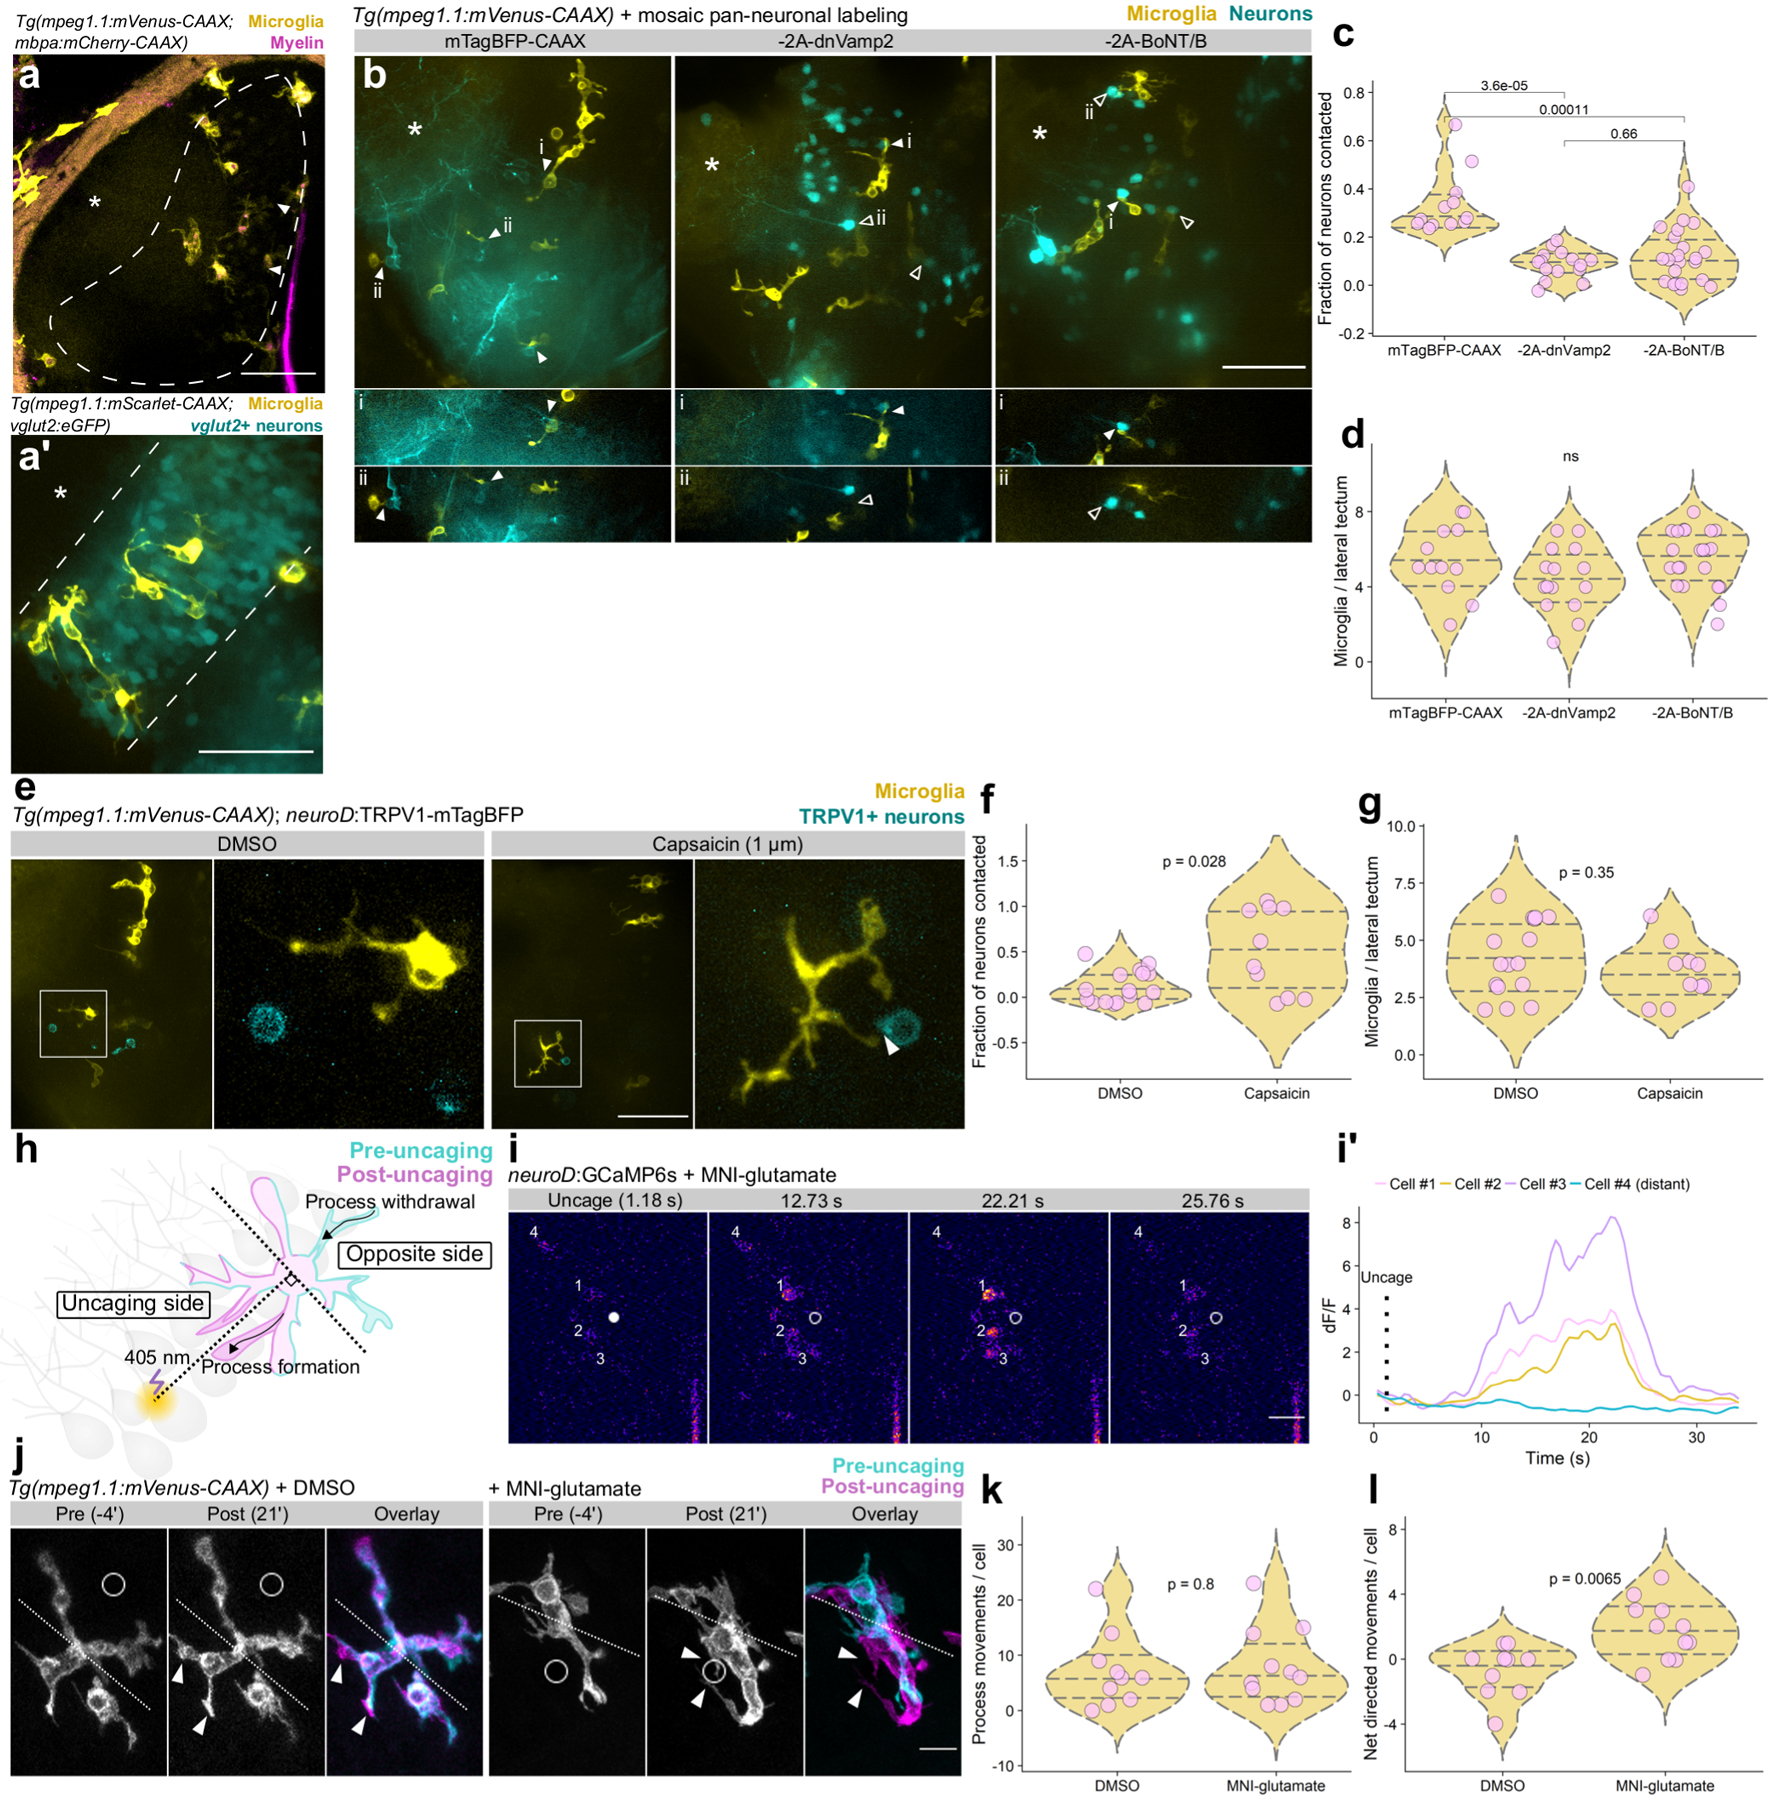
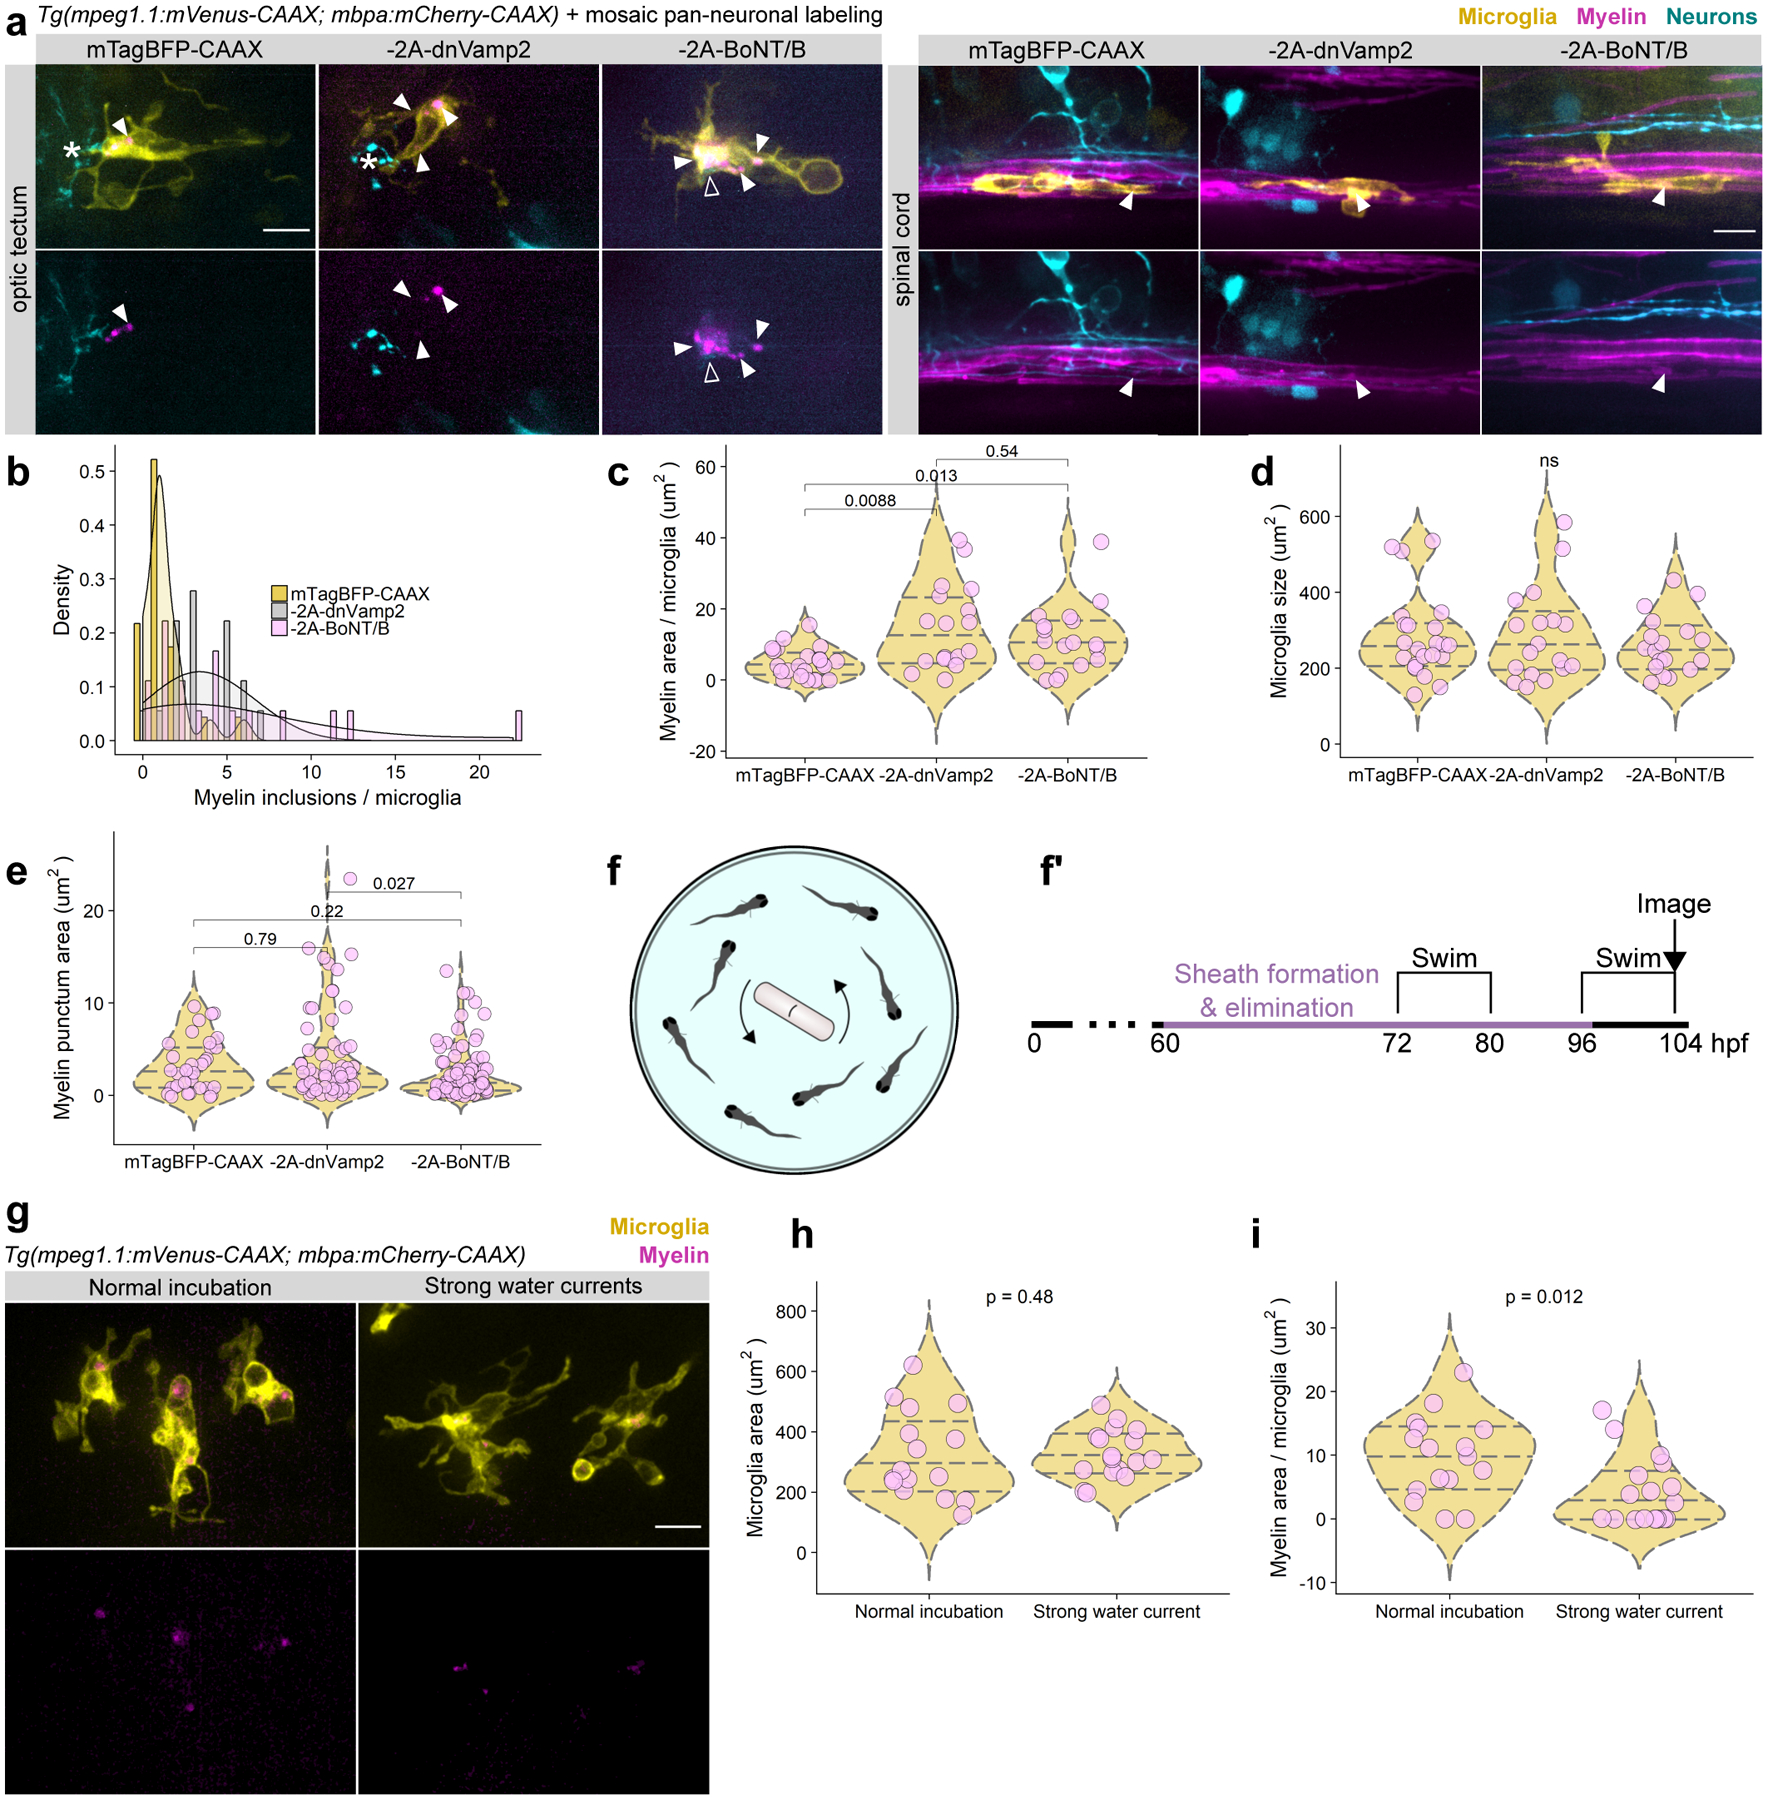
During development, oligodendrocytes contact and wrap neuronal axons with myelin. Similarly to neurons and synapses, excess myelin sheaths are produced and selectively eliminated, but how elimination occurs is unknown. Microglia, the resident immune cells of the central nervous system, engulf surplus neurons and synapses. To determine whether microglia also prune myelin sheaths, we used zebrafish to visualize and manipulate interactions between microglia, oligodendrocytes, and neurons during development. We found that microglia closely associate with oligodendrocytes and specifically phagocytose myelin sheaths. By using a combination of optical, genetic, chemogenetic, and behavioral approaches, we reveal that neuronal activity bidirectionally balances microglial association with neuronal cell bodies and myelin phagocytosis in the optic tectum. Furthermore, multiple strategies to deplete microglia resulted in oligodendrocytes maintaining excessive and ectopic myelin. Our work reveals a neuronal activity-regulated role for microglia in modifying developmental myelin targeting by oligodendrocytes.


Conflict of interest statement

Competing interests: The authors declare no competing interests.

Figures

Extended Figure 1.
Extended Figure 1.. Calcium events in microglia contacting myelin sheaths compared to non-sheath contacting processes and comparison with proximal vs distal events.
(a, b) Max dF/F (a) and event area (b) for large events (dF/F >0.1, area > 3 μm2) at non-sheath-contacting and sheath-contacting processes of microglia at 4 dpf in Tg(mpeg1.1:GCaMP6s-CAAX; sox10:mRFP) larvae. Wilcox rank-sum test, n=41 events from 9 microglia in 9 fish. (c, d) To distinguish if distance from cell soma is responsible for sheath-contacting vs non-contacting event differences, we split 645 events that occurred in 31 cells (31 fish) into distal and proximal halves and assessed event dF/F (c) and duration (d); both ns by Wilcox rank-sum test.
Extended Figure 2.
Extended Figure 2.. Anti-Mbpa detects myelin within microglia.
(a) Coronal section of Tg(mpeg1.1:mVenus-CAAX) 6 dpf larval spinal cord stained with anti-Mbpa to detect myelin. Note anti-Mbpa inclusions (magenta) within microglia (yellow) in orthogonal views (right panels) taken at the locations marked (i), (ii), (iii). (b) Coronal section of Tg(mbpa:mCherry-CAAX) 6 dpf tectal commissure stained with anti-Mbpa (cyan) to detect myelin. Oligodendrocyte membrane (mCherry-CAAX) colocalizes with anti-Mbpa (cyan), both in the intact commissure and as a limited amount of extracellular debris (inset). Scale bars, 10 μm.
Extended Figure 3.
Extended Figure 3.. Acute treatment of larvae with bafilomycin A1 does not affect oligodendrocyte myelination.
(a) Individual oligodendrocytes in transient-transgenic myrf:mScarlet-CAAX expressing larvae treated with bafilomycin A1 or DMSO. Scale bar, 10 μm. (b, c) Quantification of sheath length and number of oligodendrocytes in each treatment group. n=12 larvae/12 fish (DMSO), 8 larvae/8 fish (bafilomycin A1). Data in (b) and (c) analyzed by Wilcox rank-sum test.
Extended Figure 4.
Extended Figure 4.. Glutamate uncaging evokes Ca2+ transients most reliably in neurons located < 20 μm away from the uncaging site.
(a) Ratio of Ca2+ transient-experiencing neurons to those without transients binned in 10 μm bins from the uncaging site. (b) Distance of neurons with Ca2+ transients (defined as dF/F>0.5) or no transients from the uncaging point in larvae treated with DMSO or MNI-glutamate, analyzed by Wilcox rank-sum test (n=fish/neurons, n=5/85 DMSO, 9/70 MNI-glutamate).
Extended Figure 5.
Extended Figure 5.. Microglia ablation does not change oligodendrocyte number or distribution.
(a) Max projection images of hemi-spinal cords in 4 dpf Tg(mbpa:TagRFP-T) larvae in each microglia ablation group and controls. Scale bar, 10 μm. (b, c) Total number (b) and dorsal/ventral distribution (c) of oligodendrocytes per 3.5 hemisegments in each ablation group paired with corresponding controls, analyzed by Wilcox rank sum test (n=fish/oligodendrocytes, groups left to right, n=9/293, 12/442, 7/222, 8/271, 7/225, 6/209, 8/274, 6/208).
Extended Figure 6.
Extended Figure 6.. Working model of activity-regulated myelin phagocytosis by microglia.
Microglia phagocytose myelin to regulate myelin sheath number and targeting. Neuronal activity attracts microglia to contact neuronal cell bodies and reduces the amount of myelin that microglia can phagocytose, whereas reductions in neuronal activity promote myelin phagocytosis from axons.
Figure 1.
Figure 1.. Microglia dynamically engage with myelin sheaths in the spinal cord.
(a) Lateral tile scans of spinal cords of Tg(mpeg1.1:mVenus-CAAX; mbpa:mCherry-CAAX) larvae at 4, 5, and 8 dpf. Closed arrowheads mark microglia and open arrowheads mark peripheral macrophages. Scale bar, 50 μm. (b) Microglia counts in dorsal and ventral tracts (hemi-cord) in 4, 5, and 8 dpf larvae. Wilcox rank-sum test, n=fish/cells, n=10/60 4 dpf, 17/109 5 dpf, 13/97 8 dpf. (c) Oligodendrocytes in 3.5 hemisegments in the spinal cord of Tg(mbpa:TagRFP-T) larvae at 4, 5, and 8 dpf. Scale bar, 10 μm. (d) Oligodendrocyte counts in dorsal and ventral tracts (3.5 hemisegments) in 4, 5, and 8 dpf larvae. Wilcox rank-sum test, n=fish/cells, n=14/602 4 dpf, 11/448 5 dpf, 10/482 8 dpf. (e) Ratios of dorsal/ventral cell counts for mbpa+ oligodendrocytes and mpeg1.1+ microglia at 4, 5, and 8 dpf, for cells counted in (b) and (d). Data in (b), (d), and (e) analyzed by Wilcox rank-sum test. (f) Timelapse imaging frames over 10 h in Tg(mpeg1.1:mVenus-CAAX; sox10:mRFP) larvae at 4 dpf. (g) Time between microglia visits. Each point represents the timelapse acquisition time divided by the number of microglia visits to the imaging field of view; each point is one larva (n=22 larvae). Violin plot lines mark quantiles (25, 50, 75 percentile) and colors are meaningless. (h) A microglia (yellow) in the dorsal spinal cord of a Tg(mpeg1.1:mVenus-CAAX; mbpa:mCherry-CAAX) larva. Closed arrowheads mark close associations of microglial processes with myelin sheaths (magenta rectangles); open arrowheads mark processes extending toward unlabeled targets; dashed box shows a process enveloping a sheath. (i) Distribution of microglial processes per cell associated with myelin sheaths, oligodendrocyte somas, or unlabeled targets for n=11 cells (11 fish). (j) Fraction of microglial processes in (i) plotted per target type, Wilcox rank-sum test with Bonferroni-Holm correction for multiple comparisons. Each point represents one microglia. (k) Timelapse imaging frames of a microglia in a Tg(mpeg1.1:mVenus-CAAX; sox10:mRFP) larva, pseudocolored to show cell morphology at three different time points and merged. Striped arrowhead marks a process present at 0’ that is absent at 51’ (initial, withdrawn); open arrowhead marks a process generated during the imaging period that later disappears (new, withdrawn); closed arrowhead marks a process that is generated during the imaging period and is maintained at the end of the imaging window (new). (l) Number of processes generated and withdrawn by microglia during 1 hour of timelapse imaging; black trace is the mean (n=14 microglia in 14 fish). Scale bars, 10 μm.
Figure 2.
Figure 2.. Microglia phagocytose myelin sheaths during developmental myelination.
(a) Timelapse imaging (left) and AQuA transient detection in a microglia carrying dual reporters for membrane fluorescence (mScarlet-CAAX) and membrane calcium (GCaMP6s-CAAX). Open arrowheads label membrane events present in both channels; closed arrowheads mark calcium transients. (b) Histogram of membrane and calcium event dF/F values (649 calcium events in 31 cells, 228 membrane events in 9 cells) shows that events are separable by dF/F; therefore, only events >0.05 dF/F were considered calcium transients. (c) Timelapse imaging of filtered calcium transients (dF/F > 0.05) in a microglia interacting with myelin. Closed arrowheads mark events occurring at points of contact with sheaths; open arrowheads mark events at non-sheath-contacting processes. (d, e) Fraction of large calcium events (d) and event duration (e) associated with sheath-contacting and non-contacting processes. Wilcox rank-sum test; n=32/9 filtered events from 9 cells/9 fish. (f) Timelapse imaging of a microglia calcium transient and phagocytosis of contacted material (arrowheads mark blebbing; asterisk marks loss of signal). (g) Timelapse imaging of a microglia engulfing a nascent myelin sheath. (h) Analysis scheme for detecting myelin sheaths eliminated by phagocytosis or retraction. Timelapse frames (left) are processed by consecutive exclusive-or (XOR) calculation to generate an image of lost sheaths (cyan); those engulfed by microglia are engulfed (closed arrowheads) whereas those lost but not contacted are retracted. (i) Paired comparison of number of sheaths lost by engulfment and retraction in 3 h in 30 microglia from 30 animals. Each pair-connected line is one animal; Wilcox-rank sum test. (j) Relative fractions of sheaths across all timelapse acquisitions that were engulfed or retracted. (k) Lengths of sheaths eliminated by engulfment vs retraction; Wilcox rank-sum test (n=135 sheaths from 30 cells/30 fish). (l) Representative example of myelin sheaths in mbpa+ oligodendrocytes eliminated by microglia. (m, n) Immunohistochemistry and quantification of anti-Mbp (cyan) inclusions within microglia in animals carrying Tg(mbpa:mCherry-CAAX) to label oligodendrocyte membrane. n=44 mCherry-CAAX+ inclusions in 11 cells in 7 fish. All scale bars, 10 um.
Figure 3.
Figure 3.. Microglia phagocytose myelin sheaths with minimal phagocytosis of oligodendrocyte somas.
(a) Strategy for delaying the breakdown of phagocytosed myelin with bafilomycin A1. (b) Microglia in Tg(mpeg1.1:mVenus-CAAX; mbpa:mCherry-CAAX) larvae treated with DMSO or bafilomycin (1 μm) for 1 hour prior to imaging. Arrowheads mark round myelin inclusions inside microglia. (c) Example sum-projected image of a microglia containing mRFP inclusions (top) with morphological segmentation performed using MorphoLibJ to identify inclusions (bottom). (d) Histogram depicting the number of myelin inclusions per microglia in DMSO and bafilomycin-treated larva. (e-g) Morphological segmentation on sum-projected images of microglia in 4 dpf Tg(mpeg1.1:mVenus-CAAX; mbpa:mCherry-CAAX) larvae that were treated with either DMSO or bafilomycin prior to imaging. Each point represents one inclusion (e) or microglia (f, g); points shaded so overlapping points are visible (DMSO, n=22 cells from 22 larvae containing 48 inclusions; bafilomycin, n=22 cells/22 larvae/175 inclusions). (e) Area (μm2) of myelin inclusions inside microglia, Wilcox rank-sum test. (f) Total myelin inclusion area (μm2) per microglia, Wilcox rank-sum test. (g) Number of myelin inclusions per microglia in bafilomycin-treated larvae over the course of developmental myelination (4–8 dpf). Kruskal-Wallis test, n=fish/cells/inclusions, n=10/10/74 4 dpf, 9/9/79 5 dpf, 12/12/101 8 dpf. (h) Max-projection images of spinal cord oligodendrocytes (magenta) in larvae treated with either DMSO or bafilomycin A1 and live-stained with acridine orange (green). (i-k) Quantification of mbpa+ cells (i), acridine orange cells (j), and mbpa+ cells stained by acridine orange (k) in 3.5 hemisegments and analyzed by Wilcox rank-sum test for n=fish/cells, n=14/602 DMSO, 16/742 bafilomycin. (l) Schematic of transgenic oligodendrocyte reporters that label either oligodendrocyte membrane (mCherry-CAAX) or cytosol (TagRFP). (m) Examples of microglia in either Tg(mpeg1.1:mVenus-CAAX; mbpa:mCherry-CAAX) or Tg(mpeg1.1:mVenus-CAAX; mbpa:TagRFP-T) 4 dpf larvae, treated with either DMSO or bafilomycin A1 prior to imaging. Arrowheads mark myelin inclusions. (n) Number of mCherry-CAAX and TagRFP inclusions per microglia in each of the four groups presented in (m), Wilcox rank-sum test (n=fish/cells/inclusions, n=12/12/18 mCherry-CAAX DMSO, 10/10/74 mCherry-CAAX bafilomycin, 6/6/0 TagRFP DMSO, 8/8/1 TagRFP bafilomycin). Scale bars, 10 μm.
Figure 4.
Figure 4.. Neuronal activity regulates microglia-neuron interactions.
(a) Coronal view of microglia and myelin in one hemisphere of optic tectum in a live Tg(mpeg1.1:mVenus-CAAX; mbpa:mCherry-CAAX) 5 dpf larva. Dashed line marks the cell body layer, asterisks marks the neuropil layer, and arrowheads indicate the tectal commissure. (a’) Lateral view of microglia in the cell body layer. Microglia labeled by Tg(mpeg1.1:mScarlet-CAAX) and cell body layer glutamatergic neurons labeled by Tg(vglut2:eGFP). (a) and (a’) are representative images from 10 larvae. Scale bars, 50 μm. (b) Top panels, max projection images of optic tectum (lateral view) in Tg(mpeg1.1:mVenus-CAAX) larvae mosaically expressing neuroD:mTagBFP-CAAX or neuroD:mTagBFP-CAAX-2A-dnVamp2/BoNT/B (−2A-dnVamp2, −2A-BoNT/B). Panels below show single optical sections containing microglial-neuron contacts (closed arrowheads) or absence of contact (open arrowheads). Asterisks mark neuropil. Scale bar, 50 μm. (c) Fraction of neuron somas contacted per tectal field of view in each of the groups in (b), analyzed by Wilcox rank-sum test with Bonferroni-Holm correction for multiple comparisons. (d) Number of microglia per tectal field of view for each group in (b), analyzed by Kruskal-Wallis test. For (b-d), n=fish/neurons/microglia, n=12/166/65 mTagBFP-CAAX, 15/487/66 −2A-dnVamp2, 22/398/121 −2A-BoNT/B. (e) Max-projection images of microglia (yellow) and neurons sparsely expressing TRPV1-mTagBFP (cyan) in optic tectum of larvae treated with DMSO vehicle or 1 μm capsaicin. Closed arrowhead marks a microglia-neuron contact. Scale bar, 50 μm. (f, g) Quantification of the fraction of TRPV1-mTagBFP+ neurons contacted by microglia (f) and the number of microglia per lateral tectum field of view (g). Each dot represents one larval tectum, analyzed by Wilcox rank-sum test (n=fish/neurons, n=16/62 DMSO, 10/19 capsaicin). (h) Schematic of glutamate uncaging and analysis of microglial motility. (i, i’) Example frames of glutamate uncaging near neurons sparsely-labeled with GCaMP6s. Closed dot marks the point of uncaging, open dot shows the position after uncaging, and cell numbers match transient traces in (i’). Representative example from one of 9 larvae (Extended Fig. 4). Scale bar, 20 μm. (j) Timelapse imaging frames of microglia in larvae treated with DMSO vehicle or MNI-glutamate, before and after focal 405 nm uncaging at the open circle. Dotted line divides microglia into uncaging and opposite sides (described in (h)) and arrowheads indicate newly formed processes. Scale bar, 10 μm. (k, l) Total process extensions and retractions per cell in each group (k) and net movements toward the uncaging point (l). Wilcox rank-sum test, n=fish/microglia, n=10/10 DMSO, 11/11 MNI-glutamate.
Figure 5.
Figure 5.. Neuronal activity regulates myelin phagocytosis by microglia.
(a) Microglia in the optic tectum and spinal cord in larvae carrying Tg(mpeg1.1:mVenus-CAAX; mbpa:mCherry-CAAX) to label microglia and myelin and mosaically expressing either neuroD:mTagBFP-CAAX or neuroD:mTagBFP-CAAX-2A-dnVamp2/BoNT/B (−2A-dnVamp2, −2A-BoNT/B). Closed arrowheads mark myelin inclusions inside microglia (magenta); open arrowheads mark neuronal inclusions (cyan); asterisks mark microglial processes contacting neurons. Scale bars, 10 μm. (b-e) MorphoLibJ morphological segmentation on sum-projected images of optic tectum microglia in 4 dpf in each group in (a). Each point represents one microglia (c, d) or inclusion (e) (n=fish/microglia/inclusions, n=18/23/30 mTagBFP-CAAX, 18/18/63 −2A-dnVamp2, 18/18/87 −2A-BoNT/B). (b) Histogram depicting the number of myelin inclusions inside microglia. (c) Total myelin inclusion area per microglia, Wilcox rank-sum test with Bonferroni-Holm correction for multiple comparisons. (d) Microglia area, Kruskal-Wallis test. (e) Area of individual myelin inclusions inside microglia, Wilcox rank-sum test. (f, f’) Schematic and timeline of strong water current-induced forced swimming to increase neuronal activity in optic tectum. (g) Representative examples of microglia containing myelin inclusions in normal incubation and forced swim paradigms. Scale bar, 10 μm. (h, i) Microglia area (h) and myelin inclusion area (i) per cell in each group, Wilcox rank-sum test (n=fish/microglia, n=12/16 normal, 13/17 strong currents).
Figure 6.
Figure 6.. Microglial ablation during myelination increases myelin sheath number.
(a) Schematic of microglial development and three approaches to ablate microglia. (b) Timeline for labeling individual oligodendrocytes by microinjection at the 1-cell stage and ablating microglia either by coinjection with Irf8 translation blocking morpholino, treatment with Csf1r inhibitor GW2580, or nitroreductase (NTR) treatment with metronidazole (Mtz). (c) Brightfield images of live neutral red-stained larvae in each of three ablation groups. Arrowheads mark examples of neutral red-labeled microglia in optic tectum (small red dots). Scale bar, 100 μm. (d) Quantification of neutral red-labeled microglia in the optic tectum of larvae in each group. Each dot represents the microglia count in one larva. Wilcox rank-sum test, left to right, n=fish/microglia, n=10/319, 15/35, 12/357, 11/206, 10/296, 10/279, 10/288, 16/120. (e) Example spinal cord oligodendrocytes labeled by myrf:mScarlet-CAAX in each group. Asterisks mark oligodendrocyte somas and arrowheads indicate myelinated cell bodies. Scale bar, 10 μm. (f, g, h) Quantification of sheath number (f), length (g), and ectopic soma wraps (h, example in (e)) in each group. Each point represents one oligodendrocyte (f), sheath (g), or soma wrap (h). Wilcox rank-sum test, left to right, n=cells/fish/sheaths, n=15/15/163, 27/27/503, 15/15/156, 16/16/229, 12/12/121, 11/11/124, 15/15/139, 15/15/223). Scale bars, 10 μm.

Similar articles

Cited by

References

    1. Hines JH, Ravanelli AM, Schwindt R, Scott EK & Appel B Neuronal activity biases axon selection for myelination in vivo. Nat. Neurosci 18, 683–689 (2015). - PMC - PubMed
    1. Mensch S et al. Synaptic vesicle release regulates myelin sheath number of individual oligodendrocytes in vivo. Nat. Neurosci 18, 628–30 (2015). - PMC - PubMed
    1. Gibson EM et al. Neuronal activity promotes oligodendrogenesis and adaptive myelination in the mammalian brain. Science (80-.) 344, (2014). - PMC - PubMed
    1. Mitew S et al. Pharmacogenetic stimulation of neuronal activity increases myelination in an axon-specific manner. Nat. Commun 9, (2018). - PMC - PubMed
    1. Scholz J, Klein MC, Behrens TEJ & Johansen-Berg H Training induces changes in white-matter architecture. Nat. Neurosci 12, 1370–1371 (2009). - PMC - PubMed

Publication types