. 2020 Aug;21(8):927-937.
doi: 10.1038/s41590-020-0714-5. Epub 2020 Jul 6.

Dynamics in protein translation sustaining T cell preparedness

Affiliations

Dynamics in protein translation sustaining T cell preparedness

Tobias Wolf et al. Nat Immunol. 2020 Aug.

Abstract

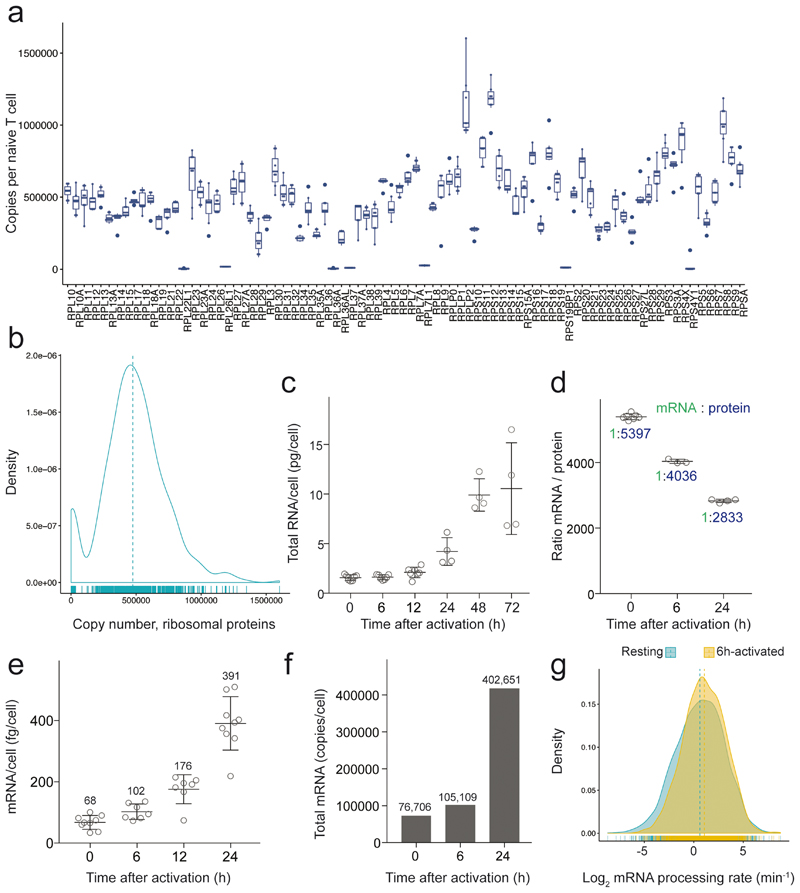
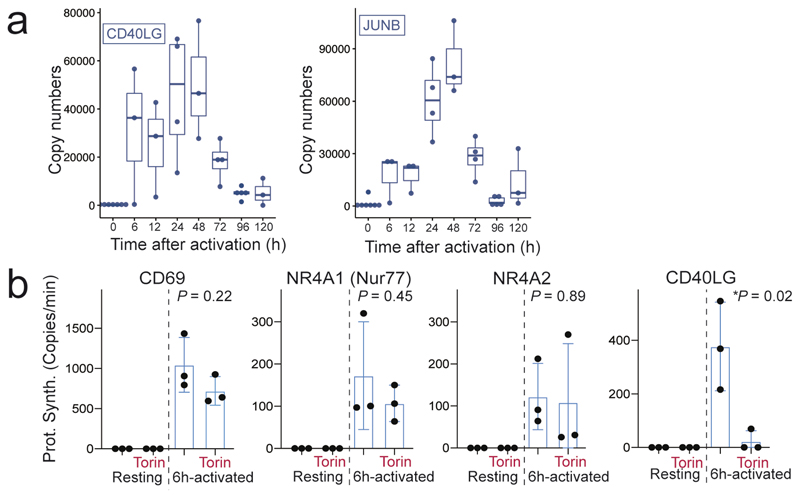
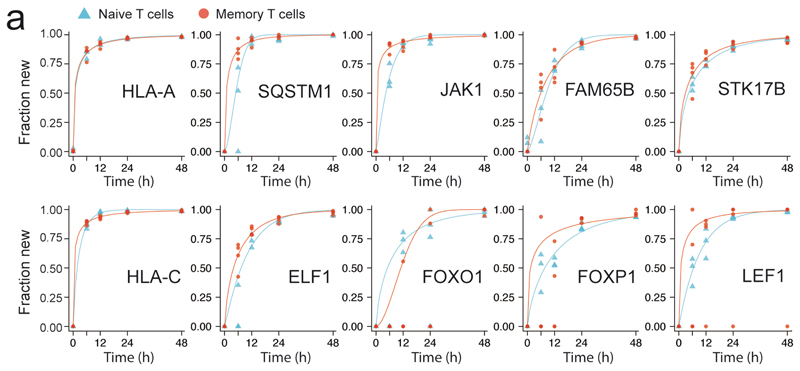
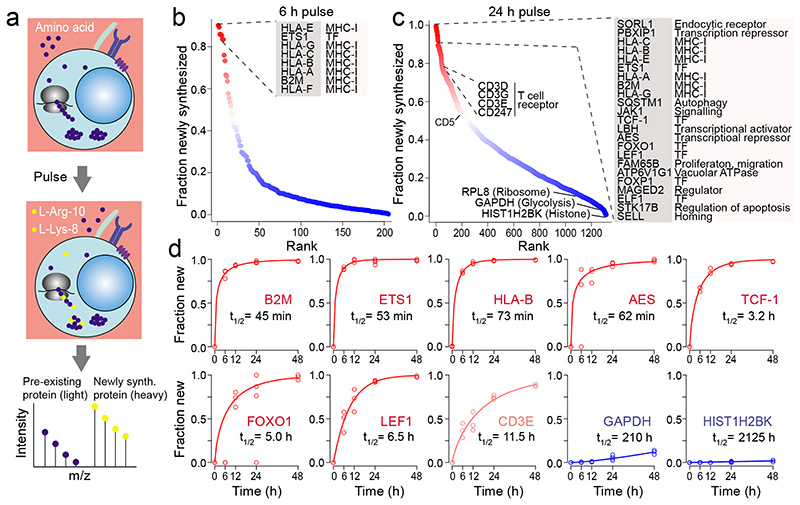
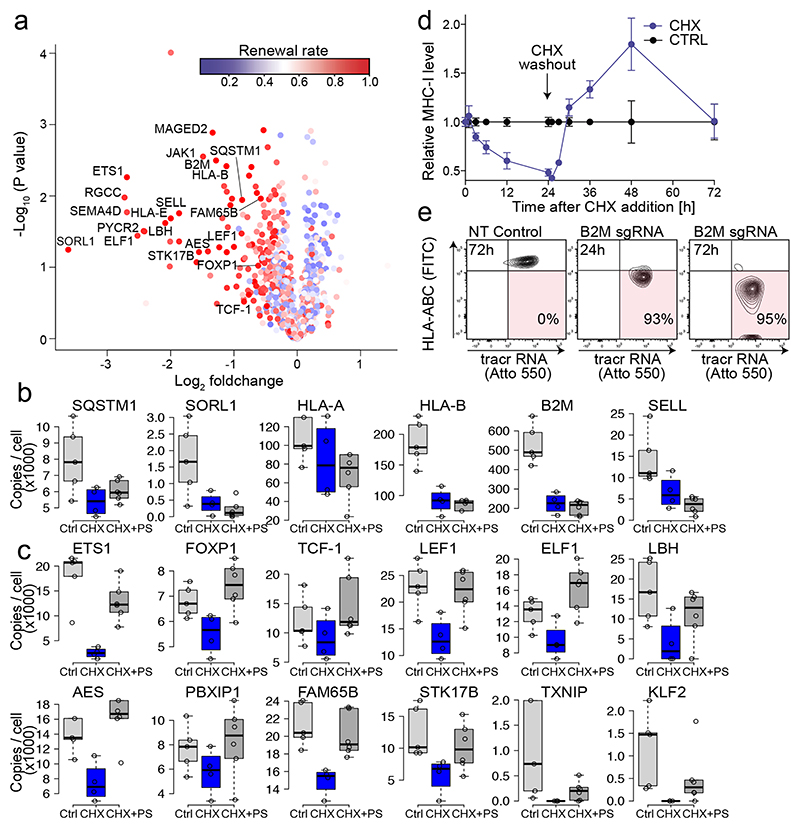
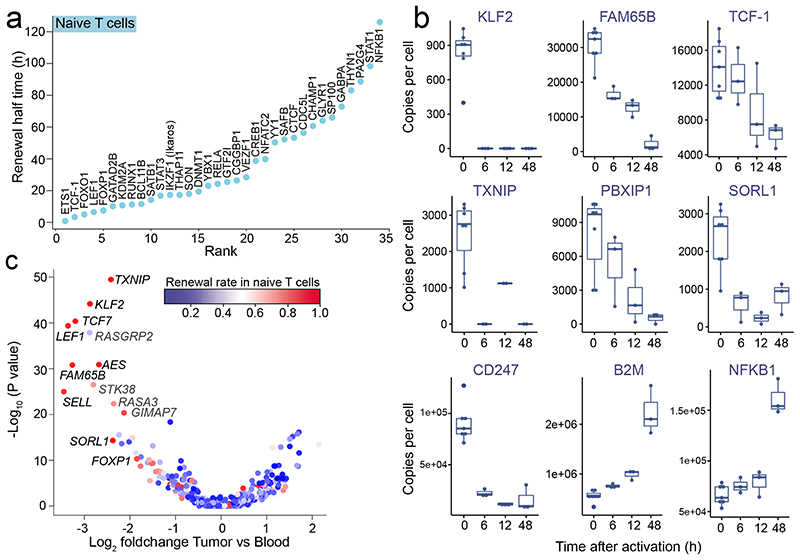
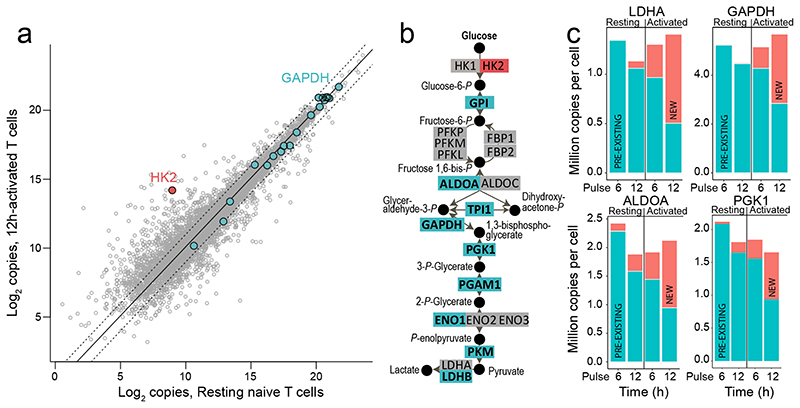
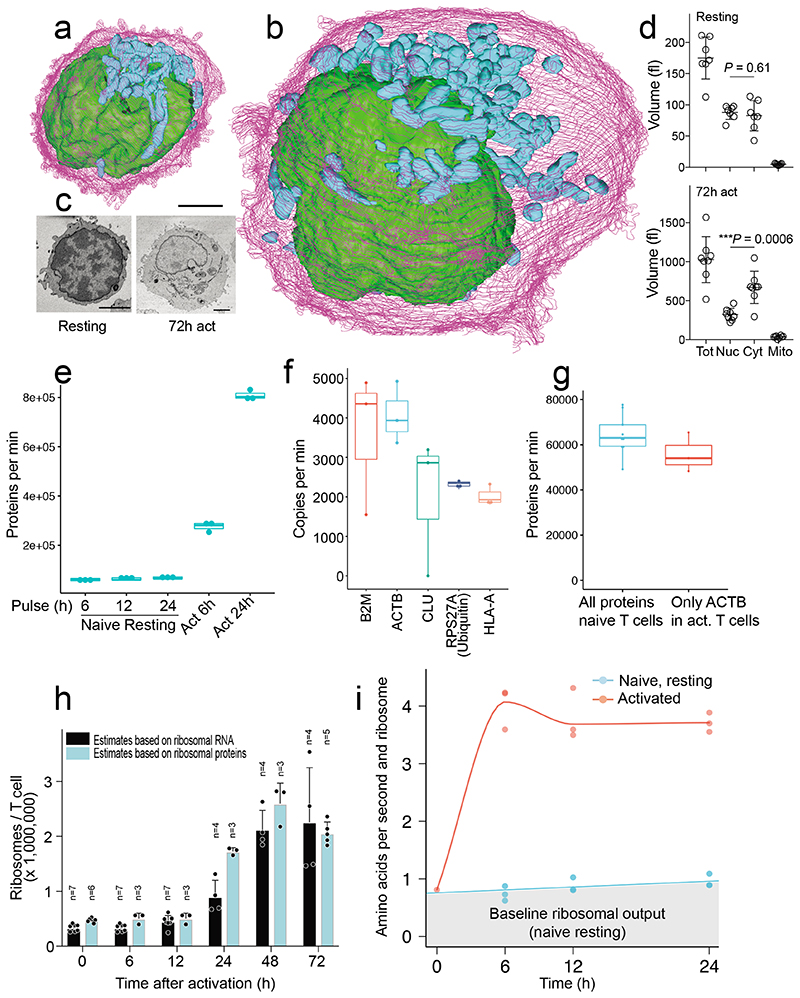
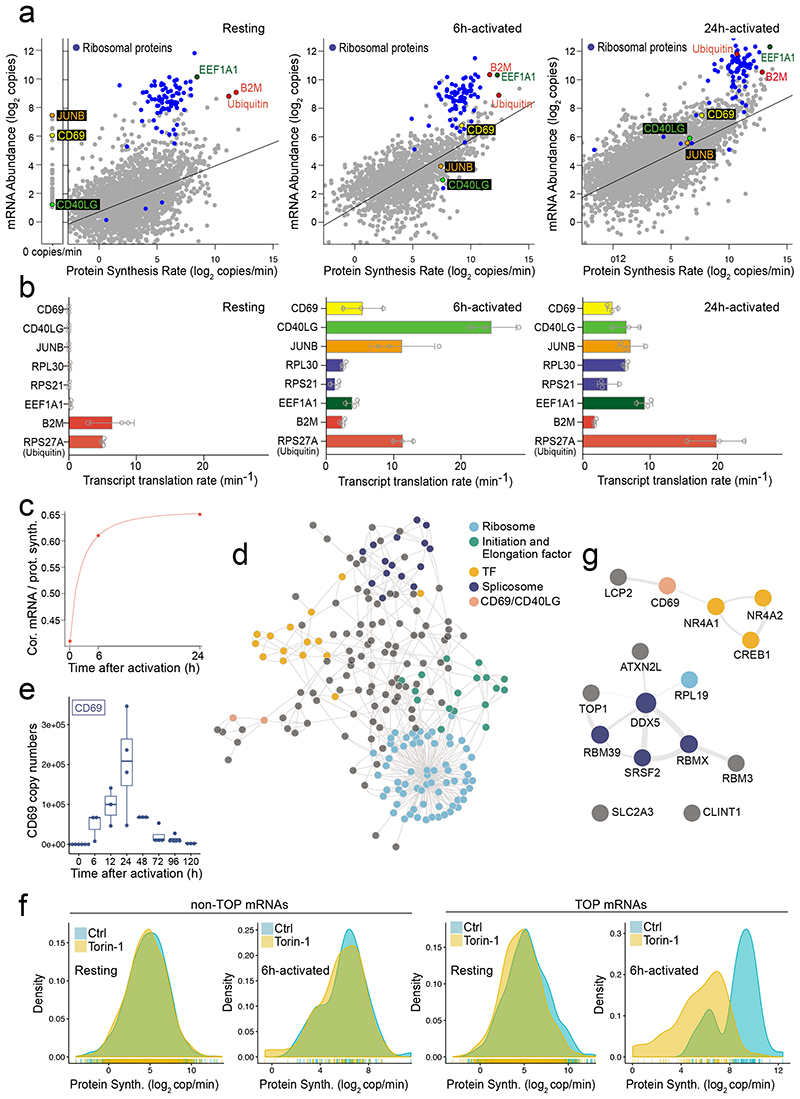
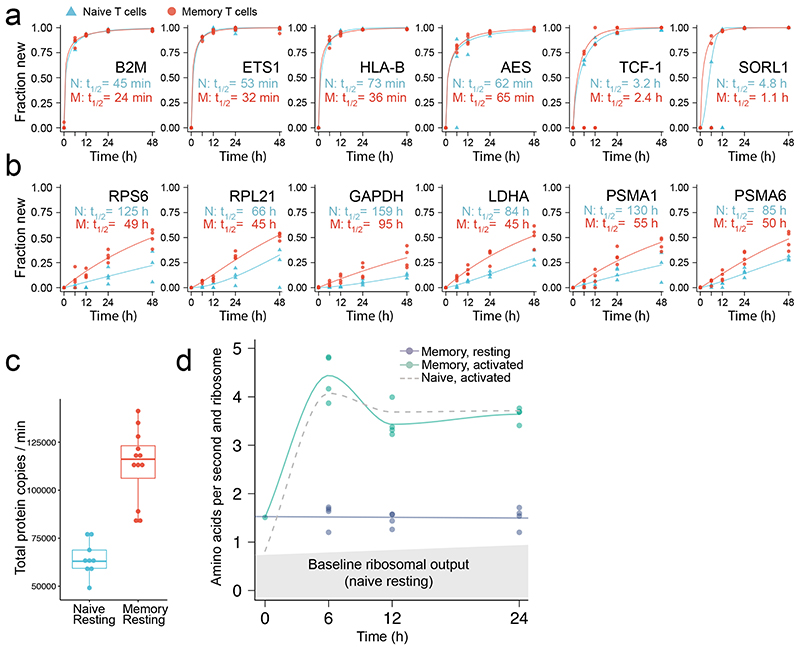
In response to pathogenic threats, naive T cells rapidly transition from a quiescent to an activated state, yet the underlying mechanisms are incompletely understood. Using a pulsed SILAC approach, we investigated the dynamics of mRNA translation kinetics and protein turnover in human naive and activated T cells. Our datasets uncovered that transcription factors maintaining T cell quiescence had constitutively high turnover, which facilitated their depletion following activation. Furthermore, naive T cells maintained a surprisingly large number of idling ribosomes as well as 242 repressed mRNA species and a reservoir of glycolytic enzymes. These components were rapidly engaged following stimulation, promoting an immediate translational and glycolytic switch to ramp up the T cell activation program. Our data elucidate new insights into how T cells maintain a prepared state to mount a rapid immune response, and provide a resource of protein turnover, absolute translation kinetics and protein synthesis rates in T cells ( https://www.immunomics.ch ).


Conflict of interest statement

Competing Interests

The authors declare no competing interests.

Figures

Extended Data Fig. 1
Extended Data Fig. 1. Viability of resting T cells in culture.
(a) Protein mass of naïve T cells does not change after 72h of culturing. Proteomes of T cells that were either analyzed immediately after isolation or after 72h of culturing were analyzed by LC-MS. Protein content was estimated using the proteome ruler approach. n=5 for freshly isolated and n= 2 for 72h-cultured T cells from different donors. Bars represent the S.E.M (b) FACS-purified naïve and memory T cells were cultured in complete medium without the addition of growth factors. To measure cell viability, T cells were stained with Annexin-V-FITC directly after sorting or after 24h and 96h of culturing and then analyzed by flow cytometry. n=4, Four independent experiments with T cells from two different donors. Bars represent the S.E.M. (c) FACS-purified naïve T cells were cultured for 24h in complete medium containing either DMSO, 50 μg/ml CHX or 50 μg/ml CHX together with 10 μM bortezomib (CHX + PS). n=8 from three different donors. Bars represent the S.E.M
Extended Data Fig. 2
Extended Data Fig. 2. Analysis of hallmark transcription factors.
(a) Frequency of ATAC-Seq peaksannotated to different genomic regions. (b) Frequency of ETS1 ChIP-Seq peaksannotated to different genomic regions. (c) Examples of activation markers that were up-regulated in TILs (CD69 and PD1) and proteins that were downregulated (KLF2, CD62L, and FAM65B). n=1627 for T cells from blood, n=2170 for T cells from tumors. Violin plot width is based on a Gaussian kernel density estimate of the data (estimated by the density function with standard parameters), scaled to have maximum width = 1. Data are from Zheng et al. 2016.
Extended Data Fig. 3
Extended Data Fig. 3. Increased turnover of glycolytic enzymes following activation.
(a) Naïve or 6h-activated T cells were analyzed on a Seahorse analyzer. Shown is the Extra Cellular Acidification Rate (ECAR), which is a measure of the glycolytic rate. n=6 from three donors. Bars represent the S.E.M (b) Gene ontology analysis of the proteome of naïve T cells. Glycolytic proteins (blue) contributed 11% to the cytosolic protein mass. (c) Fraction of newly synthetized (heavily labeled) glycolytic proteins after a 12-hours pulse in naïve or 12h-activated T cells. n=3 from three different donors. Box plot elements are defined as in Fig. 2b
Extended Data Fig. 4
Extended Data Fig. 4. 3D reconstructions of seven naïve and eight 72 h-activated T cells.
(a) Reconstructions of naïve CD4+ T cells. For the first two cells every layer of the plasma membrane (purple) was drawn, while for the other cells only every third layer was drawn. Scale bar = 2 μm (b) Reconstructions of 72 h-activated CD4+ T cells. For the first four cells every layer of the plasma membrane (purple) was drawn, while for the other cells only every third layer was drawn. Scale bar = 2 μm
Extended Data Fig. 5
Extended Data Fig. 5. Estimation of the number of ribosomes.
(a) Copy numbers of 82 ribosomal proteins in naïve T cells. n=7 from seven different donors. Box plot elements are defined as in Fig. 2b (b) Distribution of the copy numbers of ribosomal proteins in naïve T cells. Average values from n=7 are shown. Dashed line shows the median, which was used as an approximation of total ribosomes. (c) Total RNA in naïve and activated T cells. To estimate the number of ribosomes, it was assumed that 83% of total RNA was ribosomal RNA. n=7 for naïve, 6h and 12h-activated T cells. n=4 for 24h, 48h and 72h activated T cells from different donors. Bars represent the S.E.M (d) mRNA to protein ratio. n=7 for naïve, n=3 for 6h and n=4 for 24h activated T cells from different donors. Bars represent the S.E.M (e) Total amount of mRNA per T cell. n=9 for naïve and 24h activated T cells,n=7 for 6h and 12h activated T cells from different donors. Bars represent the S.E.M (f) Average mRNA copy numbers per T cell. (g) mRNA processing rate in naïve and 6h-activated T cells. Average values from n=3 from different donors are shown.
Extended Data Fig. 6
Extended Data Fig. 6. Posttranscriptional regulations.
(a) Absolute copy numbers of CD40LG and JUNB proteins in resting and activated T cells.n=7 for naïve T cells, n=3 for 6h, 12h, 48h, 120h-activated T cells, n=4 for 24h, 72h, 96h activated T cells. Box plot elements are defined as in Fig. 2b (b) Absolute protein synthesis rates in resting and 6h-activated T cells that were untreated or treated with Torin-1. n=3 from three donors. Bars represent the S.E.M.
Extended Data Fig. 7
Extended Data Fig. 7. Rapidly turned over proteins in naïve and memory T cells.
(a) Comparison of protein turnover kinetics in resting naïve and memory CD4+ T cells of selected proteins. n=3 for naïve 6h andnaïve 12h; n=4 for naïve 24h, memory 6h, memory 12h andmemory 24hfrom different donors.
Fig. 1
Fig. 1. A pulsed SILACapproach shows that a small set of important proteins is rapidly renewed in naïve T cells.
(a) Schematic of the pulsed SILAC workflow. (b) Shown are 205 protein species, which incorporated heavy amino acids after a 6 h pulse, ranked according to the fraction that was newly synthetized within 6 h. Average values from n=3 are shown. The inset shows protein species that were renewed by more than 80% in 6 h. Dots are colored according to turnover rate (Red to blue; Fast to slow) (c) Shown are1,313 protein species, which incorporated heavy amino acids after a 24 h pulse, ranked according to the fraction that was newly synthetized within 24h. Average values from n=3 are shown. The first inset shows protein species that were renewed by more than 90% in 24 h. A second inset shows components of the TCR. (d) Renewal kinetics of selected proteins. The half time (t1/2) was calculated by fitting a cumulative Weibull distribution. n=3 from three different donors.
Fig. 2
Fig. 2. Constitutive protein degradation in naïve T cells
(a) Naïve CD4+ T cells were cultured in the presence or absence of 50 μg/ml cycloheximide (CHX) for 24 h, after which their proteomes were analyzed by mass spectrometry. Volcano plot fromdifferential abundance analysis (two-tailed Welch’s t test) between control and CHX-treated cells. Each dot represents a protein; a negative Log2 foldchange means that the protein is less abundant in CHX-treated T cells. Only the 1,313 proteins shown in Fig. 1C, for which a renewal rate was also determined, are shown. The color code shows the renewal rate as determined by pulsed SILAC. n=4 from four different donors. (b) Naïve CD4+ T cells were treated with 50 μg/ml CHX alone or together with 10 μM bortezomib/PS341 (PS). Boxplot shows copy numbers of selected membrane proteins. n=5 for Ctrls, n=4 for CHX, n=6 for CHX+PS. Box plots denote the medians and the IQRs. The whiskers of each box plot are the lowest datum still within 1.5 IQR of the lower quartile and the highest datum still within 1.5 IQR of the upper quartile.(c) Same as in (b) but selected transcription factors and regulatory proteins are shown. Box plot elements are defined as in Fig. 2b (d) Naïve CD4+ T cells were treated with 50 μg/ml cycloheximide (CHX, blue points) and analyzed by flow cytometry at different time points. Shown is the fluorescence intensity relative to control cells that were not treated with CHX. n=3 from three different donors. Bars indicate the S.D. of the mean. (e) Naïve CD4+ T cells were electroporated with Cas9, ATTO550-labeled tracrRNA and two sgRNA targeting the B2M locus. Cells were stained with an antibody to HLA-A/B/C and analyzed by flow cytometry 24 h and 72h after electroporation. NT: Non-targeting sgRNA control. The experiment was repeated three times with similar results.
Fig. 3
Fig. 3. Rapid turnover and tunability of transcription factors
(a) Ranking of transcription factors in naïve T cells according to the renewal half time. Average values from n=3 are shown (b) Time course ofthe abundances of selected proteins in copy numbers per cell. Data points that were identified by MS/MS are shown. Each dot represents a different donor. n=7 for naïve, resting T cells. n=3 for 6h, 12h, 48h activated T cells. Box plot elements are defined as in Fig. 2b (c). Volcano plot showing results from differential expression analysis (two-tailed Welch’s t test) between mRNA levels in circulating (n=1627) and tumor-infiltrating CD4+ T cells (n=2170). Data were from Zheng et al. 2016. Shown are only mRNAs for which the turnover rate of the corresponding proteins was determined. mRNAs that are induced in TILs, i.e. PD-1 are not shown as these proteins are not present in naïve T cells and accordingly no turnover rate could be determined. The color code shows the protein turnover rate according to the pulsed SILAC data shown in Fig. 1c. n=3 from three different donors.
Fig. 4
Fig. 4. Metabolic preparedness of T cells.
(a) Comparison of protein copy numbers in naïve and 12 h-activated CD4+ T cells. Each dot represents a protein. Average values from n=7 for naïve and n=3 for 12h-activated T cells are shown. Glycolytic enzymes are shown as turquois dots. Hexokinase-2 (HK2) is marked in red. (b) Illustration of the glycolytic pathway. Highly abundant (> 300,000 copies) proteins in naïve T cells are shown in turquois. (c) The barplots show the fraction of pre-existing (turquois) and newly synthesized proteins (red) after a 6h and 12h pulse in naïve and activated T cells. Average values from n=3 are shown. Examples of LDHA, GAPDH, ALDOA and PGK1 are shown.
Fig. 5
Fig. 5. Translational preparedness of naïve T cells.
(a) 3D reconstruction of a naïve CD4+ T cell based on scanning block face electron microscopy images. The plasma membrane is drawn in purple, the nucleus in green and mitochondria in blue. Scale bar = 2 μm (b) 3D reconstruction of a 72 h-activated CD4+ T cells. Both cells (A+B) are drawn at the same scale. (c) Examples of electron microscopy images of a naïve (left) and 72 h-activated T cell (right) that were used for the 3D reconstructions. A total of 7 naïve and 8 activated T cells were analyzed and quantified in (d). All cells were fixed and embedded together. Scale bar = 2 μm (d) Quantification ofcell and organellar volumes based on 3D reconstructions of naïve CD4+ and 72h-activated T cells. n=7 for naïve T cells, n=8 for 72h-activated T cell. Bars indicate the S.E.M. P values were determined by a two-tailed unpaired t-test. (e) Thenumber oftotal proteins that aresynthesized in a minute in resting, naïve and activated CD4+ T cells are shown. For resting cells, data from three different pulse durations (6h, 12h, 24h) are shown. n=3 from three different donors. Box plot elements are defined as in Fig. 2b (f) Boxplot showing the synthesis rates of the five proteins with highest synthetic rates in naïve T cells. n=3 from three different donors. Box plot elements are defined as in Fig. 2b (g) Comparison of the total protein synthesis in naïve T cells tosynthesis of Actin B in 24h-activated T cells. n=7 for naïve, n=3 for memory. Box plot elements are defined as in Fig. 2b (h) Estimations of ribosomal proteins based on quantifications of ribosomal RNA and the median of ribosomal proteins.Sample numbers are indicated on the graph. Bars represent the S.E.M (i) Averagetranslation rate per ribosome in resting, naïve and activated CD4+ T cells. n=3 from three different donors.
Fig. 6
Fig. 6. Posttranscriptional regulations.
(a) Comparison ofabsolute mRNA copy numbers and average protein synthesis rates (from three donors) in resting (left panel), 6h-activated (middle panel) and 24h-activated T cells (right panel). Ribosomal proteins are colored in blue, all other colored dots are labeled with the protein name (b) Transcript translation rates of selected factors in resting (left panel), 6h-activated (middle panel) and 24h-activated T cells (right panel). Rates were calculated by dividing absolute protein synthesis rates by the number of respective mRNA copies. Theserates indicatehow many times a single transcript is read off by ribosomes per minute. n=3 from three donors. Bars represent the S.E.M (c) Analysis of the Spearman’s rank correlation between mRNA levels and protein synthesis rates in resting, 6 h and 24 h activated T cells. (d) Interaction network of proteins encoded by the 242 mRNAs that are repressed in naïve T cells. Each node represents a protein and edges represent protein-protein interactions based on the STRING database. (e) Absolute copy numbers of CD69 proteins in resting and activated T cells as determined by mass spectrometry. n=7 for naïve T cells,n=3 for 6h, 12h, 48h, 120h activated T cells,n=4 for 24h, 72h, 96h activated T cells. Box plot elements are defined as in Fig. 2b (f) Density plots showing the distribution of the protein synthesisrates (average from three different donors) in control T cells(blue) and T cells treated with 250 nM Torin 1 (yellow). The two panels on the left show the distribution of synthesis rates of proteins encoded by non-TOP mRNAs in naïve and 6h-activated T cells, respectively. The two panels on the right show the distribution of synthesis rates of proteins encoded by TOP mRNAs in naïve and 6h-activated T cells, respectively. (g) Subnetwork form Fig. 6d. The 15 nodes represent proteins encoded by repressed mRNAs that were engaged following activation independent on mTOR. The 15 mRNAs were identified by comparing activation-induced changes in synthesis rates of proteins that are encoded by the 242 repressed mRNAs. In the presence of Torin 1, the increase in the synthesis of these 15 proteins was not affected (Log2 Foldchange < 1). The color code is the same as in Fig. 6d.
Fig. 7
Fig. 7. Preparedness of memory T cells.
(a) Comparison of protein turnover kinetics in naïve and memory CD4+ T cells of selected proteins. n=3 for naïve 6h and naïve 12h; n=4 for naïve 24h, memory 6h, memory 12h and memory 24hfrom different donors. (b) Same as in (a)but two ribosomal proteins (RPS6 and RPL21), two glycolytic enzymes (GAPDH and LDHA)and two proteasomal proteins (PSMA1 and PSMA6) are shown. (c) Comparison oftotal protein synthesis in resting, naïve and memory T cells.n=9 for naïve, n=12 for memory. Box plot elements are defined as in Fig. 2b (d) Averagetranslation rate per ribosome in amino acids per second and ribosome in resting, memory and activated CD4+ T cells. The grey area shows the baseline ribosomal output in naïve T cells. n=4from threedifferent donors.

Comment in

  • The active inner life of naive T cells.
    Marchingo JM, Cantrell DA. Marchingo JM, et al. Nat Immunol. 2020 Aug;21(8):827-828. doi: 10.1038/s41590-020-0726-1. Nat Immunol. 2020. PMID: 32632288 No abstract available.

Similar articles

Cited by

References

    1. Crabtree GR. Contingent genetic regulatory events in T lymphocyte activation. Science. 1989;243:355–361. - PubMed
    1. Vrisekoop N, et al. Sparse production but preferential incorporation of recently produced naive T cells in the human peripheral pool. Proceedings of the National Academy of Sciences of the United States of America. 2008;105:6115–6120. - PMC - PubMed
    1. Chapman NM, Boothby MR, Chi H. Metabolic coordination of T cell quiescence and activation. Nature reviews Immunology. 2019 - PubMed
    1. Pearce EL, Poffenberger MC, Chang C-H, Jones RG. Fueling immunity: insights into metabolism and lymphocyte function. Science. 2013;342:1242454. - PubMed
    1. Fox CJ, Hammerman PS, Thompson CB. Fuel feeds function: energy metabolism and the T-cell response. Nature reviews Immunology. 2005;5:844–852. - PubMed

Publication types

MeSH terms