. 2020 Dec;38(12):1415-1420.
doi: 10.1038/s41587-020-0570-8. Epub 2020 Jul 6.

A dual-constriction biological nanopore resolves homonucleotide sequences with high fidelity

Affiliations

A dual-constriction biological nanopore resolves homonucleotide sequences with high fidelity

Sander E Van der Verren et al. Nat Biotechnol. 2020 Dec.

Abstract

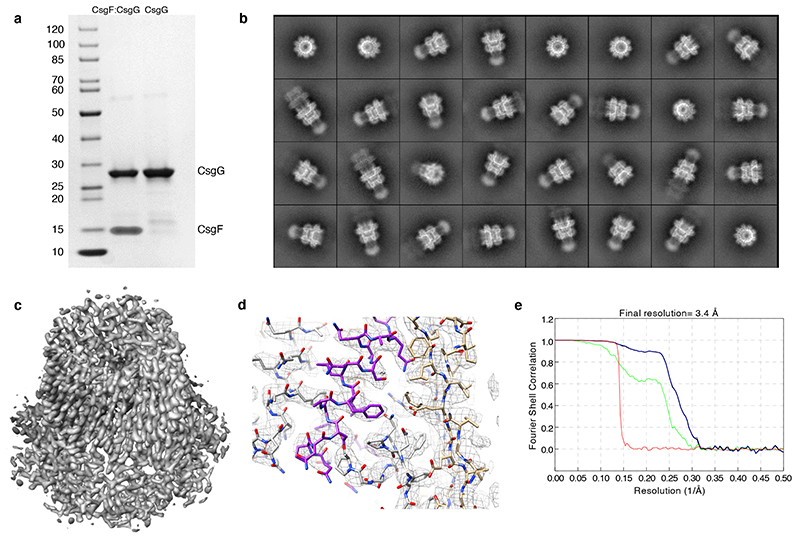
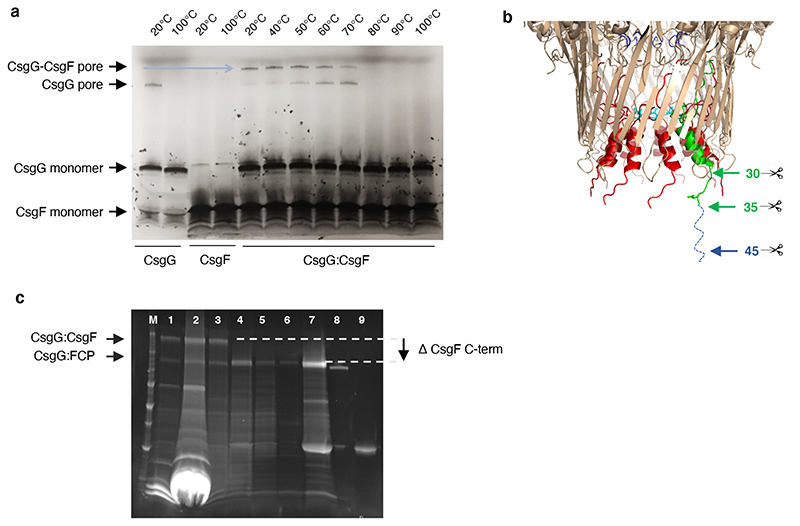
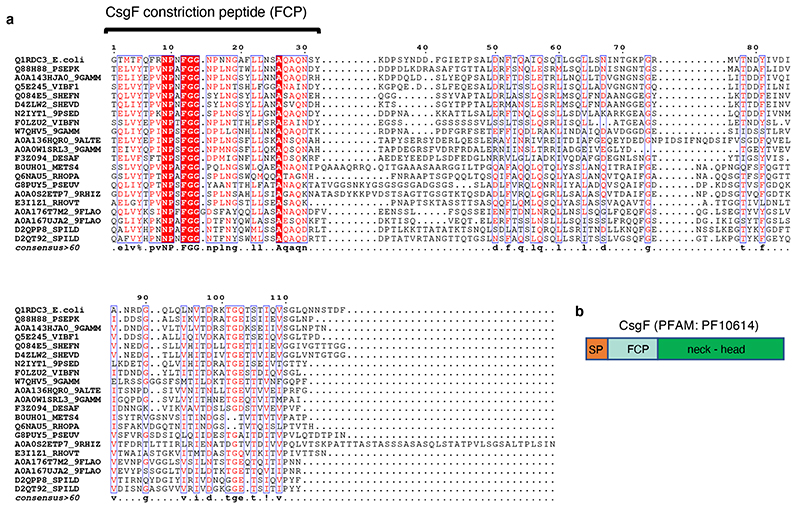
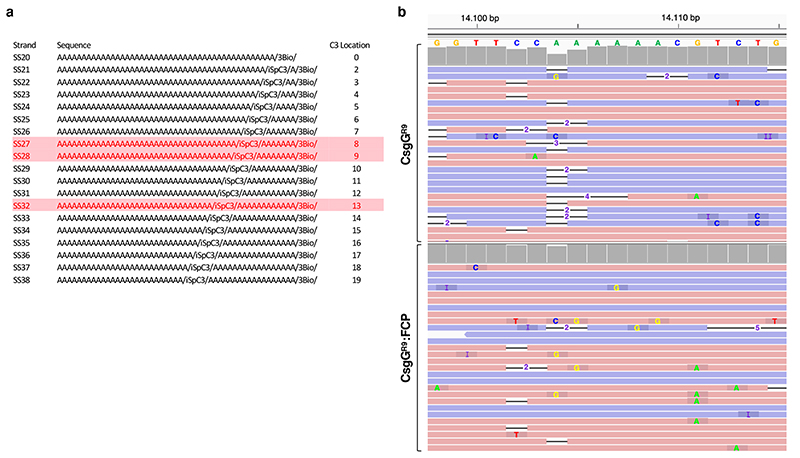
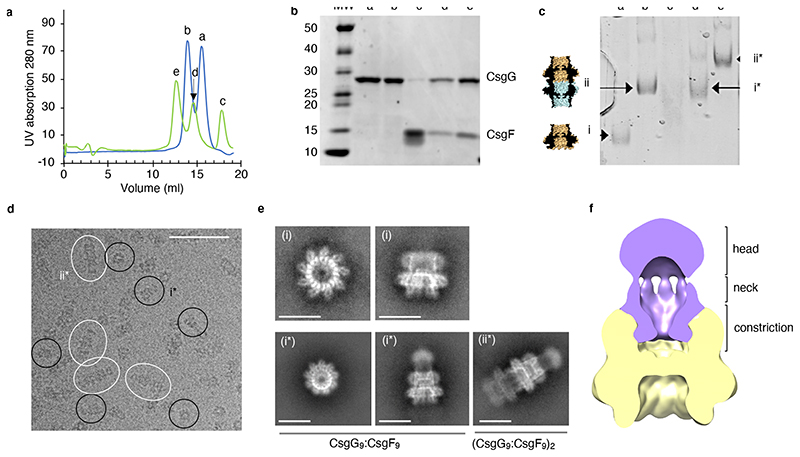
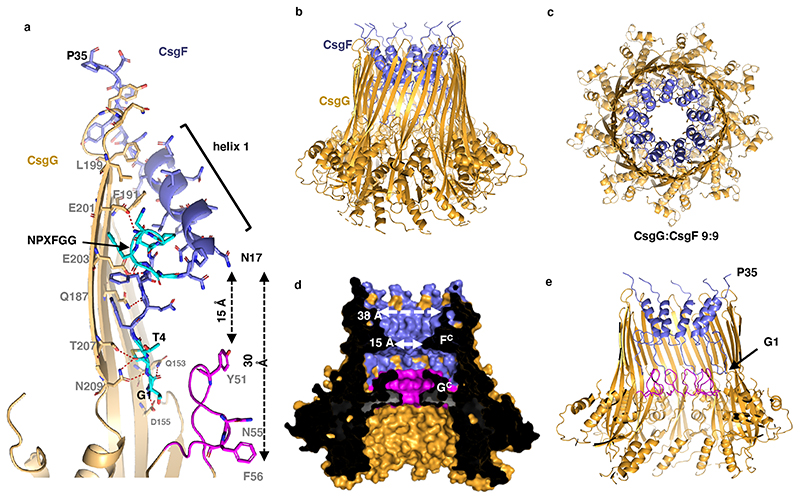
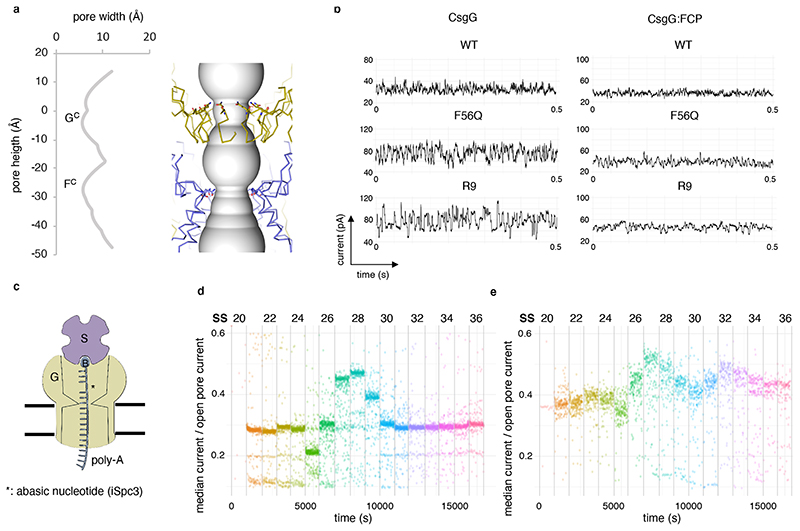
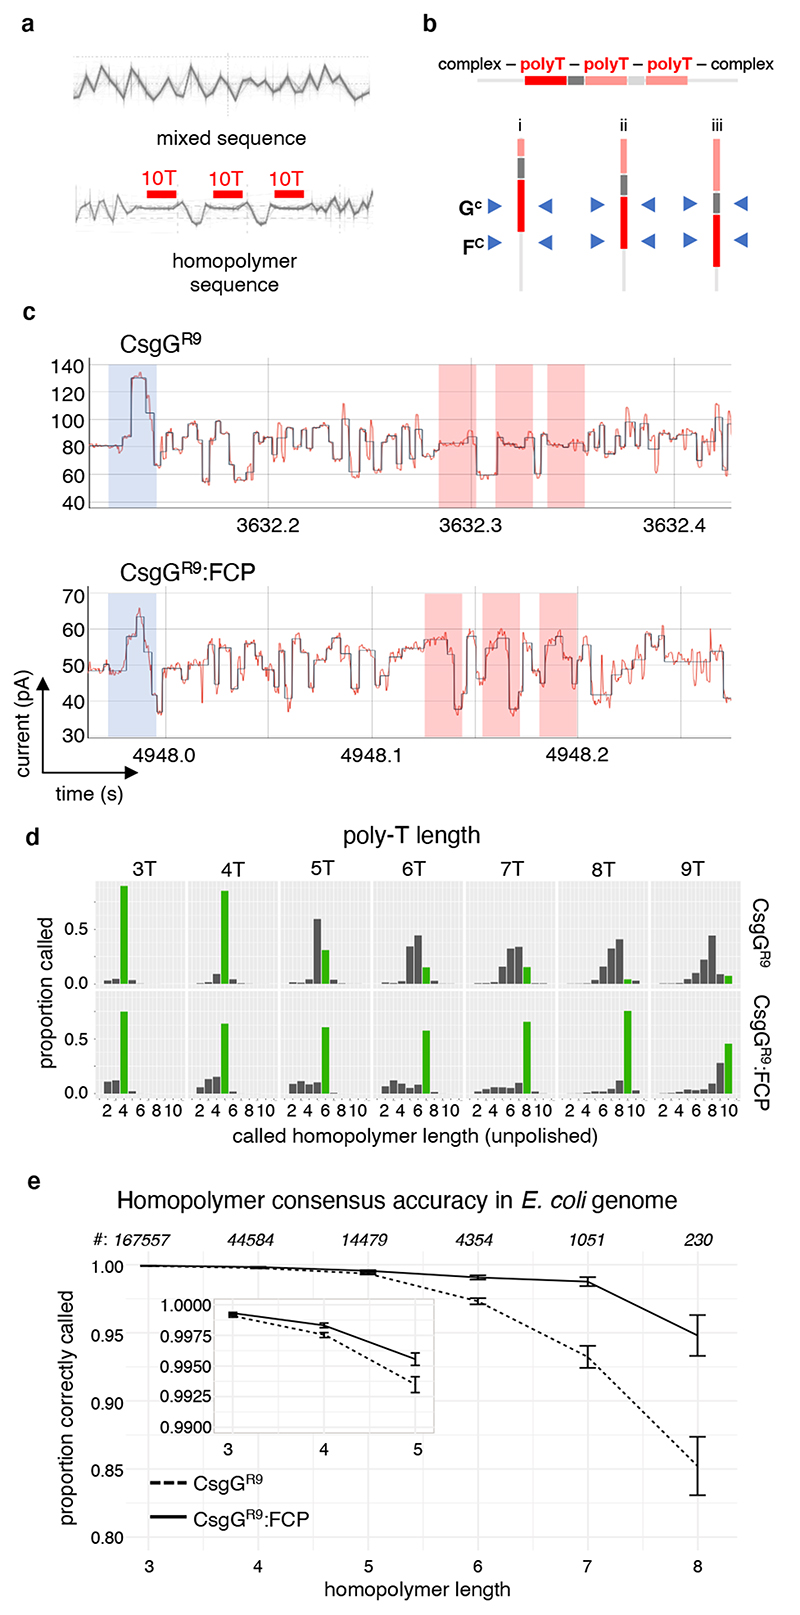
Single-molecule long-read DNA sequencing with biological nanopores is fast and high-throughput but suffers reduced accuracy in homonucleotide stretches. We now combine the CsgG nanopore with the 35-residue N-terminal region of its extracellular interaction partner CsgF to produce a dual-constriction pore with improved signal and base-calling accuracy for homopolymer regions. The electron cryo-microscopy structure of CsgG in complex with full-length CsgF shows that the 33 N-terminal residues of CsgF bind inside the β-barrel of the pore, forming a defined second constriction. In complexes of CsgG bound to a 35-residue CsgF constriction peptide, the second constriction is separated from the primary constriction by ~25 Å. We find that both constrictions contribute to electrical signal modulation during single-stranded DNA translocation. DNA sequencing using a prototype CsgG-CsgF protein pore with two constrictions improved single-read accuracy by 25 to 70% in homopolymers up to 9 nucleotides long.


Conflict of interest statement

Competing interests

VIB and ONT have jointly filed two provisional patent applications on the construction and use of dual constriction pores in nanopore sensing applications (PCT/GB2018/051858 and PCT/GB2018/051191). VIB has a funded research collaboration agreement with VIB related to CsgG-derived nanopores. ONT uses CsgG-derived nanopores in its MinION, GridION and PromethION nanopore sequencing devices. As inventors on VIB IP, SVDV, NVG and HR receive a share in royalty payments. RH, PS, JK, MJ, EJW and LJ are employees of ONT and own company share options.

Figures

Extended Data Fig. 1
Extended Data Fig. 1. Electron cryo-microscopy of the CsgG:CsgF complex
(a) SDS PAGE of CsgG or CsgG:CsgF complex obtained by tandem affinity purification of the outer membrane proteins extracted from cells expressing CsgG-strep (pPG1) or CsgG-strep and CsgF-His (pNA62), respectively. Gel representative for n>10 experiments. (b) Representative 2D class averages for the CsgG:CsgF dataset enriched for single pores (i.e. C9 CsgG:CsgF complexes), generated using SIMPLE and used for 3D reconstruction using Relion-2.0. (c) Off-axis top view and cross-sectional side view of the CsgG:CsgF cryo-EM 3D density reconstructed to 3.4 Å. (d) Representative region of electron density of the CsgG:CsgF complex. Region of focus is the constriction helix of FCP, stacking against the lumen of the CsgG β-barrel. One CsgF protomer is highlighted in purple, the others in grey; CsgG is depicted in gold. Heteroatoms are in blue (nitrogens) and red (oxygens). The density map is cut-off at a contour of 0.5, shown in stick and mesh representation, rendered using UCSF Chimera 1.10.2. (e) Fourier Shell Correlation (FSC) curves of the final 3D reconstruction (black: FSC corrected map, green: FSC unmasked map, blue: FSC masked map, red: FSC phase randomized unmasked map).
Extended Data Fig. 2
Extended Data Fig. 2. Production and thermal stability of CsgG:CsgF and CsgG:FCP pores
(a) Production and temperature stability assessment of the CsgG:CsgF pore complex. Incubation of purified CsgG and CsgF in a 1:1 ratio results in the formation of a SDS stable CsgG:CsgF pore complex that is heat stable up to 70 °C. (b) The N-terminal residues of CsgF insert into the CsgG channel and form a second region of constriction, whilst the remaining ~100 residues form a cap like head structure (Figure 1e, f). For nanopore sensing purposes, we sought to produce a complex of CsgG with the CsgF constriction peptide (FCP), lacking the neck and head domains. To do so, CsgG was complexed with CsgF mutants modified to insert a TEV cleavage site at position 30, 35 or 45. The reconstituted CsgG:CsgF pore complexes were digested with TEV protease and analysed by SDS-PAGE (c). M: molecular mass marker, Lane 1, 2: Strep-tag affinity purified CsgG:CsgF complex and excess CsgG, Lane 3: isolation of CsgG:CsgF complex by size exclusion chromatography, Lane 4: CsgG:CsgF35-TEV cleaved with TEV protease to generate CsgG:FCP complex, Lane 5: flow through of CsgG:FCP after strep purification, Lane 6: CsgG:FCP heated to 60°C for 10 minutes. Lane 7: Eluted CsgG:FCP complex from strep column, Lane 8: CsgG pore as the control, Lane 9: TEV protease as the control.
Extended Data Fig. 3
Extended Data Fig. 3. Multiple sequence alignment of CsgF-homologues
(a) Multiple sequence alignment (Multalin) of 22 representative CsgF sequences. Aligned sequences are shown as mature proteins (i.e. lacking their N-terminal signal peptide). The N-terminal 33 residues of the mature protein form a continuous stretch of high sequence conservation (48% average pairwise sequence identity) encompassing the region interacting with CsgG and forming the CsgF constriction peptide. CsgF homologues included in the multiple sequence alignment are UniProt entries Q88H88; A0A143HJA0; Q5E245; Q084E5; F0LZU2; A0A136HQR0; A0A0W1SRL3; B0UH01; Q6NAU5; G8PUY5; A0A0S2ETP7; E3I1Z1; F3Z094; A0A176T7M2; D2QPP8; N2IYT1; W7QHV5; D4ZLW2; D2QT92; A0A167UJA2. (b) Schematic diagram of CsgF protein architecture. (SP) signal peptide, cleaved upon secretion; (FCP) CsgF constriction peptide, CsgF neck and head region are coloured green.
Extended Data Fig. 4
Extended Data Fig. 4. Sequencing setup and channel characteristics of CsgG and CsgG:FCP nanopores
(a) Schematic representation of the electrophysiology setup of CsgG-based nanopores as used for polynucleotide sequencing. CsgG-based channels (G) are reconstituted into artificial membranes with the periplasmic vestibule and β-barrel exposed to the cis and trans sides, respectively. Polynucleotide – enzyme (E) complexes are added to the cis side and current reads are recorded under an electric potential (Δψ) of 100 to 300 mV. (b, c) Representative single channel traces (b) and current - voltage (IV) curves (c) for wildtype CsgG, CsgGF56Q and CsgGR9 and their FCP complexes: CsgG:FCP, CsgGF56Q:FCP and CsgGR9:FCP. IV curves show mean ± 95% confidence interval of at least 60 single channels per pore, with the exception of wildtype CsgG (36 single channels) and CsgG:FCP (14 single channels).
Extended Data Fig. 5
Extended Data Fig. 5. Single channel stability of CsgGR9:FCP complexes
(a, b) Single channel conductance trace of two representative CsgGR9:FCP nanopores during a 24 hour sequencing run, recorded at -180 mV. The data show both CsgGR9 and CsgGR9:FCP are predominantly in a sequencing, DNA-occupied state, with apo pores capturing new DNA strands within seconds. The two traces show a CsgGR9:FCP pore complex that stays intact of the 24h sequencing run (a), as well as a pore complex that shows dissociation of the FCP peptides during the sequencing run (at ~ 19h; b). Upon FCP dissociation, the channel continues sequencing now as a CsgGR9 apo pore (labelled CsgGR9). Arrows indicate the average conductance levels of the open pore and the DNA-occupied pore during sequencing intervals. The zoomed in panels show two representative 30s time windows of the sequencing run of the intact CsgGR9:FCP channel (left) and the CsgGR9 channel following dissociation of FCP (right). The full and zoomed in sequencing runs show high DNA capture rates for CsgGR9:FCP channels throughout the 24h sequencing run. (c) Scatter plot of the open pore current of 25 CsgGR9:FCP channels during 24h sequencing runs, recorded at -180 mV. Open pore plots for CsgGR9:FCP pores that stay intact throughout the 24h run (n=22), and pores that lose FCP (n=3) are coloured blue and red, respectively.
Extended Data Fig. 6
Extended Data Fig. 6. Constriction mapping oligos and single read basecalls for CsgGR9 and CsgGR9:FCP nanopores
(a) Set of static polyA ssDNA oligonucleotides in which one base is missing from the DNA backbone (iSpc3). These oligos that have differing location of the abasic nucleotide, dubbed SS20 to SS38, were used to map the constriction position in CsgGF56Q or CsgGF56Q:FCP (Figure 3d). Biotin modification at the 3’ end of each strand is complexed with monovalent streptavidin to block translocation of the oligo and give a defined distance marker between the pore entrance (block site) and pore constriction (site of increased conductance when occupied by the abasic nucleotide; Figure 3c). SS27-SS28 and SS32 (highlighted red) have their abasic nucleotide located at the CsgG and FCP constriction, respectively (Figure 3d, e). (b) Comparison of errors in single read (n=26) basecalls from CsgGR9 and CsgGR9:FCP pores that have been aligned to a representative region of the E. coli reference genome sequence. The region displayed corresponds to the locus 14,098 to 14,115. The figure is plotted using the Integrative Genomics Viewer software. Pink/purple bars correspond to single reads in the forward and reverse directions respectively. Black horizontal bars correspond to deletions in the basecalls, where the number corresponds to the number of deletions at the specific loci. Individual substitutions are labeled with the miscalled nucleotide (C in blue, T in red, G in orange and A in green). Insertions are labelled “I” (purple). Grey bars on top of the list of single reads of the CsgGR9 and CsgGR9:FCP pores correspond to the consensus accuracy per position.
Figure 1
Figure 1. CsgG forms a stable complex with CsgF.
(a) Comparison of size exclusion profiles of CsgG with (green) and without (blue) excess CsgF. (b) 4-20% TGX stain-free SDS-PAGE and (c) tris-borate native PAGE of the elution fractions labelled a-e in panel a, corresponding to, respectively, C9 CsgG single channels (i), D9 CsgG dimeric channels (ii), excess CsgF, and the CsgF complexes of C9 CsgG (i*) and D9 CsgG (ii*). Experiment was repeated 3 times. (d) Cryo-electron micrograph. Single particles of single (i*) and dimeric (ii*) CsgG:CsgF pores are circled black and white, respectively, scale bar is 50 nm. (e) Representative 2D class averages highlighting views along the C9 symmetry axis (left) and side views of single (middle) and double (right) CsgG (upper row) and CsgG:CsgF (lower row) pores. (f) Slice-through 3D volume of CsgG:CsgF complex filtered down to 15 Å using EMAN2 and segmented and displayed at contour of 0.0073 in UCSF Chimera. Density corresponding to CsgG and CsgF is coloured gold and purple, respectively.
Figure 2
Figure 2. CsgG:CsgF cryo-EM structure reveals a dual constriction pore.
(a) Close-up ribbon and sticks (CsgF) representation of a single CsgG (gold) and CsgF (purple) protomer of the CsgG:CsgF cryo-EM structure. The CsgG constriction formed by Y51, N55 and F56 is highlighted magenta, and the N-terminal four residues and the conserved NPXFGG motif in CsgF are highlighted in cyan. Oxygens are red, nitrogens blue. H-bonds anchoring the CsgG:CsgF interaction are depicted as dashed red lines. (b, c, d, e) The CsgG:CsgF pore shown in side (b), top (c) and cross-sectional views (d, e), depicted in ribbon (b, c and e) and solvent-accessible surface (d) representations, coloured as in panel a. GC: CsgG-constriction, FC: CsgF-constriction. Only the CsgF N-terminus (residue G1 to P35) forming the CsgF-constriction peptide (FCP) could be resolved in the cryo-EM density (Extended Data Figure 2).
Figure 3
Figure 3. The CsgF constriction peptide creates a second constriction in the CsgG pore.
(a) Channel radii plotted against channel height (left) and its corresponding position in the CsgGF56Q:FCP complex (right). Distances are in angström. CsgG and FCP are depicted in gold and purple, respectively. Q56 in the CsgG constriction and N17 CsgF are shown in stick representation. (b) Representative current signatures during passage of single DNA strands through the WT CsgG, CsgGF56Q, CsgGR9 nanopores and their respective CsgG:FCP complexes. Data measured at -180 mV and representative of >100 capture events and >10 single channels. (Shown experiment representative of at least 3 repeat experiments) (c) Schematic diagram of pore read point detection assay. Pores are probed with oligonucleotides (SS20-SS36; Extended Data Figure 6a) with an abasic nucleotide (asterisk) at a defined distance from a biotin (B) – streptavidin (S) blockage. When the abasic residue resides at the pore constriction, this results in increased conductance levels. (d, e) Current levels for different static oligos (SS20-SS30) bound in CsgGF56Q (d) or CsgGF56Q:FCP (e). Each dot represents a single data point (at least 255 (d) and 76 (e) data points per oligo, measured from at least n=24 pores).
Figure 4
Figure 4. Homopolymer basecalling by a prototype CsgG:FCP nanopore.
(a) Overlaid single molecule conductance profiles of a mixed ssDNA sequence (top) and a trial ssDNA sequence (bottom) containing three consecutive homopolymers of ten deoxythymidines (10T) spaced by GGAA intervals as read using the CsgGR9 nanopore (>500 individual traces coming from at least 50 pores). (b) Schematic representation of three interaction scenarios of the trial ssDNA sequence by the CsgG and FCP constrictions, labelled GC and FC respectively. The dual constriction is expected to increase the inclusion of sequence outside the homonucleotide stretch during passage through the pore (scenario i and iii). (c) Single molecule conductance signals of the 10T homopolymer containing trial sequence (shown in panel a) analysed by CsgGR9 (upper) or CsgGR9:FCP (lower) pores. Shaded zones correspond to the adaptor (blue) and the 10T (red) regions. Traces are representative for >1000 capture events and >50 pores. (d) Histograms of single read homopolymer length calling of ssDNA containing poly-T stretches ranging 3 to 9 nucleotides in length, sequenced by CsgGR9 or CsgGR9:FCP. Correctly called homopolymer lengths are shown in green (plots contain at least 166,000 single reads per oligo). (e) Comparison of the proportion (± SD) of correctly called homopolymers versus homopolymer length for CsgGR9 and CsgGR9:FCP pores. The plot shows consensus accuracies across the four bases, using data polished with the medaka software package developed at ONT, and is based on an E. coli assembly of depth 100x. Occurrences of the respective homopolymer lengths in the E. coli genome are indicated on top. Nonameric (n=22) and longer (n=2) homopolymers become too rare to provide statistically relevant numbers.

Comment in

References

    1. Bayley H, Cremer PS. Stochastic sensors inspired by biology. Nature. 2001;413:226–230. doi: 10.1038/35093038. - DOI - PubMed
    1. Howorka S, Cheley S, Bayley H. Sequence-specific detection of individual DNA strands using engineered nanopores. Nature biotechnology. 2001;19:636–639. doi: 10.1038/90236. - DOI - PubMed
    1. Meller A, Nivon L, Brandin E, Golovchenko J, Branton D. Rapid nanopore discrimination between single polynucleotide molecules. Proceedings of the National Academy of Sciences of the United States of America. 2000;97:1079–1084. - PMC - PubMed
    1. Akeson M, Branton D, Kasianowicz JJ, Brandin E, Deamer DW. Microsecond time-scale discrimination among polycytidylic acid, polyadenylic acid, and polyuridylic acid as homopolymers or as segments within single RNA molecules. Biophysical journal. 1999;77:3227–3233. doi: 10.1016/S0006-3495(99)77153-5. - DOI - PMC - PubMed
    1. Benner S, et al. Sequence-specific detection of individual DNA polymerase complexes in real time using a nanopore. Nature nanotechnology. 2007;2:718–724. doi: 10.1038/nnano.2007.344. - DOI - PMC - PubMed

Publication types

LinkOut - more resources