. 2020 Sep;52(9):931-938.
doi: 10.1038/s41588-020-0662-x. Epub 2020 Jul 6.

RNA is essential for PRC2 chromatin occupancy and function in human pluripotent stem cells

Affiliations

RNA is essential for PRC2 chromatin occupancy and function in human pluripotent stem cells

Yicheng Long et al. Nat Genet. 2020 Sep.

Abstract

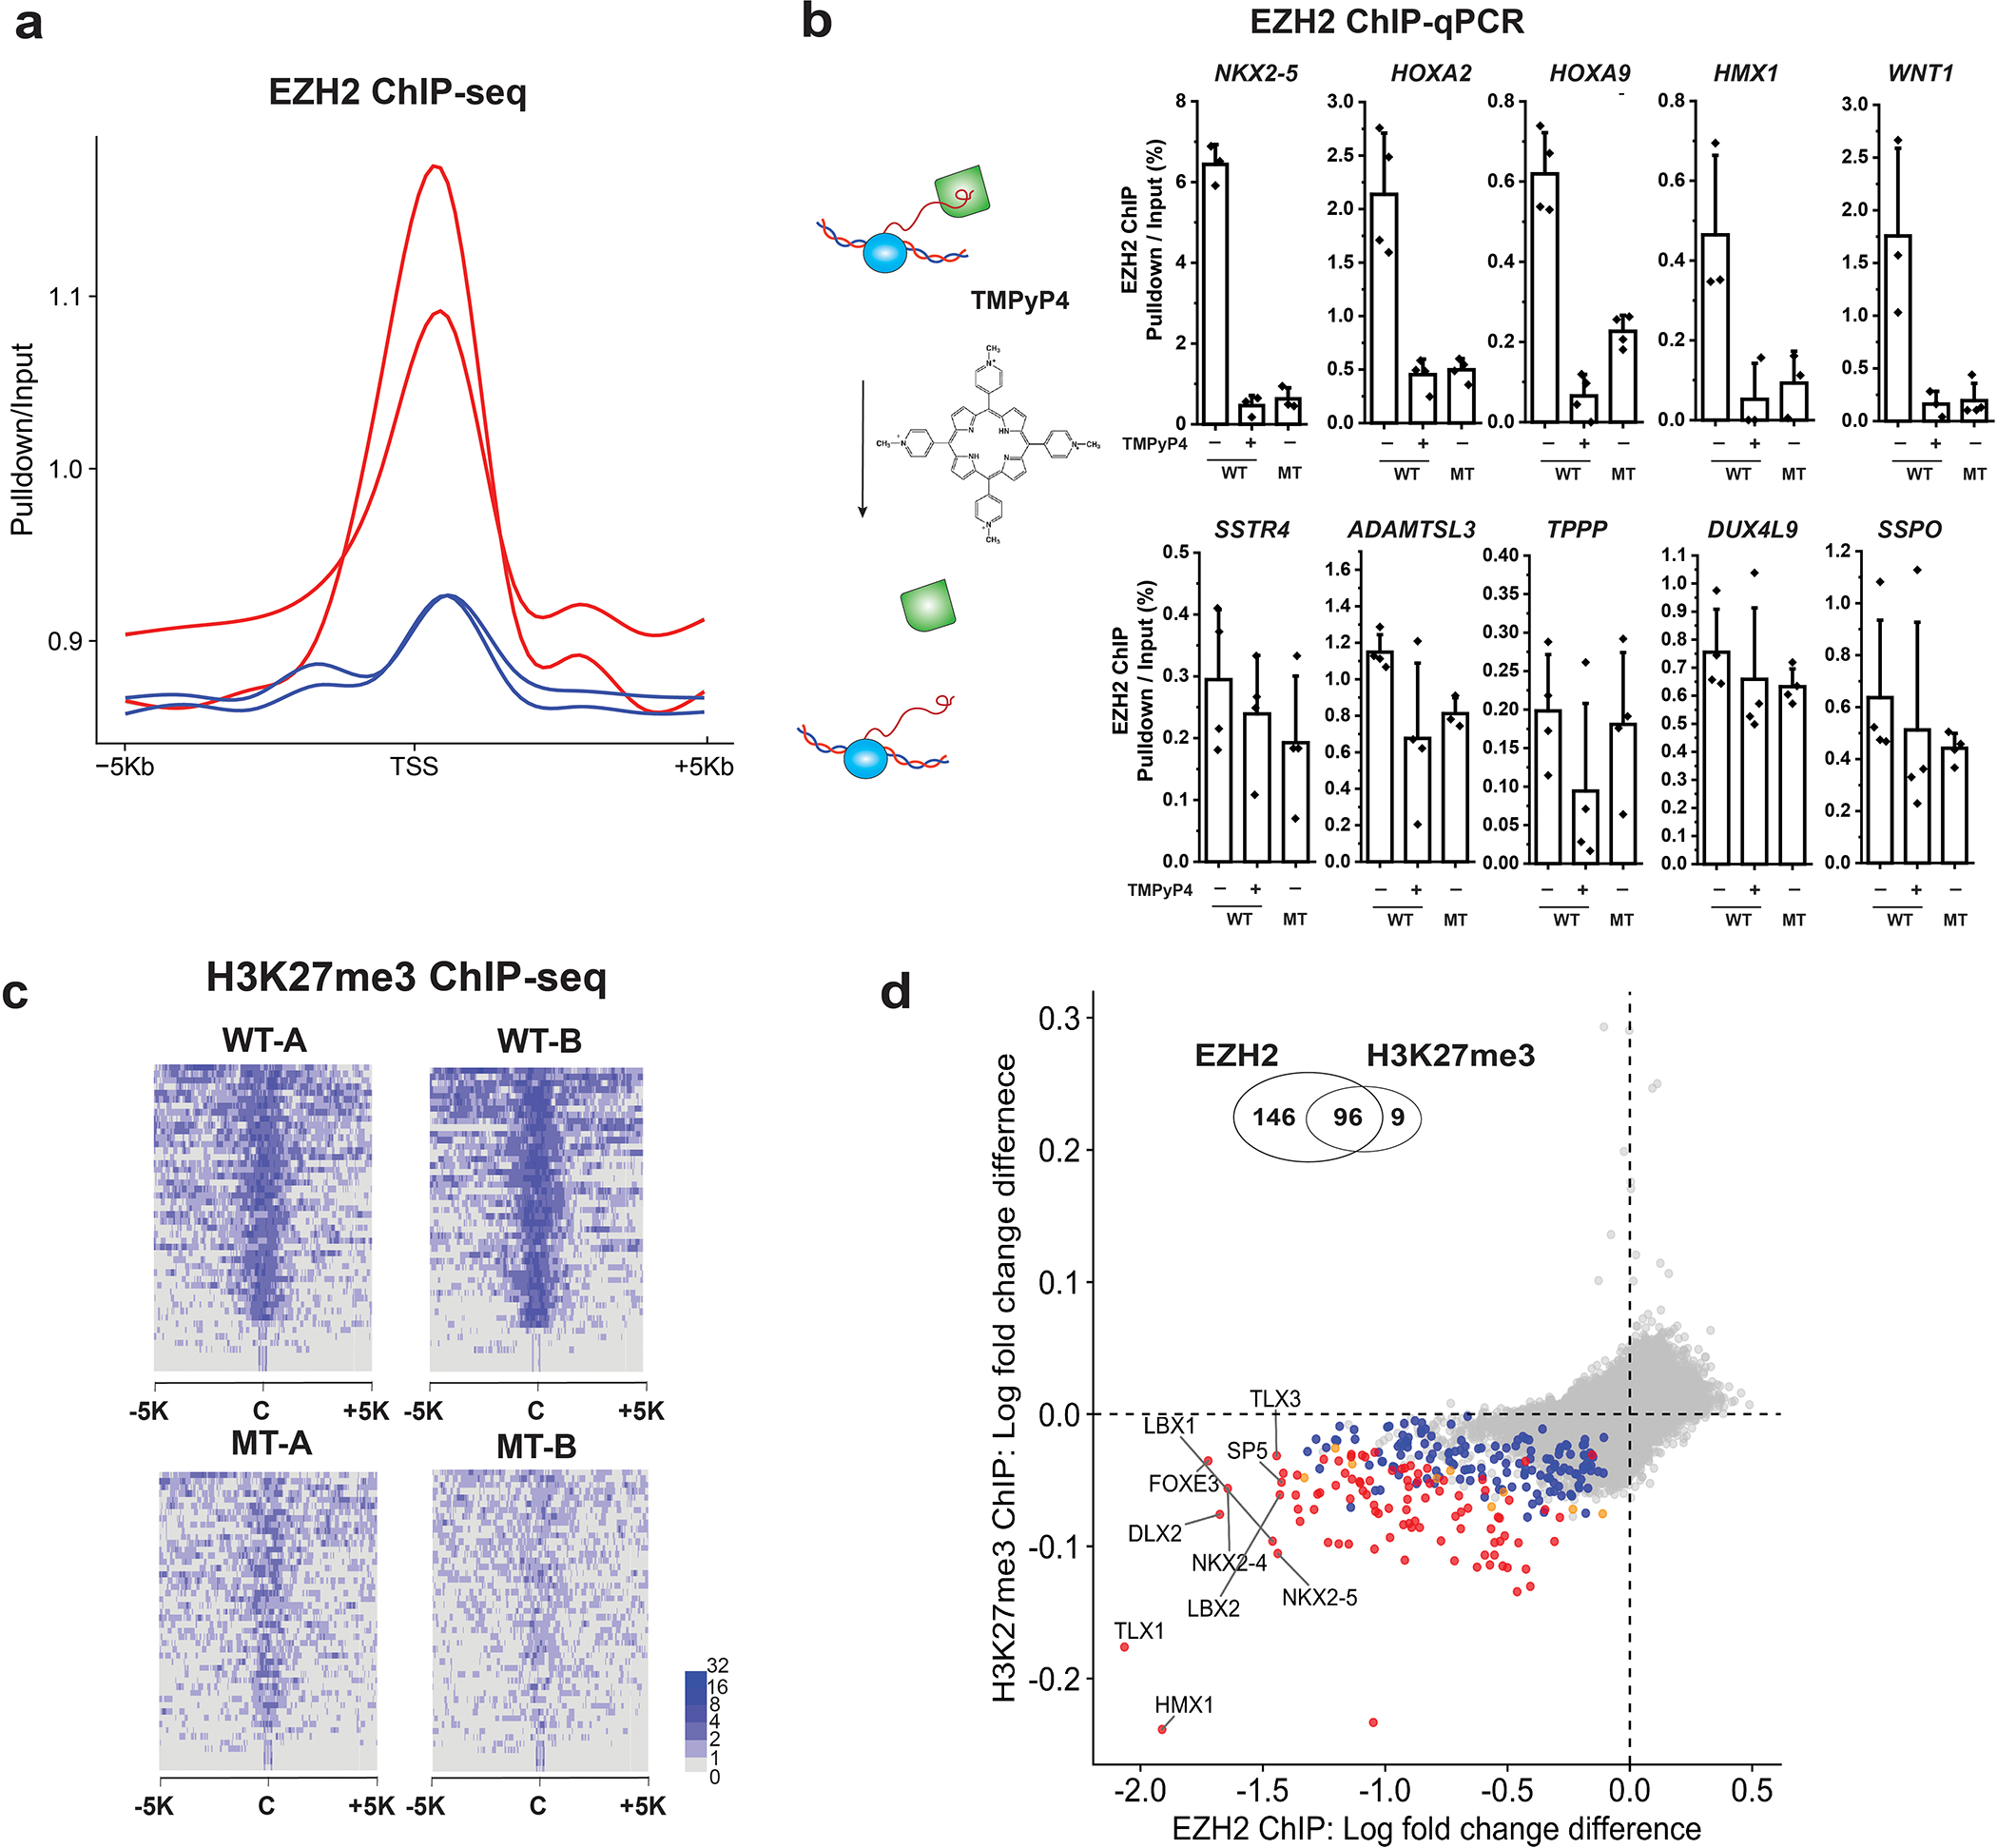
Many chromatin-binding proteins and protein complexes that regulate transcription also bind RNA. One of these, Polycomb repressive complex 2 (PRC2), deposits the H3K27me3 mark of facultative heterochromatin and is required for stem cell differentiation. PRC2 binds RNAs broadly in vivo and in vitro. Yet, the biological importance of this RNA binding remains unsettled. Here, we tackle this question in human induced pluripotent stem cells by using multiple complementary approaches. Perturbation of RNA-PRC2 interaction by RNase A, by a chemical inhibitor of transcription or by an RNA-binding-defective mutant all disrupted PRC2 chromatin occupancy and localization genome wide. The physiological relevance of PRC2-RNA interactions is further underscored by a cardiomyocyte differentiation defect upon genetic disruption. We conclude that PRC2 requires RNA binding for chromatin localization in human pluripotent stem cells and in turn for defining cellular state.


Conflict of interest statement

Competing interests

T.R.C. is on the Merck board and is a consultant for Storm Therapeutics.

Figures

Extended Data Fig. 1 |
Extended Data Fig. 1 |. rChiP-seq of TBP, Rpb1, eZH2 and suZ12 in human iPsCs.
a, Venn diagrams with number of identified peaks in EZH2 and SUZ12 ChIP-seq experiments in −RNase A and +RNase A samples. The numbers of peaks identified in either of two independent clones were merged and counted. b, Metaplot of fold change (pulldown/input) for TBP rChIP-seq in two WT clones (black: WT-A, blue: WT-B) at transcription start site (TSS) + /− 5 kb. c, Motif analysis of TBP ChIP-seq identified the A/T rich sequence of TBP binding sites. This motif (statistical significance quantified by E-value: 7.5*10−16) was found by using MEME (http://meme-suite.org/) with top 1000 peaks. d, Metaplot of Rpb1 ChIP-seq in two WT clones (black: WT-A, blue: WT-B) at transcription start site (TSS) + /− 5 kb. e, Metaplot of Rpb1 ChIP-seq in two WT clones (black: WT-A, blue: WT-B) around gene bodies [from TSS – 5 kb to transcription termination site (TTS) + 5 kb] of the genes with peaks. Every gene is length-normalized to have the same number of tiles. f–i, RNase A treatment (y-axis) was compared to control (x-axis) in terms of fold change (log scale) of genes in pulldown relative to input. Two independent clones in each condition (N = 4) were used for empirical Wald test (two-sided, see Methods). Each dot represents a gene. The red denotes the genes with significant fold changes [multiple test-corrected (FDR) p-value < 0.1] between the treatment and the control. Dashed lines, expectation for RNA-independent ChIP. j–m, heatmap comparison of minus and plus RNase A treatment in terms of fold changes in pulldown relative to input. These are the same analyses as in Fig. 1b–e but using an independent clone.
Extended Data Fig. 2 |
Extended Data Fig. 2 |. EZH2 ChiP with or without triptolide treatment of human iPsCs.
a, Heatmaps of EZH2 ChIP fold change (pulldown/input) without and with (columns) triptolide in two different iPSC clones (rows). Each row describes a region of 5 kb upstream and downstream from the center of a single ChIP-seq peak. b, Triptolide treatment (y-axis) was compared to wild-type/untreated control (x-axis) in terms of fold change (log scale) of genes in pulldown relative to input. Two independent clones in each condition (N = 4) were used for empirical Wald tests (two-sided, see Methods). Each dot represents a gene. The red denotes the genes with significant fold changes [FDR-adjusted p-value < 0.1] between the treatment and the wild-type control. Diagonal dashed line is the expectation for triptolide-independent EZH2 binding to chromatin. c, EZH2 ChIP-qPCR results of three PRC2 target genes upon triptolide treatment. WT and MT (RNA binding mutant) are the two CRISPR-engineered iPSC strains presented in Fig. 2. The bar represents mean value and error bar represents the standard deviation of four biological replicates (two clones, each in two independent experiments). d, Distribution of EZH2 ChIP enrichment (log2(IP/input)) at four groups of genes. These four groups are divided based on their EZH2 ChIP enrichment in control samples (WT) as evaluated by empirical Wald tests (two-sided, see Methods): Non-target group consists of the depleted genes in WT EZH2 ChIP, based on FDR-adjusted p-value<0.05 and fold change of pulldown/input<1 (N = 1139); Weak target group consists of the enriched genes in WT EZH2 ChIP, based on multiple-test corrected (FDR) p-value<0.05 and 1 < = fold change of pulldown/input <2 (N = 3183); Strong target group consists of the enriched genes in IP relative to Input based on FDR-adjusted p-value<0.05 and fold change of pulldown/input > =2 (N = 285); all the other genes comprise background group (N = 31504). e, Fold change of EZH2 occupancy (triptolide divided by WT/untreated control) at individual genes. The distribution is described by a typical box plot: the box represents the first and third quartiles of percentage distribution with the horizontal line showing the median, and whiskers indicate 10th and 90th percentiles. All comparisons against background are statistically significant by Wilcoxon rank sum test (*** indicates p < 10−15 in two-sided test). The number of genes in statistical tests is same as in d.
Extended Data Fig. 3 |
Extended Data Fig. 3 |. Characterization of a separation-of-function human PRC2 mutant that is specifically defective in RNA interaction.
a, (Left) The mutant contains mutations at two sites of the EZH2 subunit, indicated with stars on the cryo-EM structure of PRC2 (PDB 6c23). Dashed red line, flexible loop. (Right) Table of all tested functions of PRC2. Green check mark, no substantial change compared to wild type (WT); red cross, substantial defect for the mutant. b, Coomassie-stained SDS-PAGE gel of recombinant 5-mer PRC2 WT and MT as used for following biochemical experiments. (cf) WT in red and MT (mutant) in blue for all curves. For all binding curves, center of the dot represents mean value and the error bar represents the standard deviation of three independent experiments. c, Equilibrium binding of PRC2 to a G-quadruplex 40-mer RNA (GGAA)10 was measured using Electrophoretic Mobility Shift Assay (EMSA). Kdapp values of WT and MT: 2 and 12 nM, p-value = 0.0007, calculated by Student’s T-test with two-tailed distribution and two-sample equal variance). First lane of gel is RNA only, no protein. Subsequent lanes have successive three-fold dilutions of PRC2 from 5 μM. d, (left) Kinetic dissociation of PRC2-(GGAA)10 RNA complex was measured using fluorescence anisotropy, with unlabeled (GGAA)10 RNA added at time 0 to trap dissociated PRC2. Dissociation rate constants (koff) for 4 m and 5 m complexes are indicated and the dissociation curves for 4 m are shown. (right) Kinetic dissociation of PRC2-(CG)30 dsDNA. e, PRC2-DNA binding was tested using EMSA on a TERT promoter DNA (48 bp) with either unmethylated (left) or methylated (right) CpG dinucleotides. f, Binding of PRC2 to mono-nucleosomes (left) or tri-nucleosomes (right) was measured using EMSA. g, Methyltransferase activities of 4 m PRC2 complexes were measured on either histone H3, the entire histone octamer, reconstituted mononucleosomes or native polynucleosomes (Amsbio 52015). Automethylation of EZH2 also quantified. For all assays, center of the dot represents mean value and error bars give standard derivation of three independent experiments.
Extended Data Fig. 4 |
Extended Data Fig. 4 |. In vivo binding defect of the MT eZH2 exhibited by fRiP-seq.
fRIP experiment was used to examine the RNAs associated with PRC2. EZH2 MT (y-axis) was compared to EZH2 WT control (x-axis) for RNAs in terms of enrichment score defined as fold change (log scale) of pulldown relative to input divided by standard deviation. Two independent clones were used in each genotype to calculate enrichment scores for individual genes. Each dot represents the RNA product of a gene. The significantly enriched genes in WT, determined by empirical Wald tests with two independent clones (N = 2, multiple test-corrected (FDR) p-value<0.05, see Methods) and denoted by red, are located off the dashed 45-degree line that indicates the expectation if the MT EZH2 had no effect on RNA pulldown.
Extended Data Fig. 5 |
Extended Data Fig. 5 |. Introduction of the separation-of-function RNA mutant did not change the undifferentiated state of the iPsCs.
a, (Left) Schematic representation of the CRISPR genome editing to construct the WT and MT iPSC strains. Locations of the primer binding sites are shown for the four primers that are used in the PCR validation. (Right) Validation of the correct integration of the donor DNA at the CRISPR guide RNA cleavage site by PCR on genomic DNA. Two clones of each strain were validated, and the expected PCR amplicon sizes of edited and unedited allele are shown in the table below the gels. Data indicate absence of unedited alleles for all WT and MT clones. DNA ladders are labeled in base pairs on the side of the image. b, Appearance of the stem cell colonies under bright field microscope. White scale bar represents 1000 μm. c, Karyotyping of two clones of each edited strain; no abnormality of the 23 pairs was observed. d, Immunofluorescence results of the CRISPR-edited clones to evaluate expression of pluripotency markers (SOX2, OCT4 and SSEA4) and EZH2. e, Zoomed-in image of d comparing subcellular localization of EZH2 in WT and MT clones. f, EZH2 co-immunoprecipitation (co-IP) experiment in each of the two clones of the WT and MT iPSCs. Western blot for EZH2, SUZ12, EED, RBBP4, JARID2 and MTF2 are shown. Note that the IgG control pulldown doesn’t precipitate any of the PRC2 subunits, and the IgG bands in these blots are lighted by the secondary antibody (anti-mouse IgG HRP).
Extended Data Fig. 6 |
Extended Data Fig. 6 |. ChiP-seq of eZH2 and H3K27me3 in WT iPsCs.
a, Comparison of the EZH2 ChIP (x-axis) and H3K27me3 ChIP (y-axis) in the WT iPSCs. Log2 fold changes of IP relative to input are compared for every gene with two independent clones in each ChIP-seq. Colors indicate the statistical significance determined by empirical Wald tests [multiple test-corrected (FDR) p-value<0.05 in two-sided] of log2 fold change. The number of these genes are 3231 (blue: EZH2 only), 17 (orange: H3K27me3 only), 237 (red: both) and 33920 (gray: no significance). Venn diagram is shown on the top of scatter plot. Significant association of enriched genes between EZH2 ChIP and H3K27me3 ChIP was found (Fisher-exact test, p-value < 10−15). b, An example of a red dot gene in a (note that the EZH2 and H3K27me3 peaks correlate very well). c, Two examples of blue dot genes in a (note that there are no significant H3K27me3 peaks in the region).
Extended Data Fig. 7 |
Extended Data Fig. 7 |. Comparison of ChiP-seq between eZH2 WT and MT, and validation of G4 RNA-PRC2 binding using TMPyP4.
a, Fold changes of EZH2 ChIP-seq in two WT clones (red) and two MT clones (blue) at transcription start site (TSS) + /− 5 kb. b, TMPyP4 treatment phenocopies the RNA-binding defective EZH2 mutant. EZH2 ChIP-qPCR results of WT, WT with TMPyP4 treatment, and MT. Enrichment percentage (pulldown/input) plotted as the Y-axis. Five genes that had significant change of EZH2 occupancy with the mutant EZH2 are shown in the top panels, and the insignificantly changed genes are shown in the lower panels. Each point represents a replicate (N = 3 or 4 biological independent samples). The bar represents mean value and the error bars show standard deviation. c, Fold change of H3K27me3 ChIP-seq. In a heatmap, each row describes a region of 5 kb upstream and downstream from the center of a single peak. d, Comparison of the differential enrichment between WT and MT between EZH2 ChIP (x-axis) and H3K27me3 ChIP (y-axis). The differential enrichment was quantified by subtraction of log2 fold change in WT from log2 fold change in MT. Colors indicate the statistical significance [multiple test corrected (FDR) p-value<0.1 in two-sided empirical Wald test, see Methods] of differential enrichment. The number of these genes are 146 (blue: EHZ2 only), 9 (orange: H3K27me3 only), 96 (red: both) and 36946 (gray: no significance). Venn diagram is shown on the top of scatter plot. Significant overlap of differential genes was found between EZH2 ChIP and H3K27me3 ChIP (Fisher-exact test, p-value < 10−15).
Extended Data Fig. 8 |
Extended Data Fig. 8 |. Genome-wide gene expression changes in iPsCs caused by disruption of PRC2-RNA interaction.
a, Global gene expression change in MT relative to WT by RNA-seq. Two independent clones generating two sequencing libraries each in both WT and MT (N = 8) were used for statistical significance (two-sided Wald tests, see Methods). Each dot represents a gene where x-value is Transcripts Per Million (TPM) mean value of WT and y-value is TPM mean value of MT. Color indicates three groups of genes in comparison of mean TPM between WT and MT: gray, insignificant [multiple test-corrected (FDR) p-value > =0.05]; orange, significant (FDR-adjusted p-value<0.05) and log2(FC) < 1; red, significant (FDR-adjusted p-value<0.05) and log2(FC) > = 1, where FC (fold change) is ratio of MT to WT in normalized read counts. b, Comparison of cumulative distribution of gene expression between the two groups of genes (N is the number of genes): red, significantly perturbed genes in both EZH2 and H3K27me3 ChIP-seq (N = 51); grey, all other genes (N = 21842). The curve shifted to right (red relative to gray) indicates higher overall x-values (expression increase in MT compared to WT): p-value=0.0003714 by two-sample Kolmogorov-Smirnov test (two-sided, D = 0.29056). c, GSEA top 10 significant gene sets for differential gene expression. All of these gene sets had higher expression in MT relative to WT (Supplementary Table 2). Blue texts indicate heart-related terms. d, An example of significant term from c related to heart development: in the top panel, vertical bar with gene name indicates the location of genes in this term on the ranked score of differential expression from down-regulation to up-regulation in MT. The two regions are marked by colors for visualization indicating lower (blue) and upper (red) intervals of differential gene expression statistic/score for gene set enrichment analysis. Default values in R package limma are used for the two cut-offs. The bottom panel shows the updates of enrichment score (y-axis) along the ranked differential score (horizontal bar) in GSEA method. Differential score for a gene is a statistic calculated by DESeq2 for differential gene expression (see method).
Extended Data Fig. 9 |
Extended Data Fig. 9 |. Immunofluorescence staining of neuronal progenitor cell (NPC) markers (Nestin, sOX1 and PAX6) in iPsC-derived NPCs.
a, day 11 NPCs were stained with Nestin (green) and SOX1 (red). b, day 8 NPCs were stained with PAX6 (green) and OCT4 (red). OCT4 is a pluripotency marker while PAX6, Nestin and SOX1 are all NPC markers. Scale bars represent 15 μm.
Extended Data Fig. 10 |
Extended Data Fig. 10 |. Molecular details of the cardiomyocyte differentiation defect.
a, Western blot (cropped) shows expression levels of the transfected WT or mutant FLAG-tagged EZH2 in the rescue experiment. b, Molecular response in the rescue experiment. qRT-PCR experiments were used to compare expression of two cardiac genes (TNNT2 and MYH6) and one control gene (SOX2) in each clone rescued with each WT or MT EZH2. Three biological replicates are represented with dots. The bar represents mean value and error bar represents standard deviation. Expressions were normalized to GAPDH level. P-values calculated in Student’s T-test with two-tailed distribution and two-sample equal variance are shown on top of each bar plot. c, RNA-seq results of WT and MT strains at day 8 of differentiation. Sample size (N = 12), statistical test and color legends are exactly the same as described in Fig. 3g. d, GSEA analysis of significantly differentially-expressed genes between WT and MT in RNA-seq. e, Mean differential expression (MT/WT, expression quantified by RNA-seq) was compared across three time points [day 0 (undifferentiated), day 8 and day 12 of differentiation] for the 18 genes among the 96 genes that have significant changes in both EZH2 and H3K27me3 ChIP-seqs between WT and MT (genes denoted by red in the Extended Data Fig. 7d). These 18 genes were selected as they have significant changes in gene expression between WT and MT at any time points. Time points at which a gene is significantly differentially expressed are shown as larger triangles. f, The distribution of the 96 genes that have significant changes in both EZH2 and H3K27me3 occupancies (measured by ChIP-seq) between WT and MT (the genes denoted by red in the Extended Data Fig. 8e) in terms of mean differential expression (MT/WT, expression quantified by RNA-seq) across three differentiation time points. The distribution is described by a typical box plot: the box represents the second and third quartiles with the horizontal line showing the median, and whiskers indicate 10th and 90th percentiles (the number of detected genes, N = 51, 65, and 63 for day 0, day 8, and day 12, respectively). g, Expression levels (Mean TPM with standard error, N = 3 biological replicates for each bar) of transcription factors HMX1 and NKX2–5 at day 0, 8 and 12 of differentiation determined by RNA-seq analysis.
Fig. 1 |
Fig. 1 |. RNA is essential for PRC2 chromatin occupancy.
a, Schematic design of the RNA-dependent ChIP (rChIP) experiment. RNase A is added (+RNase A) or omitted (−RNase A) at the immunoprecipitation step of the regular ChIP procedure. If a protein–chromatin interaction is dependent on RNA, RNase A treatment would degrade the RNA linkage (red strand) and release the protein (green square) from chromatin. In contrast, if the interaction is independent of RNA, RNase A would have no effect on the protein’s chromatin occupancy. be, Heat maps of rChIP–seq experiments for EZH2 (b), SUZ12 (c), Rpb1 (d) and TBP (e) in human iPSCs. The scale below indicates the peak center (C) and the 5 kilobases (5 K) upstream and downstream genomic regions. Intensity of the color in the heat maps represents the enrichment fold change (pulldown/input). f, Representative genomic tracks of rChIP–seq experiments. HOXB3 gene locus is shown for EZH2 and SUZ12 rChIP–seq, while c-Myc gene is shown for Rpb1 and TBP rChIP–seq. The y axis represents the enrichment fold change (pulldown/input). −RNase in blue, +RNase in red. g, Gene scatter plot for the TBP (gray) and EZH2 (red) rChIP–seq. Both x and y axes are plotted as log2(pulldown/input) of normalized counts using two independent clones in each condition (N = 4, see Methods). Top ten enriched genes in EZH2 ChIP–seq (−RNase A) are labeled. Chr, chromosome.
Fig. 2 |
Fig. 2 |. Disruption of PRC2–RNA interaction in iPsCs leads to loss of eZH2 occupancy and H3K27me3 level on PRC2-repressed genes.
a, Schematic representations of constructing WT and MT EZH2 iPSC cell lines using CRISPR–Cas9. b, Western blot analysis of EZH2 expression and global H3K27me3 levels (cropped). β-actin loading controls are shown. Cell lysates were titrated twofold three times. Numbers below EZH2 and H3K27me3 blots are expression levels based on the intensity of the middle titration normalized to that of β-actin. c, Co-IP experiment in the WT and MT iPSCs. Wedges above lanes, twofold dilutions of cell lysate or EZH2 pulldown samples. Cropped western blots for six subunits are shown. IgG controls shown in Extended Data Fig. 5f. d, Heat maps of ChIP–seq experiments for WT and MT iPSCs. Scale below indicates the peak center (C) and 5 kb upstream and downstream genomic regions. Color intensity in heat maps represents the enrichment fold change (pulldown/input). e, EZH2 and H3K27me3 ChIP fold-change profile of NKX2–5. The y axis represents the enrichment fold change. f,g, Genome-wide localization of EZH2 (f) and H3K27me3 (g) in WT and MT iPSCs determined by ChIP–seq. Two independent clones of each genotype were compared (N = 4) by empirical Wald tests for individual genes (two-sided, see Methods). Each dot represents a gene showing the fold changes of pulldown to input in WT (x axis) and MT (y axis). Color indicates two groups of genes based on enrichment between WT and MT: gray, insignificant (multiple test-corrected (FDR) P ≥ 0.05); red, significant (FDR-adjusted P < 0.05). Dashed line of slope value = 1 would indicate no difference between WT and MT, while the solid line represents the regression (trend) generated by a generalized additive model. sgRNA, single guide RNA.
Fig. 3 |
Fig. 3 |. PRC2–RNA interaction is essential for cardiomyocyte differentiation.
WT and MT iPSCs were differentiated into cardiomyocytes. a, Heat map depicting the time-averaged magnitude of cardiomyocyte contraction; five representative images of each clone at day 11 (red to blue, motion high to none). b, Quantification of the fraction of spontaneously beating areas at day 11. Each dot represents a time-lapse image recorded for 30 s, and images from three independent differentiation experiments are plotted. Dashed lines represent the mean values. c, Percentages of cells with positive cTnT expression quantified using flow cytometry; n = 3 biologically independent differentiation experiments, bars represent mean values and error bars represent standard deviations. d, Expression of sarcomeric α-actinin and transcription factor SIX1 at day 12 of differentiation, evaluated using immunofluorescence. e, Heat map of spontaneous contraction in the EZH2 rescue experiment at day 11. f, Quantification of the contracting areas and cTnT flow cytometry results in three biological replicates of the EZH2 rescue experiment. Bars represent mean values and error bars show the standard deviation of three biological repeats. g, RNA-seq results of WT and MT at day 12 of differentiation. Two independent clones of WT and MT each with three biological replicates (N = 12) were used for statistical significance (two-sided Wald test, see Methods). Color indicates three groups of genes based on mean TPM comparison between WT and MT: gray, insignificant (multiple test-corrected (FDR) P ≥ 0.05); orange, significant (FDR-adjusted P < 0.05) and log2(FC) < 1; red, significant (FDR-adjusted P < 0.05) and log2(FC) ≥ 1, where FC (fold change) is ratio of MT to WT in normalized read counts. h, Expression profiles of four representative cardiac genes at day 12 of differentiation: TNNT2 (encodes cTnT), NKX2–5, TTN, ACTN2 (encodes sarcomeric α-actinin). Error bars represent the standard deviation of two clones, each with three independent differentiation experiments (N = 6). P values presented in b, c, f and h were calculated by two-sided t-test (equal variance). N/A, not applicable.
Fig. 4 |
Fig. 4 |. A molecular scheme of RNA regulation of PRC2 activity.
Center, interactions between PRC2 and chromatin are frequently bridged by RNA (red). At this state, PRC2 is not directly bound to chromatin, and its catalytic activity is temporarily inhibited. This poised and in check state allows PRC2 to scan the chromatin context (for example, pre-existing H3K27me3) of nearby chromatin regions. Top left, multiple RNA interactions may hold several distant chromatin regions together to form long-range chromatin interactions, and potentially Polycomb bodies. Bottom left, PRC2 may dissociate from RNA and become engaged with chromatin, and PRC2 detects its allosteric activator H3K27me3. Conversely, when H3K27me3 is missing, PRC2 may be evicted from chromatin by RNA. Bottom right, PRC2–chromatin interaction may also be initiated by interaction with PRC2 accessory proteins, which are frequently DNA-binding proteins. Top right, at active gene loci which are rapidly transcribed, release of RNA could further evict and release PRC2 from chromatin.

Comment in

  • RNA closing the Polycomb circle.
    Mocavini I, Di Croce L. Mocavini I, et al. Nat Genet. 2020 Sep;52(9):866-867. doi: 10.1038/s41588-020-0683-5. Nat Genet. 2020. PMID: 32879510 No abstract available.

References

    1. Hudson WH & Ortlund EA The structure, function and evolution of proteins that bind DNA and RNA. Nat. Rev. Mol. Cell Biol. 15, 749–760 (2014). - PMC - PubMed
    1. Hendrickson DG, Kelley DR, Tenen D, Bernstein B & Rinn JL Widespread RNA binding by chromatin-associated proteins. Genome Biol. 17, 28 (2016). - PMC - PubMed
    1. Long Y, Wang X, Youmans DT & Cech TR How do lncRNAs regulate transcription? Sci. Adv. 3, eaao2110 (2017). - PMC - PubMed
    1. Khalil AM et al. Many human large intergenic noncoding RNAs associate with chromatin-modifying complexes and affect gene expression. Proc. Natl Acad. Sci. USA 106, 11667–11672 (2009). - PMC - PubMed
    1. Cao R et al. Role of histone H3 lysine 27 methylation in polycomb-group silencing. Science 298, 1039–1043 (2002). - PubMed

Publication types