

5-Year prognostic value of the right ventricular strain-area loop in patients with pulmonary hypertension
- PMID: 32632438
- PMCID: PMC7822639
- DOI: 10.1093/ehjci/jeaa143
5-Year prognostic value of the right ventricular strain-area loop in patients with pulmonary hypertension
Abstract
Aims: Patients with pre-capillary pulmonary hypertension (PH) show poor survival, often related to right ventricular (RV) dysfunction. In this study, we assessed the 5-year prognostic value of a novel echocardiographic measure that examines RV function through the temporal relation between RV strain (ϵ) and area (i.e. RV ϵ-area loop) for all-cause mortality in PH patients.
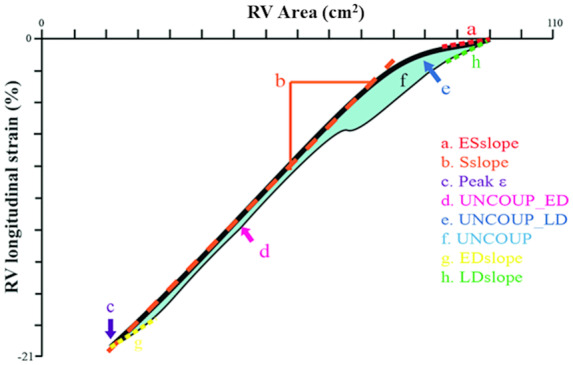
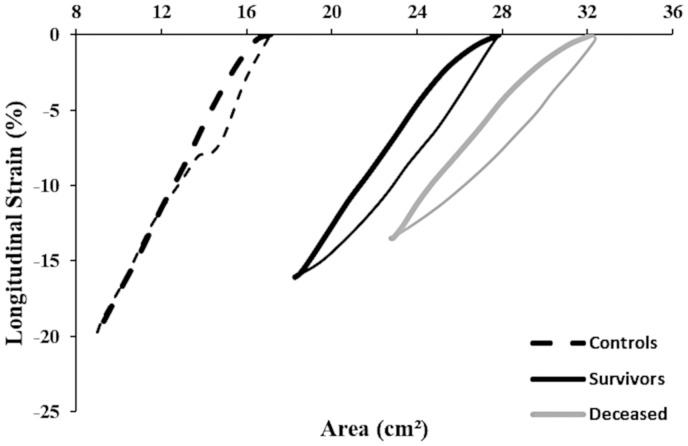
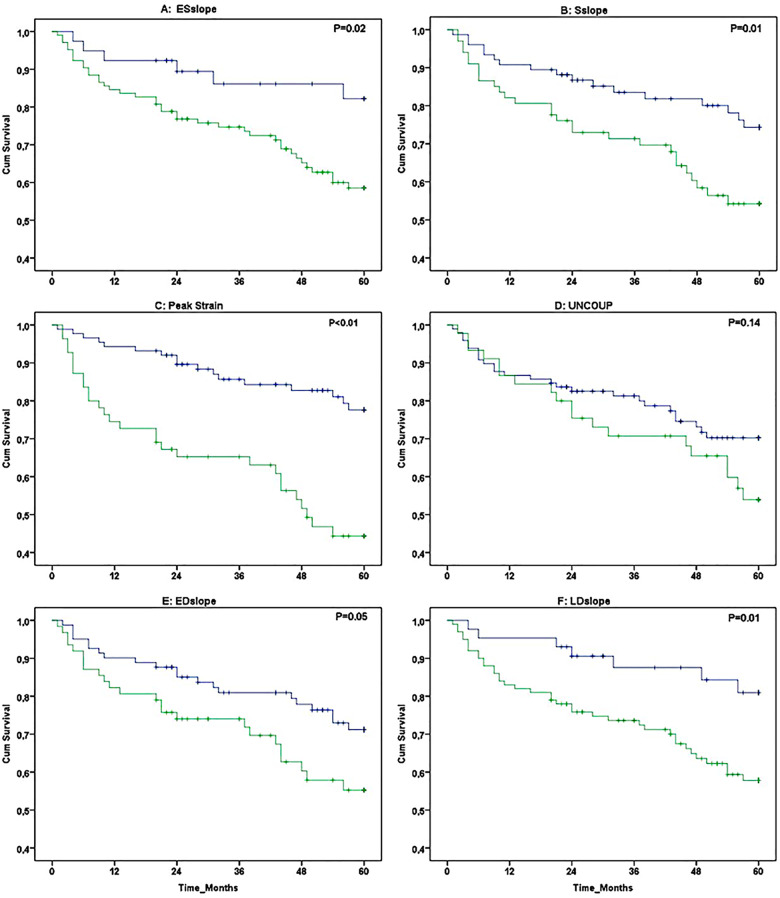
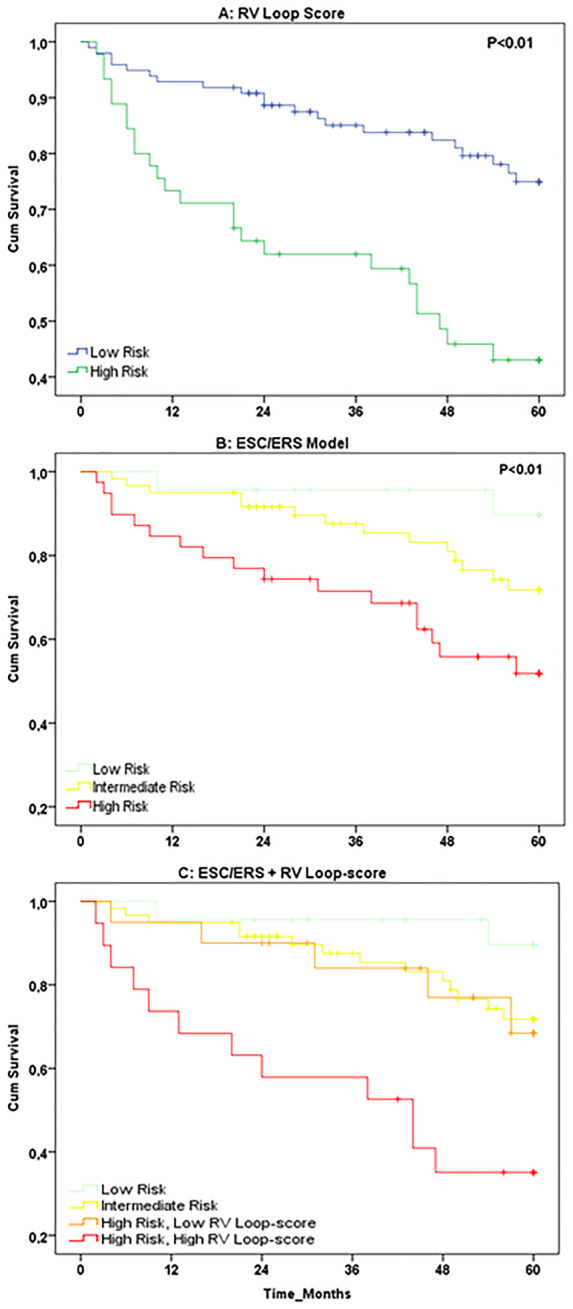
Methods and results: Echocardiographic assessments were performed in 143 PH patients (confirmed by right heart catheterization). Transthoracic echocardiography was utilized to assess RV ϵ-area loop. Using receiver operating characteristic curve-derived cut-off values, we stratified patients in low- vs. high-risk groups for all-cause mortality. Kaplan-Meier survival curves and uni-/multivariable cox-regression models were used to assess RV ϵ-area loop's prognostic value (independent of established predictors: age, sex, N-terminal pro B-type natriuretic peptide, 6-min walking distance). During follow-up 45 (31%) patients died, who demonstrated lower systolic slope, peak ϵ, and late diastolic slope (all P < 0.05) at baseline. Univariate cox-regression analyses identified early systolic slope, systolic slope, peak ϵ, early diastolic uncoupling, and early/late diastolic slope to predict all-cause mortality (all P < 0.05), whilst peak ϵ possessed independent prognostic value (P < 0.05). High RV loop-score (i.e. based on number of abnormal characteristics) showed poorer survival compared to low RV loop-score (Kaplan-Meier: P < 0.01). RV loop-score improved risk stratification in high-risk patients when added to established predictors.
Conclusion: Our data demonstrate the potential for RV ϵ-area loops to independently predict all-cause mortality in patients with pre-capillary PH. The non-invasive nature and simplicity of measuring the RV ϵ-area loop, support the potential clinical relevance of (repeated) echocardiography assessment of PH patients.
Keywords: echocardiography; prognostic value; pulmonary hypertension; right ventricular function; ultrasound.
© The Author(s) 2020. Published by Oxford University Press on behalf of the European Society of Cardiology.
Figures
References
-
- Gall H, Felix JF, Schneck FK, Milger K, Sommer N, Voswinckel R. et al. The Giessen Pulmonary Hypertension Registry: survival in pulmonary hypertension subgroups. J Heart Lung Transplant 2017;36:957–67. - PubMed
-
- Voelkel NF, Quaife RA, Leinwand LA, Barst RJ, McGoon MD, Meldrum DR. et al. Right ventricular function and failure: report of a National Heart, Lung, and Blood Institute working group on cellular and molecular mechanisms of right heart failure. Circulation 2006;114:1883–91. - PubMed
-
- Galie N, Humbert M, Vachiery JL, Gibbs S, Lang I, Torbicki A. et al. 2015 ESC/ERS Guidelines for the diagnosis and treatment of pulmonary hypertension: the Joint Task Force for the Diagnosis and Treatment of Pulmonary Hypertension of the European Society of Cardiology (ESC) and the European Respiratory Society (ERS): endorsed by: association for European Paediatric and Congenital Cardiology (AEPC), International Society for Heart and Lung Transplantation (ISHLT). Eur Heart J 2016;37:67–119. - PubMed
-
- Hulshof HG, Eijsvogels TMH, Kleinnibbelink G, van Dijk Ap, George Kp, Oxborough Dl. et al. Prognostic value of right ventricular longitudinal strain in patients with pulmonary hypertension: a systematic review and meta-analysis. Eur Heart J Cardiovasc Imaging 2019;32:475–484 - PubMed
MeSH terms
LinkOut - more resources
Full Text Sources
Medical
