. 2020 Sep;63(9):1718-1735.
doi: 10.1007/s00125-020-05199-0. Epub 2020 Jul 6.

A systematic review of trends in all-cause mortality among people with diabetes

Affiliations

A systematic review of trends in all-cause mortality among people with diabetes

Lei Chen et al. Diabetologia. 2020 Sep.

Abstract

Aims/hypothesis: We examined all-cause mortality trends in people with diabetes and compared them with trends among people without diabetes.

Methods: MEDLINE, EMBASE and CINAHL databases were searched for observational studies published from 1980 to 2019 reporting all-cause mortality rates across ≥2 time periods in people with diabetes. Mortality trends were examined by ethnicity, age and sex within comparable calendar periods.

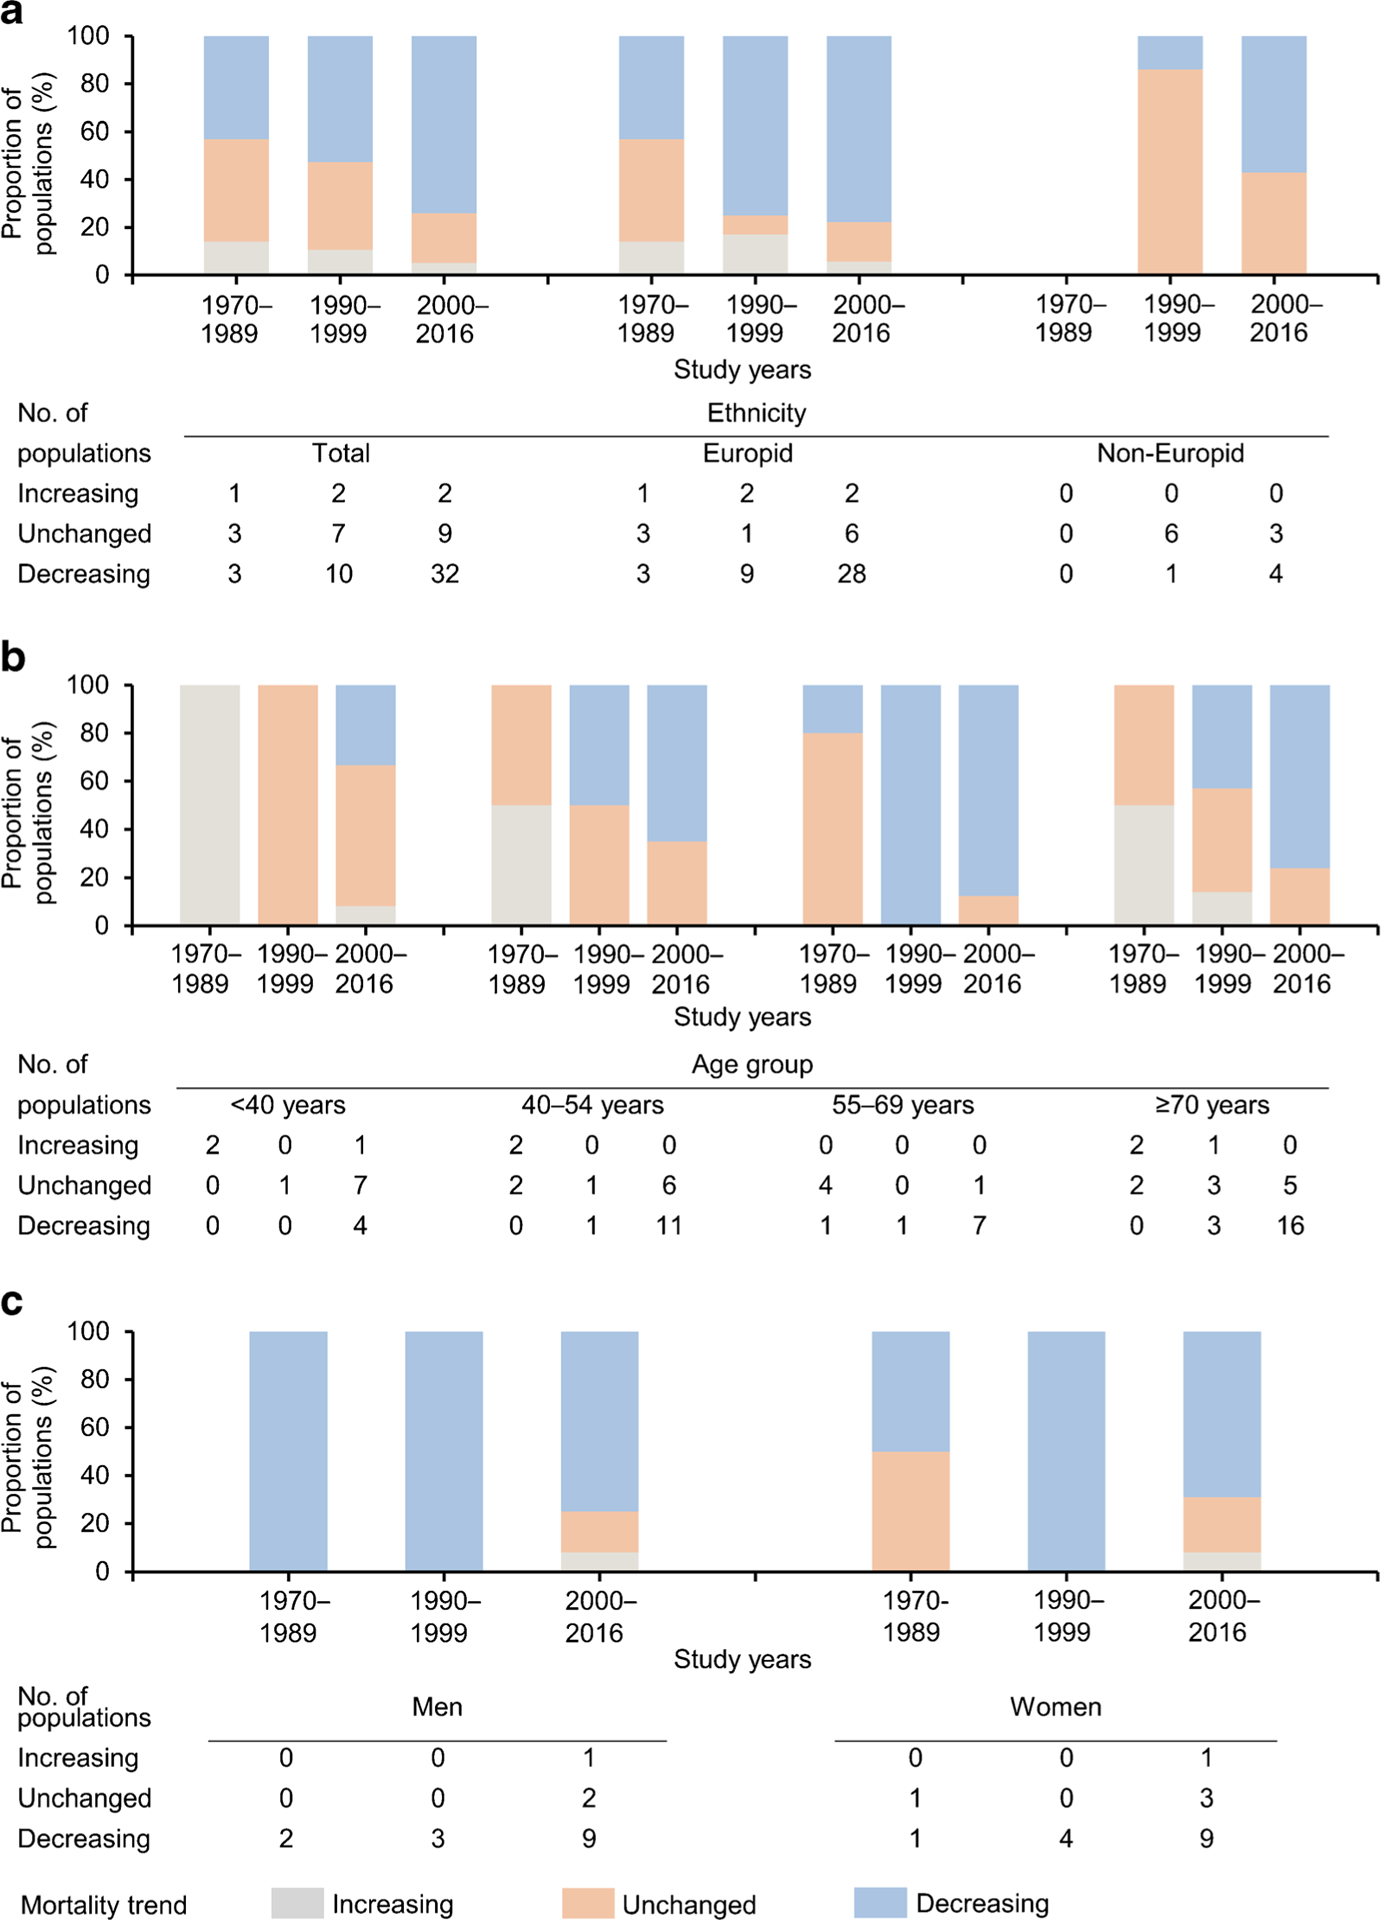
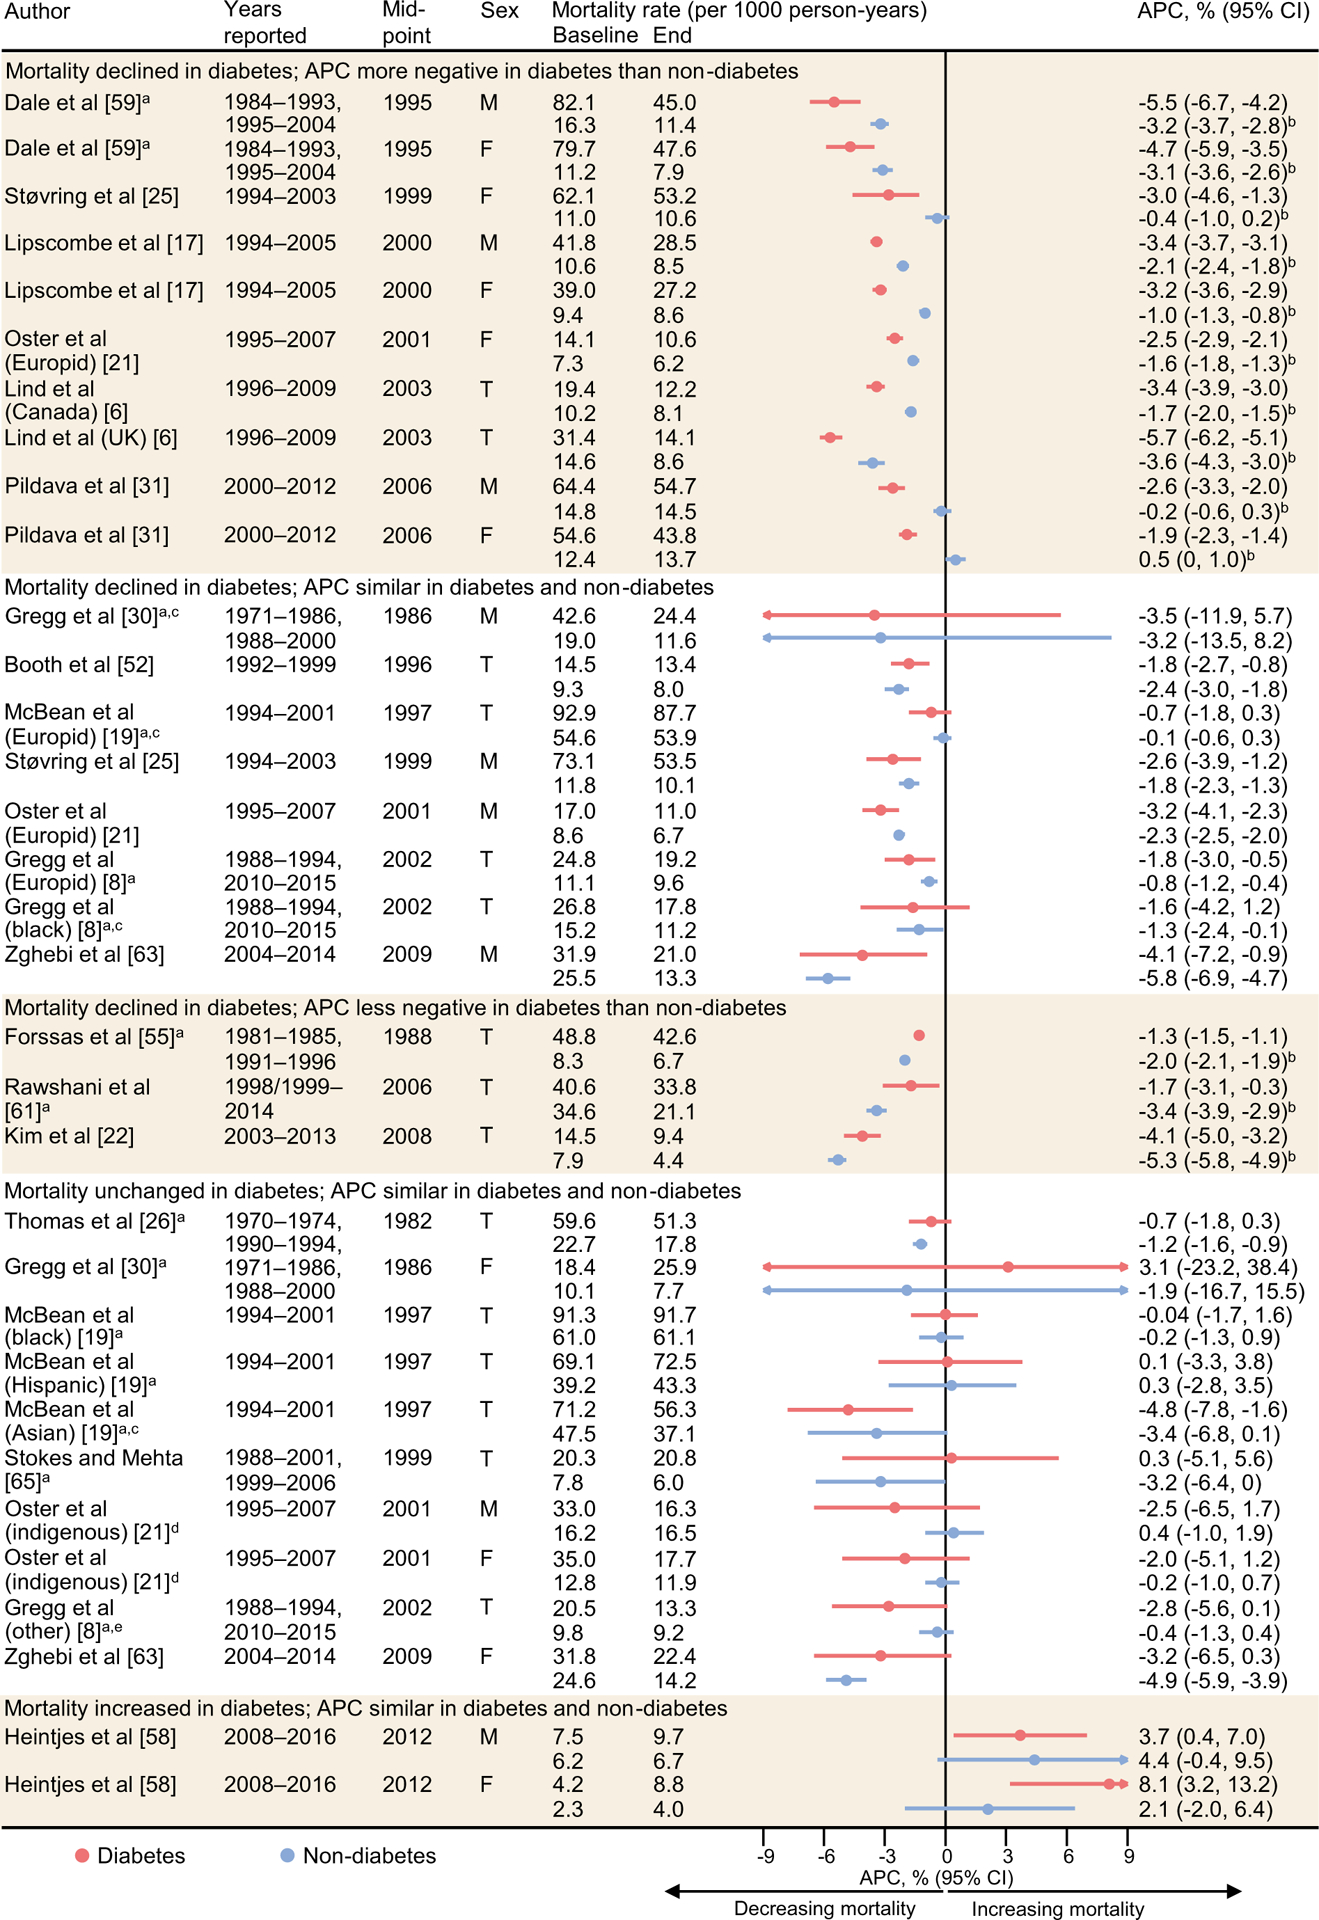
Results: Of 30,295 abstracts screened, 35 studies were included, providing data on 69 separate ethnic-specific or sex-specific populations with diabetes since 1970. Overall, 43% (3/7), 53% (10/19) and 74% (32/43) of the populations studied had decreasing trends in all-cause mortality rates in people with diabetes in 1970-1989, 1990-1999 and 2000-2016, respectively. In 1990-1999 and 2000-2016, mortality rates declined in 75% (9/12) and 78% (28/36) of predominantly Europid populations, and in 14% (1/7) and 57% (4/7) of non-Europid populations, respectively. In 2000-2016, mortality rates declined in 33% (4/12), 65% (11/17), 88% (7/8) and 76% (16/21) of populations aged <40, 40-54, 55-69 and ≥70 years, respectively. Among the 33 populations with separate mortality data for those with and without diabetes, 60% (6/10) of the populations with diabetes in 1990-1999 and 58% (11/19) in 2000-2016 had an annual reduction in mortality rates that was similar to or greater than in those without diabetes.

Conclusions/interpretation: All-cause mortality has declined in the majority of predominantly Europid populations with diabetes since 2000, and the magnitude of annual mortality reduction matched or exceeded that observed in people without diabetes in nearly 60% of populations. Patterns of diabetes mortality remain uncertain in younger age groups and non-Europid populations.

Registration: PROSPERO registration ID CRD42019095974. Graphical abstract.

Keywords: Diabetes; Epidemiology; Mortality; Systematic review; Trends.


Figures

Fig. 1
Fig. 1
Patterns of all-cause mortality trends among people with diabetes by ethnicity (a), age group (b) and sex (c). The graph in (a) includes 55 predominantly Europid and 14 non-Europid populations from 35 studies; (b) includes 15 populations aged <40 years, 23 populations aged 40–54 years, 14 populations aged 55–69 years and 32 populations aged ≥70 years from 14 studies with data on age-specific mortality trends; (c) includes 17 male and 19 female populations from 15 studies with data on sex-specific mortality trends. Only the patterns of mortality trends in three calendar periods, i.e. 1970–1989, 1990–1999 and 2000–2016, are summarised. Blank columns indicate that data were not available for some calendar periods
Fig. 2
Fig. 2
Age-specific mortality rates among 26 populations with diabetes over time. Only populations reporting mortality in three or more time periods are plotted. (a, d, g, j) Mortality trends among the total population who were aged <40 (a), 40–54 (d), 55–69 (g) and ≥70 years (j). (b, e, h, k) Mortality trends among men who were aged <40 (b), 40–54 (e), 55–69 (h) and ≥70 years (k). (c, f, i, l) Mortality trends among women who were aged <40 (c), 40–54 (f), 55–69 (i) and ≥70 years (l)
Fig. 3
Fig. 3
APC in mortality rates by diabetes status among 33 populations. Only the 33 populations with mortality data available for computing the APC in mortality rates separately for those with and without diabetes are plotted. Populations are grouped according to the pattern of mortality trends in people with diabetes and the difference in mortality trends between populations with diabetes and without diabetes. aStudies did not measure mortality rates in continuous years; bp < 0.05 for the difference in the APCs in mortality rates between people with and without diabetes; cclassification of mortality trends in diabetes was determined according to statistical significance reported in the original paper, not according to the CIs of the APC shown in the figure; dCanadian indigenous population; epeople not from a European or black background in the USA. F, female; M, male; T, total

References

    1. Cho NH, Shaw JE, Karuranga S et al. (2018) IDF Diabetes Atlas: global estimates of diabetes prevalence for 2017 and projections for 2045. Diabetes Res Clin Pract 138:271–281. 10.1016/j.diabres.2018.02.023 - DOI - PubMed
    1. Magliano DJ, Shaw JE, Shortreed SM et al. (2008) Lifetime risk and projected population prevalence of diabetes. Diabetologia 51(12): 2179–2186. 10.1007/s00125-008-1150-5 - DOI - PubMed
    1. Gregg EW, Zhuo X, Cheng YJ, Albright AL, Narayan KM, Thompson TJ (2014) Trends in lifetime risk and years of life lost due to diabetes in the USA, 1985–2011: a modelling study. Lancet Diabetes Endocrinol 2(11):867–874. 10.1016/S2213-8587(14)70161-5 - DOI - PubMed
    1. Kondapally Seshasai SR, Kaptoge S, Thompson A et al. (2011) Diabetes mellitus, fasting glucose, and risk of cause-specific death. N Engl J Med 364(9):829–841. 10.1056/NEJMoa1008862 - DOI - PMC - PubMed
    1. Carstensen B, Kristensen JK, Ottosen P, Borch-Johnsen K (2008) The Danish National Diabetes Register: trends in incidence, prevalence and mortality. Diabetologia 51(12):2187–2196. 10.1007/s00125-008-1156-z - DOI - PubMed

Publication types