. 2020 Jul;94(7):2435-2461.
doi: 10.1007/s00204-020-02802-6. Epub 2020 Jul 6.

The EU-ToxRisk method documentation, data processing and chemical testing pipeline for the regulatory use of new approach methods

Affiliations

The EU-ToxRisk method documentation, data processing and chemical testing pipeline for the regulatory use of new approach methods

Alice Krebs et al. Arch Toxicol. 2020 Jul.

Abstract

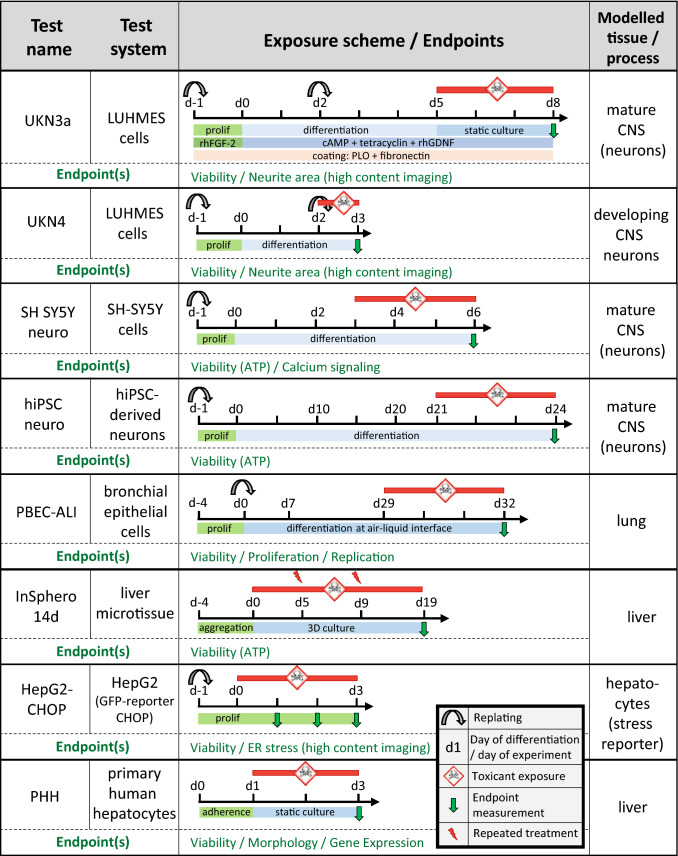
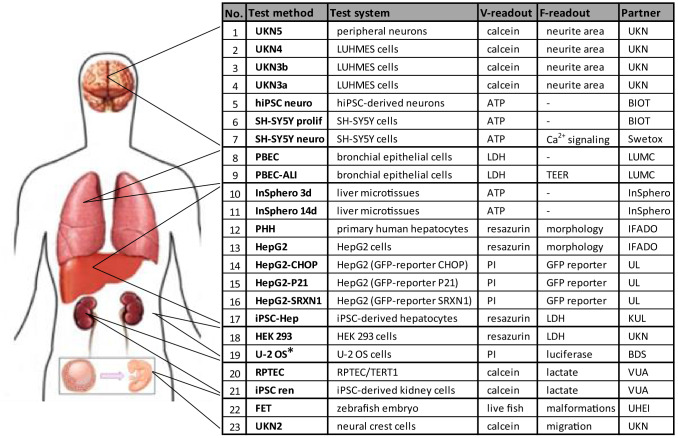
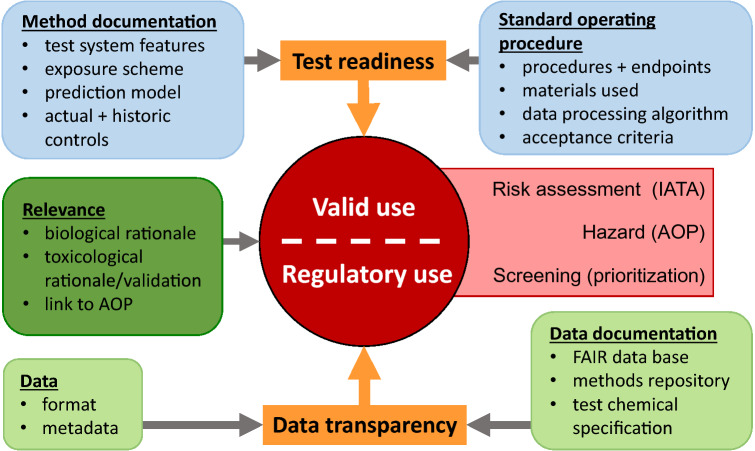
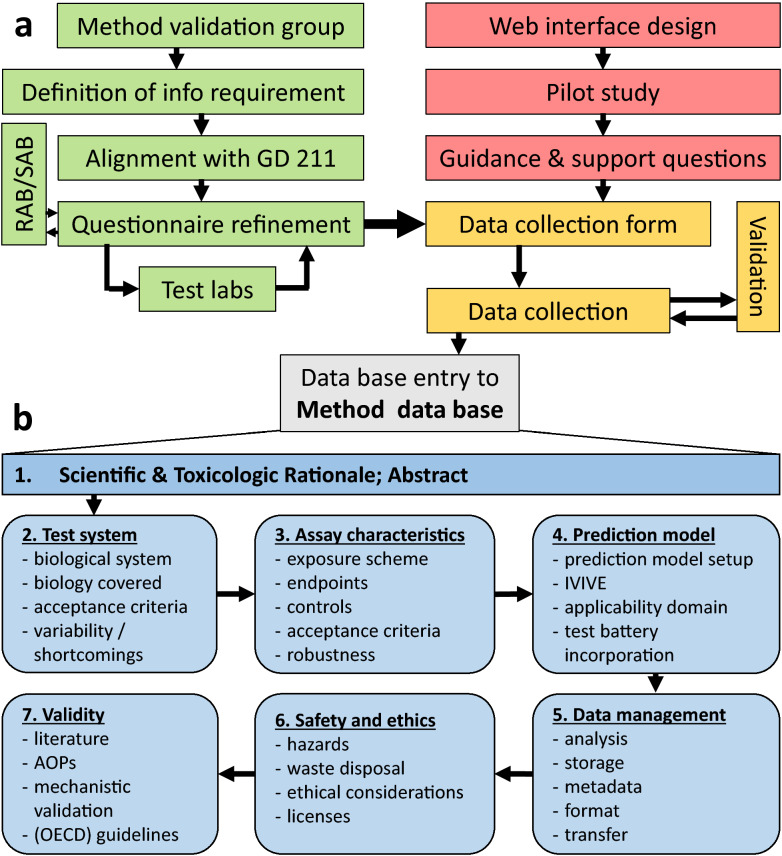
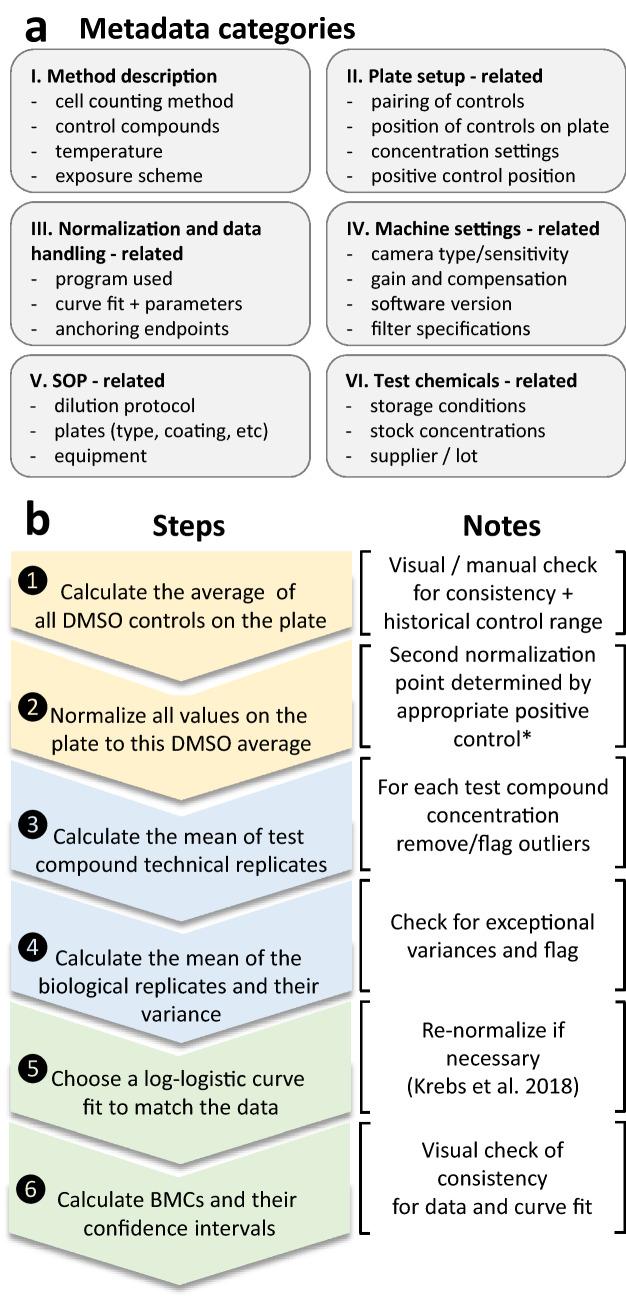
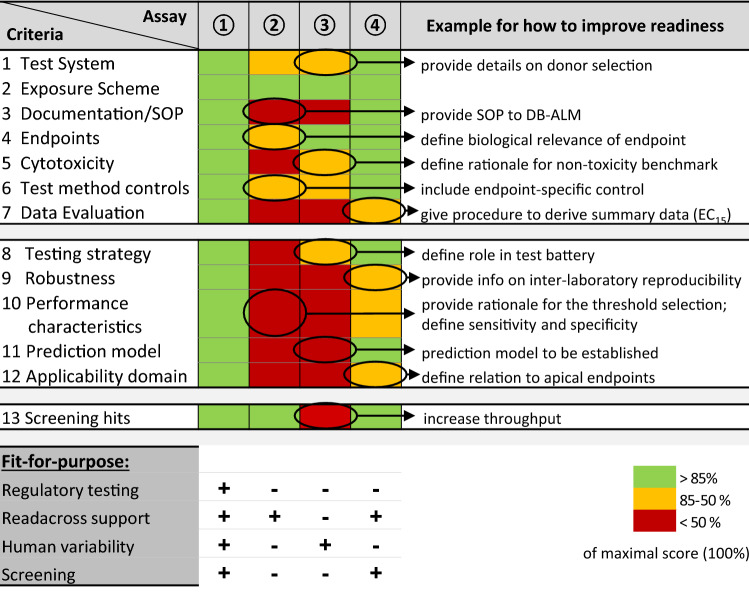
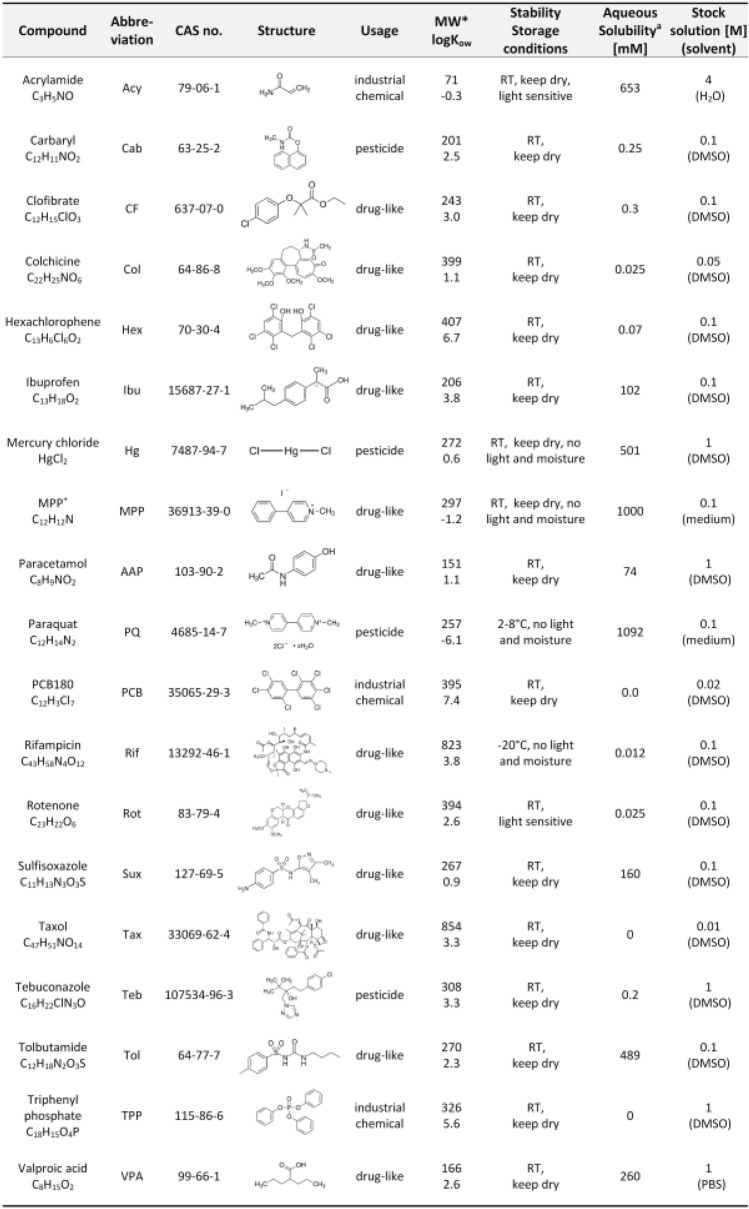
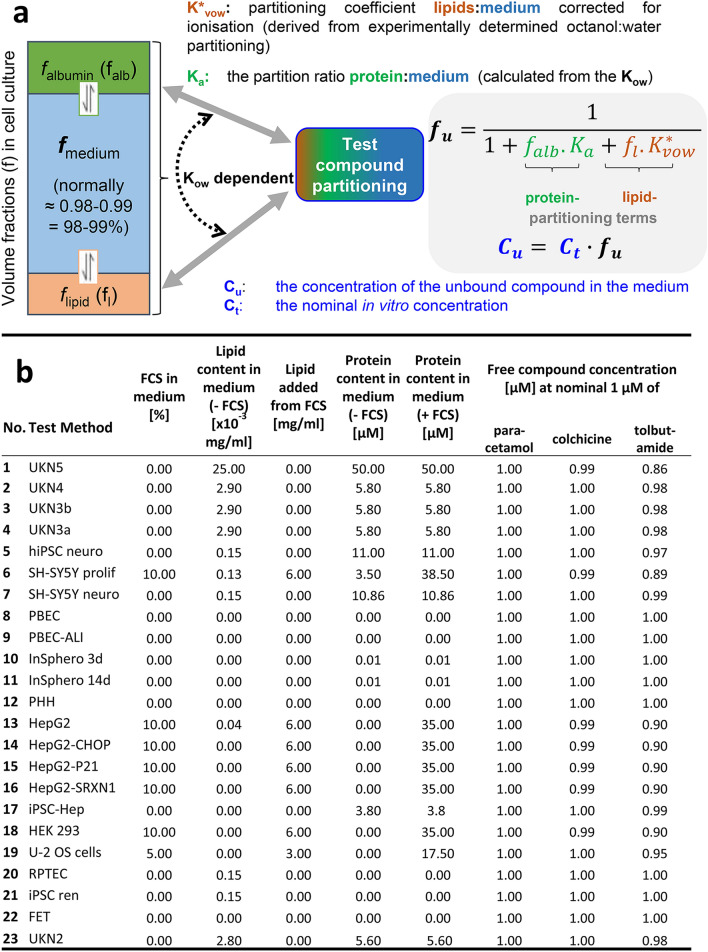
Hazard assessment, based on new approach methods (NAM), requires the use of batteries of assays, where individual tests may be contributed by different laboratories. A unified strategy for such collaborative testing is presented. It details all procedures required to allow test information to be usable for integrated hazard assessment, strategic project decisions and/or for regulatory purposes. The EU-ToxRisk project developed a strategy to provide regulatorily valid data, and exemplified this using a panel of > 20 assays (with > 50 individual endpoints), each exposed to 19 well-known test compounds (e.g. rotenone, colchicine, mercury, paracetamol, rifampicine, paraquat, taxol). Examples of strategy implementation are provided for all aspects required to ensure data validity: (i) documentation of test methods in a publicly accessible database; (ii) deposition of standard operating procedures (SOP) at the European Union DB-ALM repository; (iii) test readiness scoring accoding to defined criteria; (iv) disclosure of the pipeline for data processing; (v) link of uncertainty measures and metadata to the data; (vi) definition of test chemicals, their handling and their behavior in test media; (vii) specification of the test purpose and overall evaluation plans. Moreover, data generation was exemplified by providing results from 25 reporter assays. A complete evaluation of the entire test battery will be described elsewhere. A major learning from the retrospective analysis of this large testing project was the need for thorough definitions of the above strategy aspects, ideally in form of a study pre-registration, to allow adequate interpretation of the data and to ensure overall scientific/toxicological validity.

Keywords: Data processing; GIVIMP; In vitro toxicology; Metadata; Nuclear receptor.


Conflict of interest statement

The authors declare that they have no competing interests.

Figures

Fig. 1
Fig. 1
Exposure schemes of representative test methods as part of the test method description. A generic symbol language to display exposure schemes has been developed. Eight methods were chosen for exemplary display, while all others can be found in Suppl. Fig. 1. Information is given on the test system (type of cells used), and its treatment before and during execution of the test. The time axes displayed show the pivotal culture period determining the experimental outcome, displayed in units of days (d). The period of compound exposure is highlighted in red, with the flash arrow symbol indicating when test compound is re-added. The green and blue bars give general information on the culture state (e.g. proliferation (prolif) or adherence phase). In a more complete version of the graphical scheme (exemplified here for UKN3a only), additional information layers on cell medium additives and type of plastic coating would also be given (color figure online)
Fig. 2
Fig. 2
Overview of the panel of test methods used to assess repeated dose toxicity to key organs (RDT) and developmental toxicity (DART). The cross-systems testing case study of EU-ToxRisk comprised 23 test method families using 18 different test systems. For instance test method family No. 19, U-2 OS, comprised 25 different reporter assays (CALUX® assays)*, using luciferase expression in U-2 OS as measure of nuclear receptor modulation and other signaling pathways. The test method family No. 7 could be run as viability test method or as functional method examining Ca2+ signals triggered by opening of voltage-operated calcium channels. The test systems represent important features of the human nervous system, lung, liver, and kidney. Some systems (No. 18 and No. 19) representing less specialized cell types were included as potential negative controls of tissue specificity. Cells relevant for developmental and reproductive toxicity (DART) assessment were also included (No. 22 and No. 23). The assays were performed in 11 different laboratories. Besides viability (primary V-readout), often (i.e. in 16 of the 23 test methods) a functional readout (secondary F-readout) was also assessed. The contributing institutions were: UKN = University of Konstanz (D); BIOT = BioTalentum (HU); Swetox (SE). LUMC = Leiden University Medical Center (NL); InSphero GmbH (CH); IfADo at the Technical University Dortmund (D); UL = University of Leiden (NL); KUL = Catholic University of Leuven (BE); VUA = Free University Amsterdam (NL); UHEI = University of Heidelberg (D); BDS = BioDetection Systems (NL). TEER = Transepithelial electrical resistance
Fig. 3
Fig. 3
Identification of key parameters and description requirements to ensure test readiness and data transparency for regulatory use of NAM data. ‘Valid’ use, e.g. for regulatory purposes, was defined here as having a high requirement for data robustness, transparency of all procedures, and need for sufficient information on uncertainties. Three major requirements for validity were identified. First, the biological and toxicological rationale of the NAM, and the overall study objectives should be given. This may e.g. include a link to an AOP. Second, the test method applied should have been evaluated for its readiness. The latter requires complete standard operation procedures (SOPs) and a comprehensive method documentation. Third, data transparency was identified as an independent, and frequently neglected, domain to be documented. This requires the data format, and the respective metadata to be defined and documented. The data base structure needs to be designed according to findable, accessible, interoperable and re-usable criteria (FAIR), and links to the data and to the method repository need to be given. To the domain of data transparency also belongs the clear and unambiguous definition of test chemicals (e.g. SMILES and CAS numbers) including their storage, handling and toxicological background information
Fig. 4
Fig. 4
Process of establishing a method database and key information blocks documented. a The setup of the method database included several steps. A method validation group collected data and information that was agreed to be included in the metadata and to be documented. These were in alignment with the GD 211 of OECD to advance regulatory acceptance. The project’s regulatory and the scientific advisory board (RAB and SAB, respectively), as well as the participating test labs, contributed to refining the questionnaire for test method documentation (green). In parallel, a web interface was designed and set up to enable centralized access to the documented test methods. Within a pilot run, the upcoming issues were collected to provide guidance and support for future use (red). These two parallel approaches eventually gave rise to the data collection form. The process of data collection was constantly validated (orange). b An entry into the method database comprises numerous aspects of a test method. The scientific and toxicological rationale is given in the abstract. Furthermore, information about the test system, the test method/assay, its characteristics, the prediction model, data management, safety and ethics and its validity are included (color figure online)
Fig. 5
Fig. 5
Derivation of summary data and documentation of respective metadata. a Overview of the types of metadata considered relevant in this study. b Procedure to get from raw data to summary data. BMC benchmark concentration
Fig. 6
Fig. 6
Examples for fit-for-purpose test method evaluation. Four assays of the case study were selected to exemplify the process of test readiness evaluation according to the criteria defined in a recent publication (Bal-Price et al. 2018). Thirteen different categories were scored, each of them having multiple sub-items. The summary scores of each main category were normalized to the maximum possible score. The result was indicated in green (high score), yellow, and red (low score). For instance, robustness (category 9) was high for test 1, low for tests 2 + 3 and intermediate for test 4. The first 7 categories deal usually with an earlier phase of test development (e.g. definition of the exposure scheme and endpoints), categories 8–12 require usually more extensive work (e.g. setup of a prediction model or definition of the applicability domain); the 13th category deals with special requirements arising from high-throughput screening. Several examples are given how test readiness may be improved in a given category. For instance, information on donor selection criteria may be missing for a test system based on human primary cells, or the data evaluation strategy may be incompletely described. Below the scoring table, four example applications for test methods are given, and + signs indicate whether the assay above may be suitable for this test purpose. These purely theoretical examples are meant to indicate that each test is ready for some application, but only a test with highest readiness level in all categories is useful for all different purposes. Scoring was performed by two independent experts, based on the information in the test method description. The scores were averaged, when they differed less than 20% or a third scorer was added in the few (< 10%) cases of larger discrepancies. Assay 1 was the CALUX-ER agonist assay, 2 was the RPTEC assay, 3 was the PBEC-ALI assay and 4 was UKN2. Note that the scoring was done to exemplify the procedure, not to rank assays. The scores are likely to have changed for assays, since they were scored in the year 2017 (color figure online)
Fig. 7
Fig. 7
List of compounds tested in this study (CSY). Information of physiochemical properties included the molecular weight (MW, in Dalton), the lipophilicity, expressed as the logarithm of the octanol–water distribution constant (Kow), and information on preparing stock solutions. aSolubility at pH 7.4. RT = room temperature. logP and aqueous solubility were derived using the Chemaxon software. Physiochemical properties derived from EPI-suite were used in calculations
Fig. 8
Fig. 8
Documentation of medium compositions and estimation of free compound concentrations. a A model is presented that assumes that a test compound distributes to three different fractions of cell culture medium, dependent on its Kow (octanol–water distribution coefficient). Note, that fractions are drawn here out of scale, and strictly separated. In practice, the aqueous medium comprises the largest volume fraction, and the other components (lipid and protein) are interspersed. Nevertheless, their volume can be calculated, based on their specific weight and the known amounts. This means that the volume of the protein fraction (falb) and of the lipid fraction can be calculated, if medium composition is known (Fisher et al. 2019). With this information available, the free drug concentration can be calculated. b Composition of different media used for the test systems of CSY. The last three columns indicate the free compound concentrations in the different cell culture media of the test systems. Paracetamol was chosen as drug with low protein binding (15%), while colchicine (40%) and tolbutamide (95%) are known to be bound to protein to a higher percentage. For the overview table, we assumed that 100% FCS contain 346 µM albumin and ~ 6000 mg/l lipid (Lindl 2002). Free compound concentrations were calculatedas as described (Fischer et al. ; Fisher et al. 2019). Information on % protein binding was taken from the DrugBank data base and literature (Chappey and Scherrmann ; Wishart et al. 2006)
Fig. 9
Fig. 9
Characterization of the baseline variation (assay noise) of the NAM panel. a Variance of DMSO controls controls across different test methods. Each data point represents the standard deviation between technical replicates on the same plate, expressed as percent of average. The line indicates the average. b Variance of negative control compounds across test methods. To depict the test variance in treated samples, normalized data of the two lowest concentrations of three negative controls (clofibrate, tolbutamide and sulfisoxazole) in each test system are shown. SD standard deviation
Fig. 10
Fig. 10
Profiling of test chemicals in the U-2 OS reporter cell lines battery. Compounds were tested at 13 concentrations (ranging from 4 to 10 [− log10(M)], respectively 100 µM to 0.1 nM) in the CALUX® (Chemical Activated Luciferase gene eXpression) reporter gene assays of BioDetection Systems (Netherlands) in U-2 OS cells. After 24 h exposure, luciferase induction was quantified and concentration-reponse curves were modelled. The data displayed are the respective assay PoD given in − log(M). For instance, 6.0 for tebuconazole in the AR-anta assay means that its PoD was 1 µM. The exact description of the CALUX® assay endpoints and the according PoDs are given in Suppl. Fig. 2. Data are means from 3 assay runs. Grey: no effect observed. Orange: concentration of PoD [–log(M)]. ago = agonist. anta = antagonist. The following assays were run, but they are not included in this display as there was no response: AR, PR, GR, RAR, LXR, Hif1α, NFκB. The following compounds had no effect, and are therefore not shown: acrylamide, MPP+, paracetamol, sulfisoxazole, clofibratez (color figure online)

References

    1. Adler S, Basketter D, Creton S, et al. Alternative (non-animal) methods for cosmetics testing: current status and future prospects-2010. Arch Toxicol. 2011;85(5):367–485. doi: 10.1007/s00204-011-0693-2. - DOI - PubMed
    1. Aschauer L, Gruber LN, Pfaller W, et al. Delineation of the key aspects in the regulation of epithelial monolayer formation. Mol Cell Biol. 2013;33(13):2535–2550. doi: 10.1128/MCB.01435-12. - DOI - PMC - PubMed
    1. Aschner M, Ceccatelli S, Daneshian M, et al. Reference compounds for alternative test methods to indicate developmental neurotoxicity (DNT) potential of chemicals: example lists and criteria for their selection and use. Altex. 2017;34(1):49–74. doi: 10.14573/altex.1604201. - DOI - PMC - PubMed
    1. Bal-Price A, Hogberg HT, Crofton KM, et al. Recommendation on test readiness criteria for new approach methods in toxicology: exemplified for developmental neurotoxicity. Altex. 2018;35(3):306–352. doi: 10.14573/altex.1712081. - DOI - PMC - PubMed
    1. Beger RD, Dunn WB, Bandukwala A, et al. Towards quality assurance and quality control in untargeted metabolomics studies. Metabolomics. 2019;15(1):4. doi: 10.1007/s11306-018-1460-7. - DOI - PMC - PubMed

Publication types

LinkOut - more resources