. 2021 Mar;529(4):757-785.
doi: 10.1002/cne.24977. Epub 2020 Aug 3.

Light sheet microscopy of the gerbil cochlea

Affiliations

Light sheet microscopy of the gerbil cochlea

Kendall A Hutson et al. J Comp Neurol. 2021 Mar.

Abstract

Light sheet fluorescence microscopy (LSFM) provides a rapid and complete three-dimensional image of the cochlea. The method retains anatomical relationships-on a micrometer scale-between internal structures such as hair cells, basilar membrane (BM), and modiolus with external surface structures such as the round and oval windows. Immunolabeled hair cells were used to visualize the spiraling BM in the intact cochlea without time intensive dissections or additional histological processing; yet material prepared for LSFM could be rehydrated, the BM dissected out and reimaged at higher resolution with the confocal microscope. In immersion-fixed material, details of the cochlear vasculature were seen throughout the cochlea. Hair cell counts (both inner and outer) as well as frequency maps of the BM were comparable to those obtained by other methods, but with the added dimension of depth. The material provided measures of angular, linear, and vector distance between characteristic frequency regions along the BM. Thus, LSFM provides a unique ability to rapidly image the entire cochlea in a manner applicable to model and interpret physiological results. Furthermore, the three-dimensional organization of the cochlea can be studied at the organ and cellular level with LSFM, and this same material can be taken to the confocal microscope for detailed analysis at the subcellular level.

Keywords: RRID: AB_10015251; RRID: AB_2534017; RRID:SCR_002465; RRID:SCR_003070; RRID:SCR_007370; auditory nerve; confocal microscopy; electrocochleography; inner hair cells; outer hair cells.


Conflict of interest statement

Conflict of Interest. The authors declare no conflicts of interest.

Figures

Figure 1.
Figure 1.
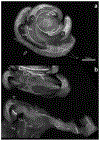
Examples of images obtained from light sheet and confocal microscopes (z-stack maximum intensity projection), both imaged at 5x magnification. Each image was obtained from a perfusion-fixed cochleae immunolabeled with antibodies to myosin VIIa to label hair cells. The dissection process for confocal imaging loses the 3-D architecture that is maintained with LSFM.
Figure 2.
Figure 2.
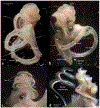
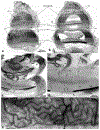
Decalcification steps. Two views of a perfusion-fixed left cochlea: a-c lateral view; d-f rotated to a view the round window (arrow in d). Panels a and d are before decalcification, all others after decalcification. Decalcified material is sufficient to see many structural details, for example in e, asterisk marks the modiolus containing the auditory nerve, from which fascicles of the auditory nerve (hollow arrowhead) course through the osseous spiral lamina to reach the basilar membrane (arrow). Further descriptive details in text. Scale bar in a same for b-f. bc; boney canal for stapedial artery’s intracranial entrance; OW, oval window; RW, round window; sl, spiral ligament; SM/V, region occupied by scala media and vestibuli; ST, scala tympani; st, stapedial bone; st a, stapedial artery; ttm, tensor tympani muscle.
Figure 3.
Figure 3.
Views of the left labyrinth after dissection of the otic capsule. In a, as viewed from above; b, from the lateral side; c, as tilted to a view through the round window. In d, the basilar membrane is shown after being dissected free of the spiral ligament, osseous spiral lamina and modiolus. Scale bar in a same for b and c. aa, ampulla of the anterior canal; ant, lat and post canals; anterior, lateral and posterior vestibular canals; bm, basilar membrane; la, ampule of the lateral canal; osl; osseous spiral lamina; OW, oval window; pa, ampule of the posterior canal; RW, round window; sl, spiral ligament.
Figure 4.
Figure 4.
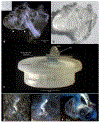
Example of a cochlea cleared and mounted for LSFM. Appearance of a cleared cochlea in (a) and out (b) of the clearing solution; same specimen as Figure 2. The inset in a is a brightfield image to show that without using incident light from the side the cleared cochlea is almost invisible. For LSFM imaging the cochlea is mounted in an “apex-up” position on a custom made acrylic stand (c). Leaving a sprig of auditory nerve (AN) or facial nerve (FN) attached can assist during preparation steps (d-f). Scale in a same for b; scale in d same for e. IAM, internal acoustic meatus; OW, oval window; RW, round window; SM/V, region occupied by scala media and vestibuli; ST, scala tympani; st a, stapedial artery.
Figure 5.
Figure 5.
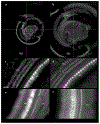
Acquisition of light sheet images. In a and b, similar regions from a specimen captured at 5x (a) and 10x (b) magnification, using a laser thickness of 21 μm. Enlarged regions of the basilar membrane (c and d from a and b respectively) show the level of detail resolved in 5x vs 10x images. The region of brightest intensity is the cuticular plate, which is rich in myosin VIIa. To compare resolutions, other specimens were imaged at 5x with laser thickness of 28 μm (e) and 12.6x with laser thickness 10 μm (f). Scale in c same for d-f. IHC, inner hair cells; OHC, outer hair cells.
Figure 6.
Figure 6.
Examples of three-dimensionally rendered cochlea (a) and orthogonally re-sliced images (b–d; scale in c same for b and d). This specimen was immersion fixed and otic capsule removed prior to immunostaining. Note the spiral modiolar artery (sma) in b and c. Additional specific details in text. AN, auditory nerve; IHC, inner hair cells; OHC, outer hair cells; osl; osseous spiral lamina; sl, spiral ligament; sv, stria vascularis.
Figure 7.
Figure 7.
Series of images progressively increasing in thickness from 100 μm (a) to 250 μm (b) to 500 μm (c). Note changes in anatomical details observable as thickness and relative depth increase, such as spiral ganglion cells (SGC) within Rosenthal’s canal (a) as they expand to form their spiraling structure (hollow arrow heads in b and c). Solid arrowhead points to the same vessel in a-c; solid arrows indicate the vascular bed within the modiolus. Scale in b same for c. Aud Nv, auditory nerve; IHC, inner hair cells; OHC, outer hair cells; osl; osseous spiral lamina; sl, spiral ligament; sv, stria vascularis.
Figure 8.
Figure 8.
Two forms of artifact observed in specimens with the otic capsule removed. Curling of the free margin of the spiral ligament (hollow arrowheads) likely resulted from the alcoholic dehydration steps, while a buckling disfigurement (hollow arrow) is possibly due to dehydration or reflects the cochlea resting on a surface during preparation steps. Scale same for a and b. cv, collecting venules; IHC, inner hair cells; OHC, outer hair cells; osl; osseous spiral lamina; sma, spiral modiolar artery; sv, stria vascularis.
Figure 9.
Figure 9.
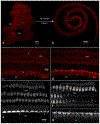
Examples from otic capsule intact specimens showing antibody solutions had complete access to hair cells throughout each turn of the cochlea in perfusion (a-e) or immersion (f and g) fixed specimens. Crosssections from the apical (a), middle (b) and basal (c) turns showing labeled hair cells. Two other cases viewed in a nominal perimodiolar orientation (d and f) and when each is rendered in three-dimensions (e and g, respectively). Scale for a-c in c. AN, auditory nerve; IHC, inner hair cells; OHC, outer hair cells; OC, otic capsule; OW, oval window; RM, Reisner’s membrane; SGC, spiral ganglion cells; sl, spiral ligament; SM, scala media; ST, scala tympani; SV, scala vestibule; sv, stria vascularis; TC, tunnel of Corti; VHS, vestibular hair cells.
Figure 10.
Figure 10.
Systemic pre-treatment with furosemide/kanamycin did not affect the quality of material prepared for LSFM. Images from the middle turn of a furosemide/kanamycin treated animal (a) compared to a normal animal (b). Inner hair cells (IHC) are well labeled in both animals, as are outer hair cells (OHC) with the exception of those missing due to the drug treatment (a). No degradation of vascular elements, such as the radiating arterioles (ra) or stria vascularis (sv) were noted. sma, spiral modiolar artery; SGC, spiral ganglion cells.
Figure 11.
Figure 11.
Autofluorescence of cochlear vasculature in material stained for myosin VIIa. For these images the look-up table values have been inverted to enhance visualization of vascular elements. Progressing from lateral (a and b) to internal (c and d) the vascular features of the lateral wall and internal cochlear structures can be imaged in remarkable detail. In c, the cochlear turns are indicated: A, apical; M, middle; and B, basal. Also in c, hollow arrowheads indicate small caliber vessels within the osseous spiral lamina (osl), the hollow arrow points to a bifurcating vessel shown at higher magnification in d. In d, the vessel can be traced (hollow arrowheads) from its origin at the spiral modiolar artery (sma) to its bifurcation (hollow arrow) becoming a vessel of the tympanic lip (solid arrowhead) and a vessel of the basilar membrane (solid arrow). In e, an enlarged image shows the intricate arrangement of anastomoses (e.g., arrowheads) between radiating arterioles (ra) and collecting venules (cv) within the stria vascularis Scale for b same as in a. ES, external sulcus; IHC, inner hair cells; OHC, outer hair cells; SGC, spiral ganglion cells sl, spiral ligament.
Figure 12.
Figure 12.
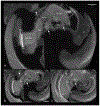
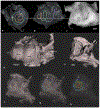
Three-dimensional images of an immersion fixed, otic capsule intact cochlea viewed at a wavelength of 488 nm to enhance formaldehyde autofluorescence. This specimen was not immunostained. Viewed from lateral (a), apical (b) and after rotation to the round window (c) perspectives, then changing the depth of view to just inside the round window (d). Not only is the vasculature depicted in great detail, but also the spatial relationships that exist between vascular elements and internal structures such as hair cells (HC), the spiral ganglia (SGC) and auditory nerve (AN). Scale in a same for all images. cv, collecting venules; OW, oval window; ra, radiating arterioles; RW, round window; sma, spiral modiolar artery; SGC, spiral ganglion cells; st a, stapedial artery; sv, stria vascularis.
Figure 13.
Figure 13.
Material prepared originally for LSFM can be rehydrated and the basilar membrane (with organ of Corti complex) dissected free for further confocal examination. The basilar membrane as it appears in a light sheet image before rehydration (a) and in a confocal image after dissection and flat-mounting (b). Panel b is a single image snap-shot taken prior to examination at 63x oil (c-g). In the higher magnification images there was no observable membrane disruption; nuclei of both inner and outer hair cells (IHC, OHC) were evident (arrows in c) as were cuticular plates of inner hair cells (arrows in d). Deconvolved and enlarged images (e and f) show outer and inner hair cells at two focal levels (asterisk at upper left marks same outer hair cell in e and f). Here notice stereocilia of both inner and outer hair cells was preserved (hollow arrowheads in e and f). In g, the stack has been re-sliced to show the row of inner hair cells, their soma, nuclei, cuticular palates and stereocilia (hollow arrowheads point to same inner hair cells in e and g). Scale in c same for d; in e same for f and g.
Figure 14.
Figure 14.
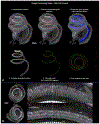
Procedures for virtually dissecting a three-dimensional basilar membrane (a; steps 1-4) then plotting the location of hair cells (steps 5 and 6). The top left image in b shows the upper two turns of the cochlea as looking down through the apex, the lower left image is after rotation away from apex. Boxed areas are shown to the right. Here note that from an apex down view, the orientation of outer hair cells obscure accurate identification of individual cells, while after rotation individual cells can be recognized. Dashed line marks the same location in both images. IHC, inner hair cells; OHC, outer hair cells.
Figure 15.
Figure 15.
Example of a virtually dissected basilar membrane (a) from an animal treated with an ototoxic injection of furosemide/kanamycin. Note the filament tracing (red line) along the inner hair cells (hollow arrow) and the location of surviving outer hair cells (e.g., arrowhead) are visible even in this 5x-imaged specimen. However, for accurate counting, materials imaged at 12.6x (through at least the region of interest) are preferred. In b and c, the regions of interest derived from two other injected cases are illustrated. Note that unlike a typical cytocochleogram, as a result of the image processing steps (Figure 14a), hair cells have z coordinates as well as x and y. Scale same for b and c.
Figure 16.
Figure 16.
Procedure for creating a three-dimensional frequency map of the basilar membrane (a) and measuring distance along that map (b-d). The inner hair cell filament trace (Figure 14 step 2) is converted to color-coded distance and the frequency-distance transformation is applied (a). For convenience in mapping across animals, spheres are placed at common octave frequency locations. Like hair cell counting, the frequency map can be extracted and freely rotated along any axis. This map may be used to make specific frequency related distance measurements, such as angular, linear or vector distance between any two frequencies. See also Table 1. Scale in c same for d.
Figure 17.
Figure 17.
Outer hair survival after ototoxic injection can be described by frequency distribution. An LSFM image of the apical turn (a) shows the location of surviving outer hair cells (e.g. hollow arrows) and a distant lone survivor (solid arrow in a and b). Hollow arrowheads point out the intact IHC row. Following the steps outlined for filament tracing, distance transformation and basilar membrane extraction, the frequency-mapped region of interest is shown in b. Here, the degree of outer hair cell loss can be described by frequency, ranging from a full compliment of cells at 316 Hz through the last surviving cell at 885 Hz. Scale same for a and b.
Figure 18.
Figure 18.
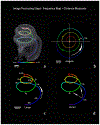
Application of the three-dimensional frequency map for geometry based physiological investigations. Frequency maps from otic capsule intact specimens retain relationships with external structures, as viewed from the apex (a) or laterally (b). When aligned with a typical surgical view of the cochlea (c), frequency specific targets can be identified for study. In d, a surface rendered cochlea is rotated to view the round window (e) oriented as for placement of an electrocochleographic recording electrode. In f-h, opacity is incrementally decreased allowing for a geometric interpretation of what the electrode “sees” through the round window as depth of view reaches the apex. Specific frequencies are labeled at 32, 16, 4 and 2 kHz. Asterisk in e-h denotes the crest of the round window niche. Note in d the bone pedestal used for mounting the cochlea to the acrylic stand (as in Figure 4c). Scale for a and b shown in c; scale for e-h shown in e. OHC, outer hair cells; OW, oval window; RW, round window; st, stapedial bone; st a, stapedial artery.

Similar articles

Cited by

References

    1. Abbas PJ, Tejani VD, Scheperle RA, & Brown CJ (2017). Using Neural Response Telemetry to Monitor Physiological Responses to Acoustic Stimulation in Hybrid Cochlear Implant Users. Ear Hear, 38(4), 409–425. doi:10.1097/AUD.0000000000000400 - DOI - PMC - PubMed
    1. Adunka OF, Giardina CK, Formeister EJ, Choudhury B, Buchman CA, & Fitzpatrick DC (2016). Round window electrocochleography before and after cochlear implant electrode insertion. Laryngoscope, 126(5), 1193–1200. doi:10.1002/lary.25602 - DOI - PMC - PubMed
    1. Ahmad FI, Choudhury B, De Mason CE, Adunka OF, Finley CC, & Fitzpatrick DC (2012). Detection of intracochlear damage during cochlear implant electrode insertion using extracochlear measurements in the gerbil. Laryngoscope, 122(3), 636–644. doi:10.1002/lary.22488 - DOI - PMC - PubMed
    1. Ariel P (2018). UltraMicroscope II - A User Guide. Chapel Hill, NC. doi:10.17615/C69M15. - DOI - PubMed
    1. Batrel C, Huet A, Hasselmann F, Wang J, Desmadryl G, Nouvian R, . . . Bourien J (2017). Mass Potentials Recorded at the Round Window Enable the Detection of Low Spontaneous Rate Fibers in Gerbil Auditory Nerve. PLoS One, 12(1), e0169890. doi:10.1371/journal.pone.0169890 - DOI - PMC - PubMed

Publication types