

Genomic characteristics and drug screening among organoids derived from non-small cell lung cancer patients
- PMID: 32633046
- PMCID: PMC7396373
- DOI: 10.1111/1759-7714.13542
Genomic characteristics and drug screening among organoids derived from non-small cell lung cancer patients
Abstract
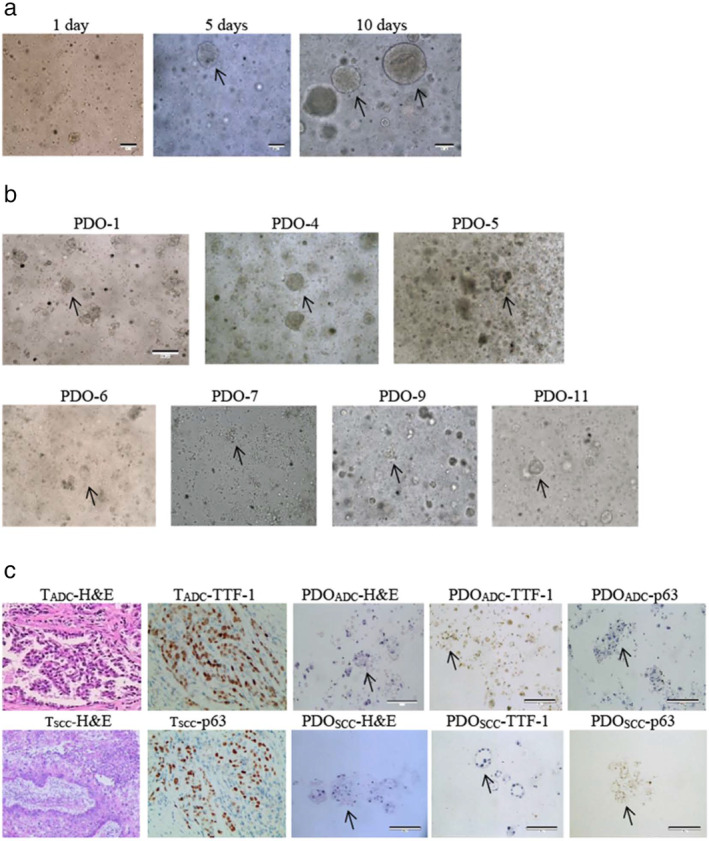
Background: Patient-derived organoid (PDO) models are highly valuable and have potentially widespread clinical applications. However, limited information is available regarding organoid models of non-small cell lung cancer (NSCLC). This study aimed to characterize the consistency between primary tumors in NSCLC and PDOs and to explore the applications of PDOs as preclinical models to understand and predict treatment response during lung cancer.
Methods: Fresh tumor samples were harvested for organoid culture. Primary tumor samples and PDOs were analyzed via whole-exome sequencing. Paired samples were subjected to immunohistochemical analysis. There were 26 antineoplastic drugs tested in the PDOs. Cell viability was assessed using the Cell Titer Glo assay 7-10 days after drug treatment. A heatmap of log-transformed values of the half-maximal inhibitory concentrations was generated on the basis of drug responses of PDOs through nonlinear regression (curve fit). A total of 12 patients (stages I-III) were enrolled, and 7 paired surgical tumors and PDOs were analyzed.
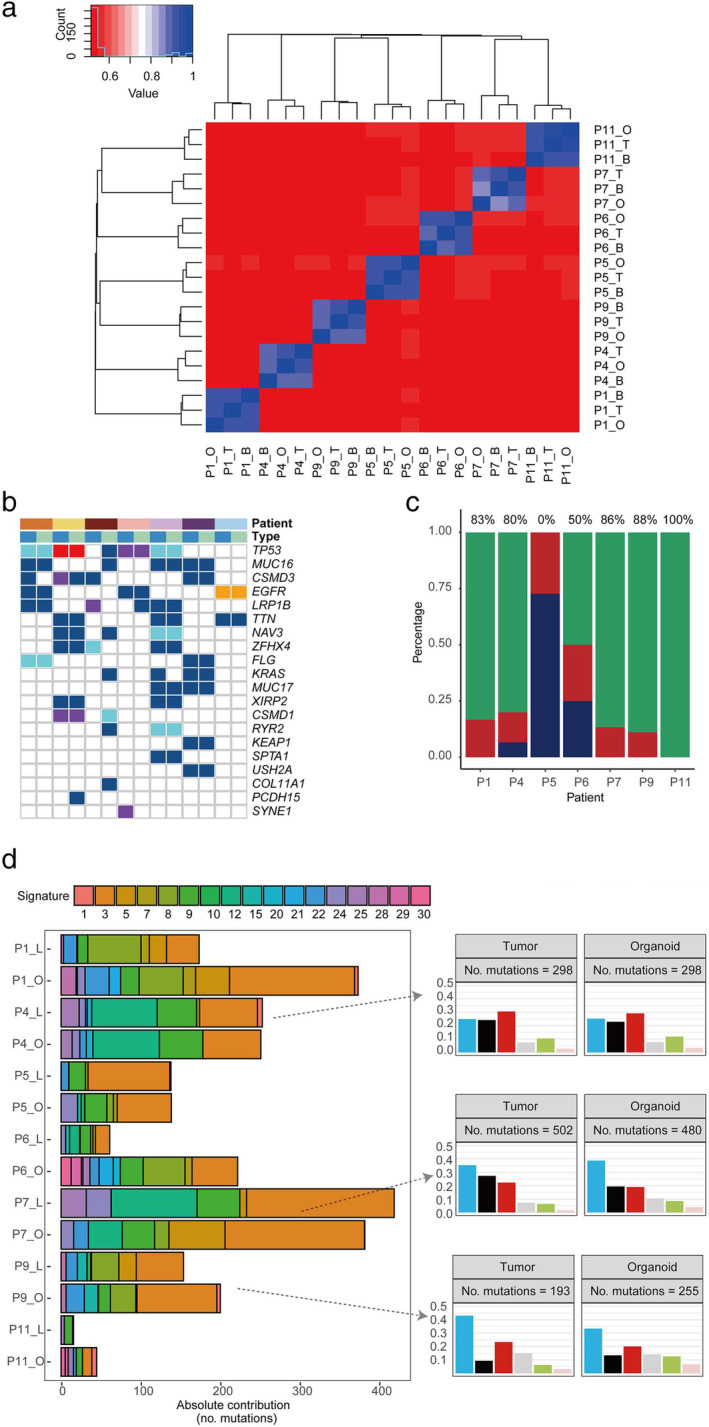
Results: PDOs retained the histological and genetic characteristics of the primary tumors. The concordance between tumors and PDOs in mutations in the top 20 NSCLC-related genes was >80% in five patients. Sample purity was significantly and positively associated with variant allele frequency (Pearson r = 0.82, P = 0.0005) and chromosome stability. The in vitro response to drug screening with PDOs revealed high correlation with the mutation profiles in the primary tumors.
Conclusions: PDOs are highly credible models for detecting NSCLC and for prospective prediction of the treatment response for personalized precision medicine.
Key points: Lung cancer organoid models could save precious time of drug testing on patients, and accurately select anticancer drugs according to the drug sensitivity results, so as to provide a powerful supplement and verification for the gene sequencing.
Keywords: Consistency analysis; drug screening; non-small cell lung cancer; patient-derived organoid; whole exome sequencing.
© 2020 The Authors. Thoracic Cancer published by China Lung Oncology Group and John Wiley & Sons Australia, Ltd.
Figures
 ) P1, (
 ) P4, (
 ) P5, (
 ) P6, (
 ) P7, (
 ) P9, and (
 ) P11; Mutation (
 ) Missense, (
 ) Nonsense, (
 ) Frame Shift, (
 ) Splicing, (
 ) In Frame Indel; Type (
 ) Tumor, and (
 ) Organoid. (c) Concordance of somatic mutations detected in the organoid and corresponding tumor tissue (
 ) Concordant, (
 ) Organoid only, and (
 ) Tumor only. (d) Mutation signature distributions of organoid lines and tumor tissues in each patient. Signature types are displayed in the right panel. C > A, C > G, and C > T were the most common point mutations in our paired samples Point mutation type (
 ) C>A, (
 ) C>G, (
 ) C>T, (
 ) T>A, (
 ) T>C, and (
 ) T>G.
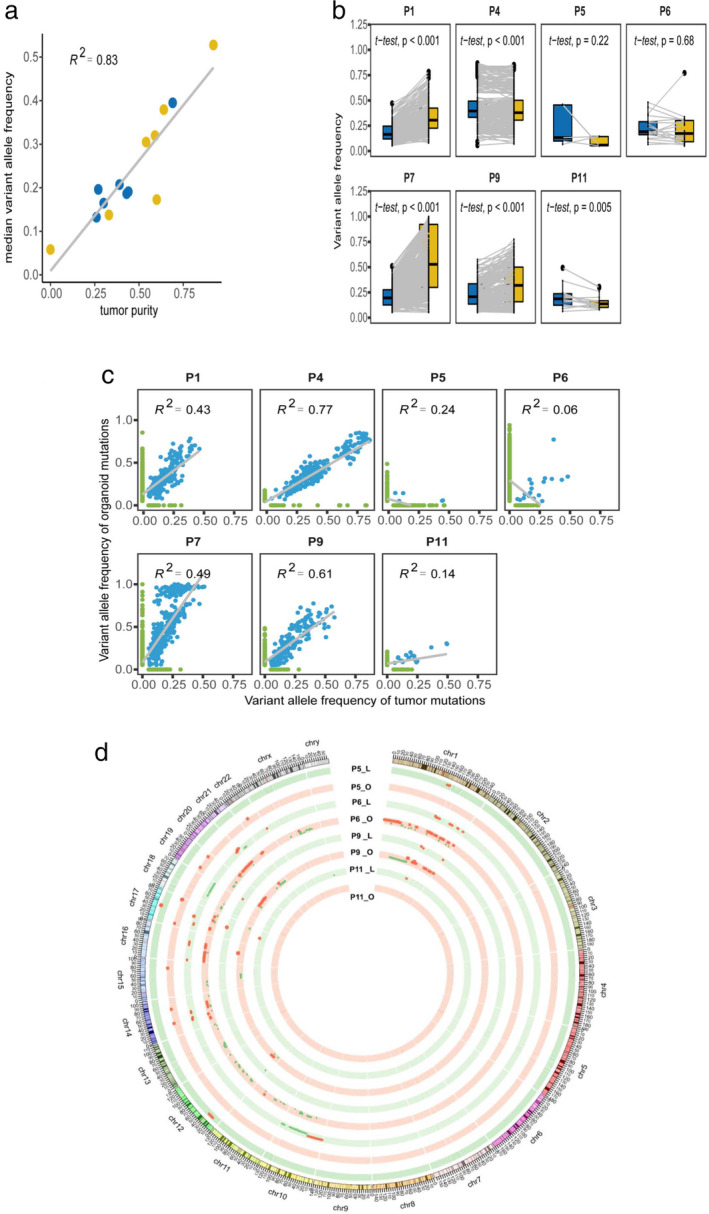
 ) Tumor, and (
 ) Organoid. (b) Comparison of VAF distributions of common mutations in organoids and tumor tissues of each patient (
 ) Tumor, and (
 ) Organoid. (c) Correlation analysis of total mutations with VAF in organoids and tumor tissues in each patient. (d) Circos analysis of paired samples in the chromosomal context of PDOs. The outer layer represents the chromosome location; inner rings, CNVs at different chromosome loci. Red and green colors represent gains and losses in DNA copy number, respectively. CNV, copy number variation; VAF, variant allele frequency.
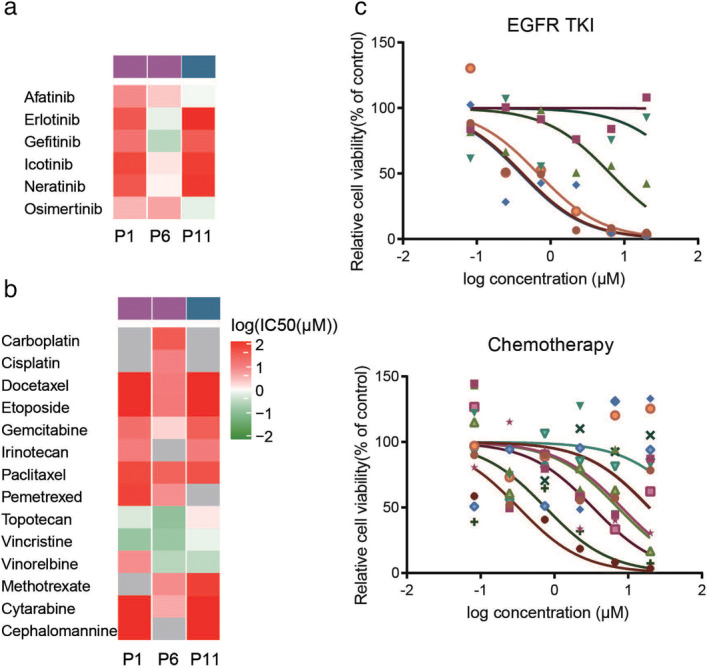
 ) EGFR L858R, and (
 ) EGFR EX20ins. (b) The chemotherapeutic sensitivity was analyzed in P1, P6, and P11 (
 ) EGFR L858R, and (
 ) EGFR EX20ins. (c) Drug sensitivity screening was performed in P9, which harbored a KRAS mutation, using EGFR‐TKIs (
 ) Afatinib, (
 ) Erlotinib, (
 ) Gefitinib, (
 ) Icotinib, (
 ) Neratinib, and (
 ) Osimertinib and chemotherapy drugs (
 ) Methotrexate, (
 ) Cytarabine, (
 ) Cisplatin, (
 ) Carboplatin, (
 ) Docetaxel, (
 ) Etoposide, (
 ) Gemcitabine, (
 ) Irinotecan, (
 ) Paclitaxel, (
 ) Pemetrexed, (
 ) Topotecan, (
 ) Vincristine, (
 ) Vinorelbine, and (
 ) Cephalomannine. EGFR‐TKI, epidermal growth factor receptor tyrosine kinase inhibitor; PDO, patient‐derived organoid.
References
-
- Bray F, Ferlay J, Soerjomataram I, Siegel RL, Torre LA, Jemal A. Global cancer statistics 2018: GLOBOCAN estimates of incidence and mortality worldwide for 36 cancers in 185 countries. CA Cancer J Clin 2018; 68: 394–424. - PubMed
-
- Harrison RK. Phase II and phase III failures: 2013‐2015. Nat Rev Drug Discov 2016; 15: 817–8. - PubMed
Publication types
MeSH terms
LinkOut - more resources
Full Text Sources
Medical
