. 2020 Jul 7:9:e54076.
doi: 10.7554/eLife.54076.

Trends in snakebite deaths in India from 2000 to 2019 in a nationally representative mortality study

Affiliations

Trends in snakebite deaths in India from 2000 to 2019 in a nationally representative mortality study

Wilson Suraweera et al. Elife. .

Abstract

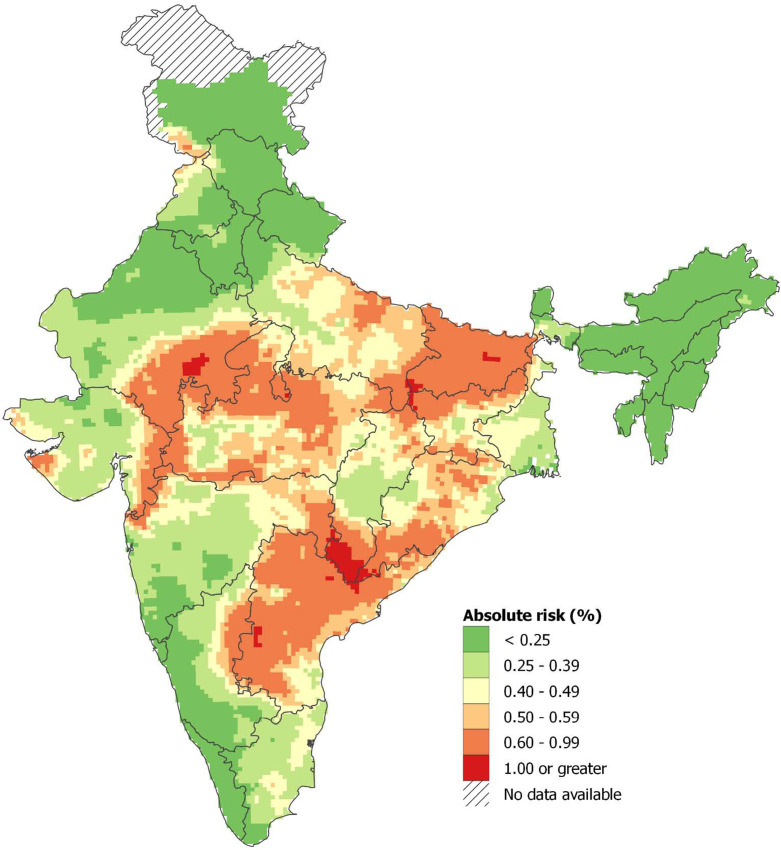
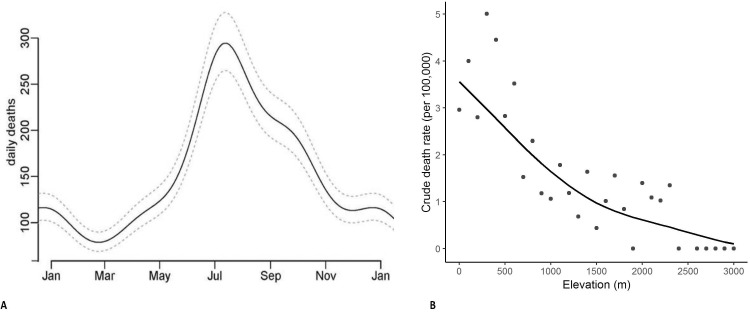
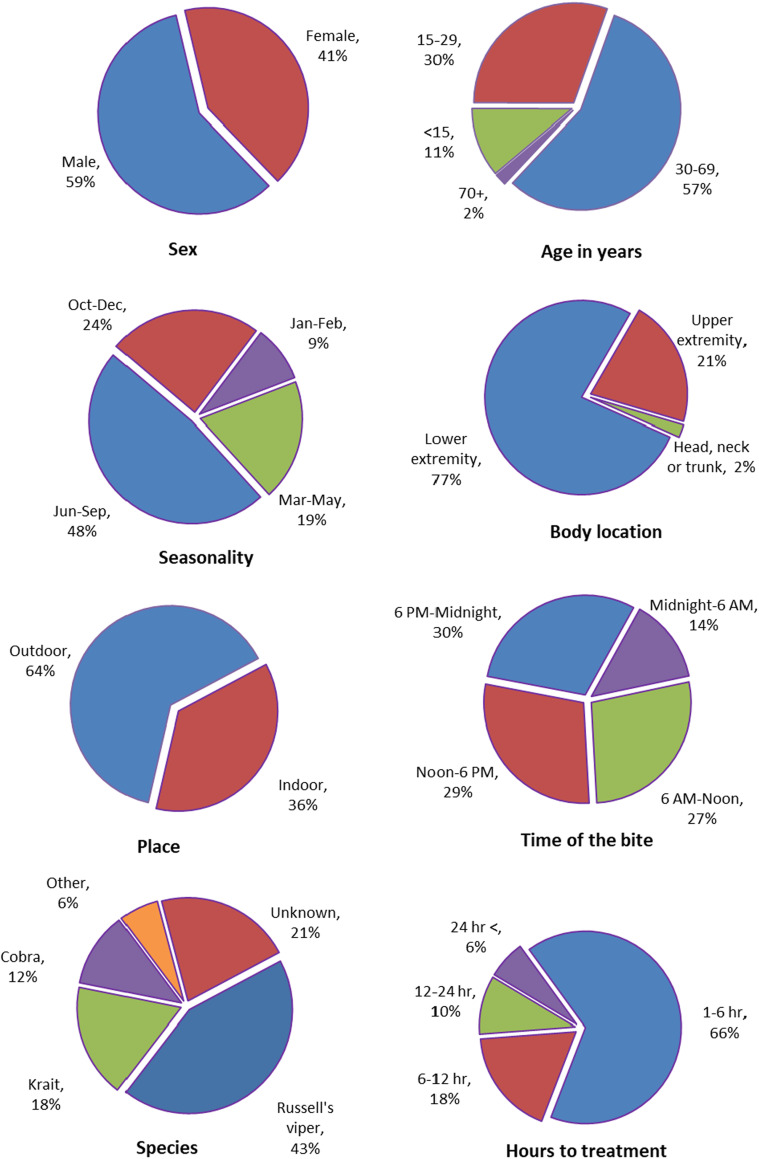
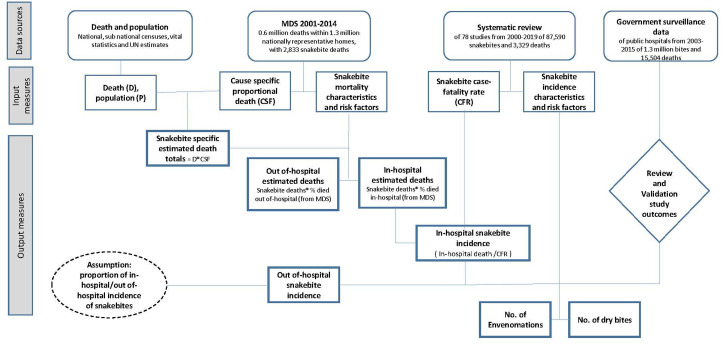
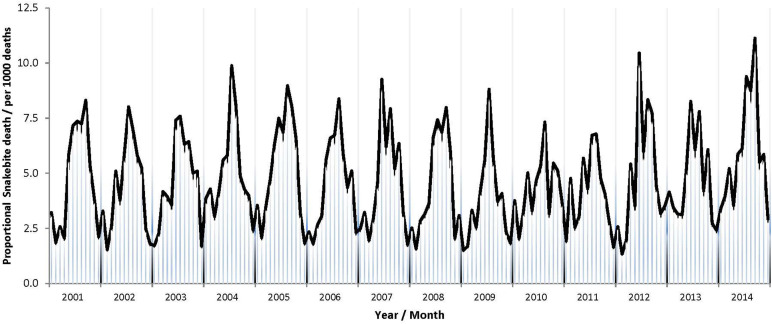
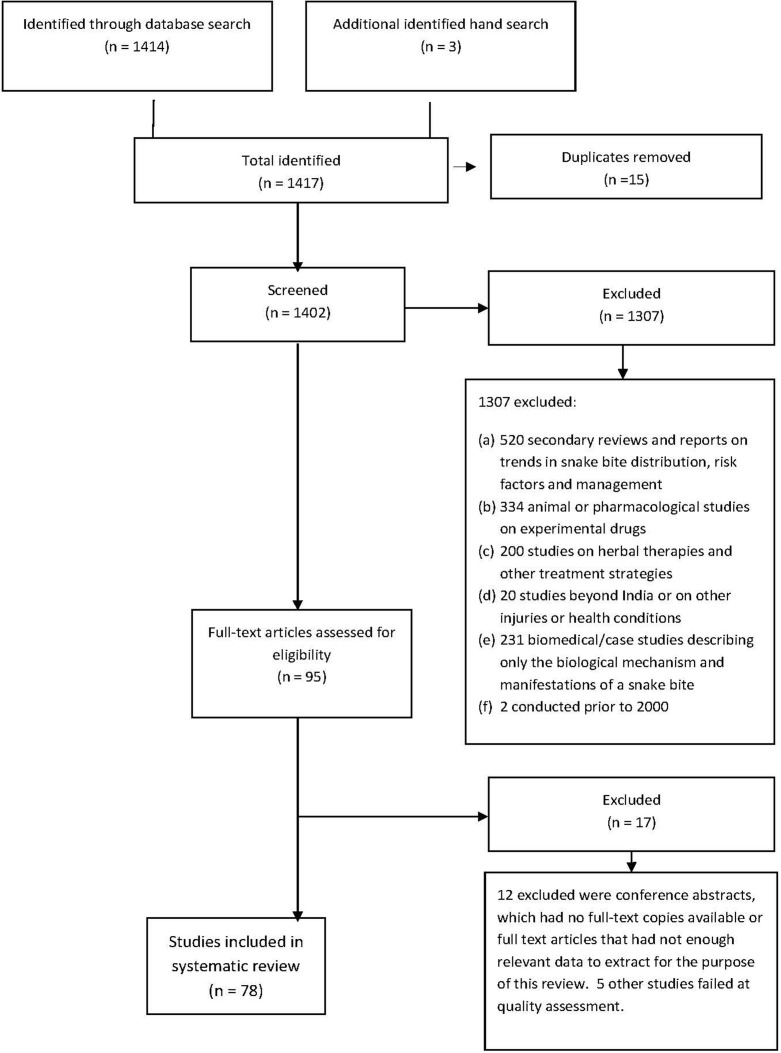
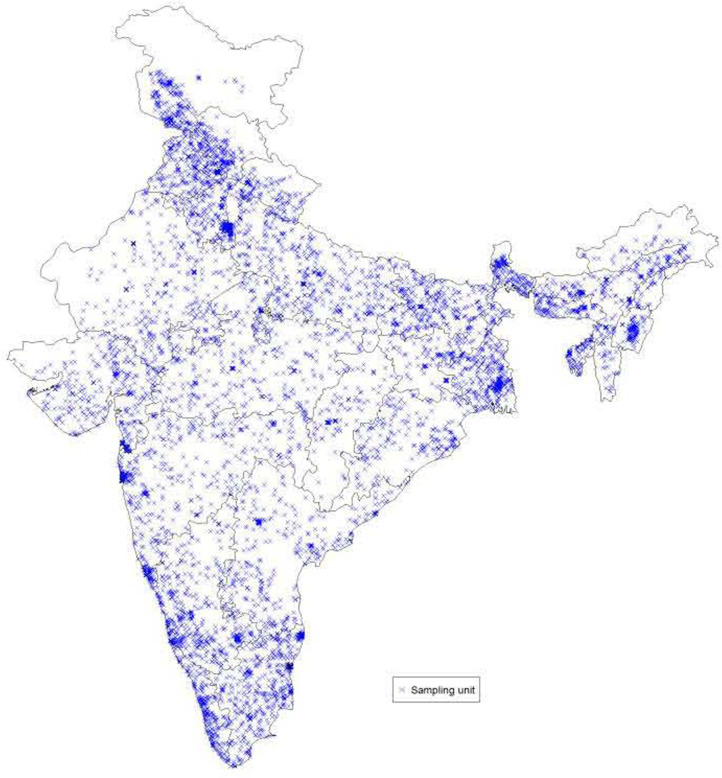
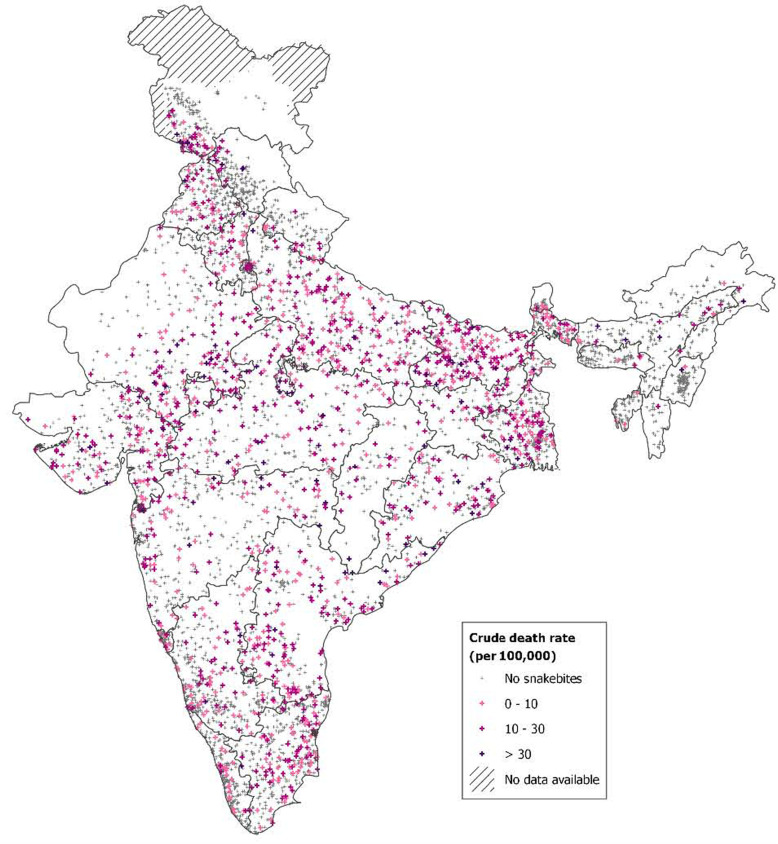
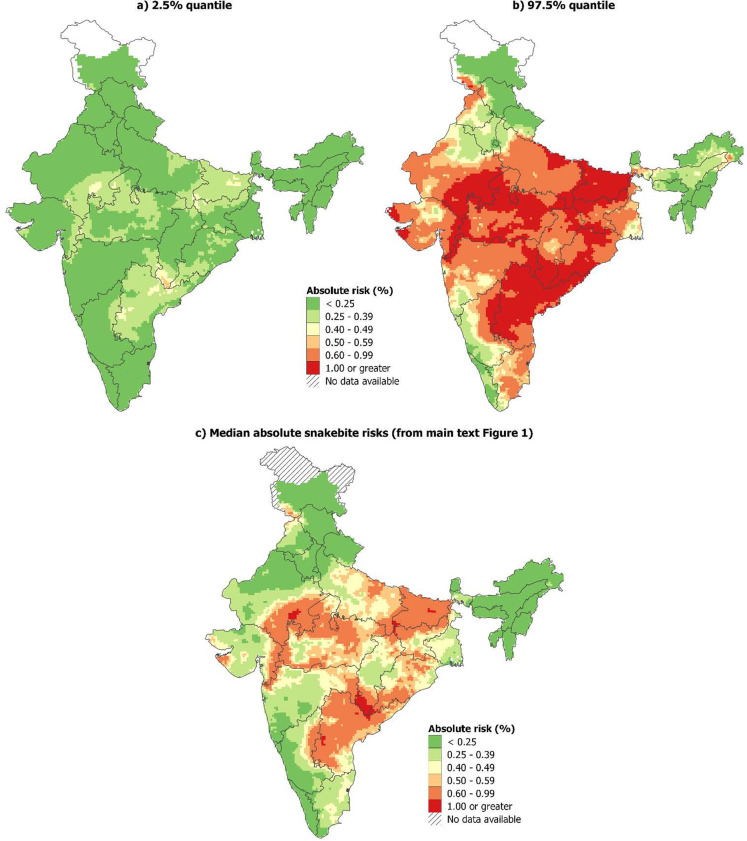
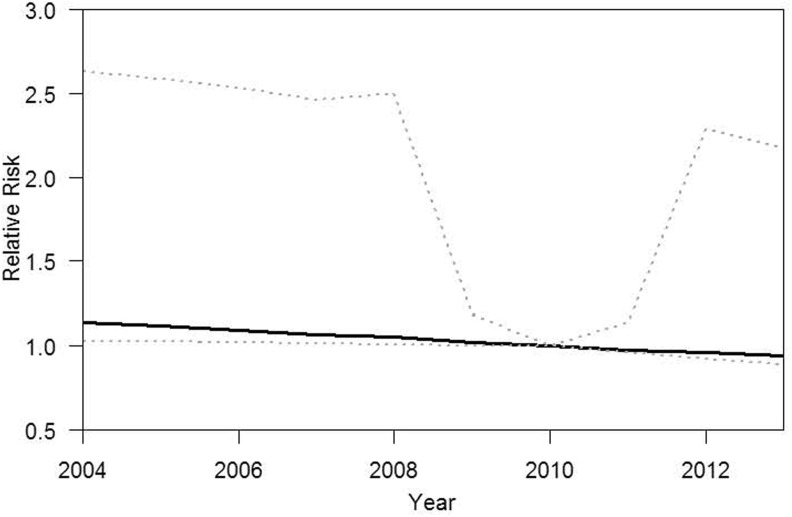
The World Health Organization call to halve global snakebite deaths by 2030 will require substantial progress in India. We analyzed 2833 snakebite deaths from 611,483 verbal autopsies in the nationally representative Indian Million Death Study from 2001 to 2014, and conducted a systematic literature review from 2000 to 2019 covering 87,590 snakebites. We estimate that India had 1.2 million snakebite deaths (average 58,000/year) from 2000 to 2019. Nearly half occurred at ages 30-69 years and over a quarter in children < 15 years. Most occurred at home in the rural areas. About 70% occurred in eight higher burden states and half during the rainy season and at low altitude. The risk of an Indian dying from snakebite before age 70 is about 1 in 250, but notably higher in some areas. More crudely, we estimate 1.11-1.77 million bites in 2015, of which 70% showed symptoms of envenomation. Prevention and treatment strategies might substantially reduce snakebite mortality in India.

Keywords: India; antivenom envenomation snake; case fatality; epidemiology; global health; human; million death study; mortality risk incidence; snakebite.


Conflict of interest statement

WS, DW, RW, GM, RR, SF, RB, PS, KP, MB, PB No competing interests declared, PJ Reviewing editor, eLife

Figures

Figure 1.
Figure 1.. Spatial distribution of snakebite mortality risk in India for 2004-13.
Note: About 0.33% of the Indian population lived in areas with an absolute risk of 1% or greater of dying from snakebite before age 70 years, and 21% lived in areas with absolute risk of 0.6% or higher. Population estimates used the Gridded Population of the World version 4 for year 2015 (Center for International Earth Science Information Network - CIESIN - Columbia University, 2015). Further details of statistical method and stochastic uncertainties of spatial mortality risk pertaining to these estimates are explained in Appendix 3.
Figure 2.
Figure 2.. Predicted daily snakebite deaths from analysis of seasonality observed in 2001-2014 (Panel A) and snakebite crude death rates by altitude in meters in 2004-2013 (Panel B).
Notes: The daily snakebite totals are a composite of all study years from 2001 to 2014. The crude death rates by elevation use the RGI’s Sample Registration System population as denominators, and hence are generally lower than the overall rates we apply to the whole of India (using the United Nations death totals, which has the benefit of taking into account undercounts in the SRS data [Menon et al., 2019]). However, the relationship of crude death rates with elevation is unaffected by this procedure.
Figure 3.
Figure 3.. Characteristics of snakebites from analysis of 88,000 snakebite events in the published literature.
Appendix 1—figure 1.
Appendix 1—figure 1.. The conceptual overview of role of data sources, input measures and study outcomes.
Appendix 1—figure 2.
Appendix 1—figure 2.. Observed seasonality of snakebite deaths in study data in 2001-2014.
Note: Proportional snakebite mortality (monthly snakebite deaths to all causes deaths) reported from the 2001 to 2014 rounds of RGI-MDS.
Appendix 2—figure 1.
Appendix 2—figure 1.. Study selection, inclusion and exclusion details.
Appendix 3—figure 1.
Appendix 3—figure 1.. Locations of geocoded sampling units from the Sample Registration System (SRS) in 2004–13, excluding sampling units for islands.
Appendix 3—figure 2.
Appendix 3—figure 2.. Snakebite crude rates in 2004–13.
Appendix 3—figure 3.
Appendix 3—figure 3.. 95% credible intervals of the absolute risks and median absolute risks of snakebite deaths in India, 2004-13.
(a-b) 95% credible interval of the absolute risk estimates, (c) median absolute snakebite risks (from main text Figure 1).
Appendix 3—figure 4.
Appendix 3—figure 4.. Non-linear effects of year estimated using second order random walk.

References

    1. Adhisivam B, Mahadevan S. Snakebite envenomation in India: a rural medical emergency. Indian Pediatric. 2006;43:553–554. - PubMed
    1. Ahmad Z, Hussain T. Snake bites profile in Haldia, Purba Midnapur, West Bengal. Indian Journal of Forensic Medicine and Toxicology. 2013;7:243–245.
    1. Ahmed SM, Qureshi UA, Rasool A, Charoo BA, Iqbal Q. Snake bite envenomation in children in Kashmir. Indian Pediatric. 2011;48:66–67. - PubMed
    1. Ahmed SM, Nadeem A, Islam MS, Agarwal S, Singh L. Retrospective analysis of snake victims in Northern India admitted in a tertiary level institute. Journal of Anaesthesiology Clinical Pharmacology. 2012;28:45. doi: 10.4103/0970-9185.92434. - DOI - PMC - PubMed
    1. Aleksandrowicz L, Malhotra V, Dikshit R, Gupta PC, Kumar R, Sheth J, Rathi SK, Suraweera W, Miasnikof P, Jotkar R, Sinha D, Awasthi S, Bhatia P, Jha P. Performance criteria for verbal autopsy-based systems to estimate national causes of death: development and application to the indian million death study. BMC Medicine. 2014;12:21. doi: 10.1186/1741-7015-12-21. - DOI - PMC - PubMed

Publication types

Grants and funding