

Molecular MRI of the Immuno-Metabolic Interplay in a Rabbit Liver Tumor Model: A Biomarker for Resistance Mechanisms in Tumor-targeted Therapy?
- PMID: 32633675
- PMCID: PMC7434651
- DOI: 10.1148/radiol.2020200373
Molecular MRI of the Immuno-Metabolic Interplay in a Rabbit Liver Tumor Model: A Biomarker for Resistance Mechanisms in Tumor-targeted Therapy?
Abstract
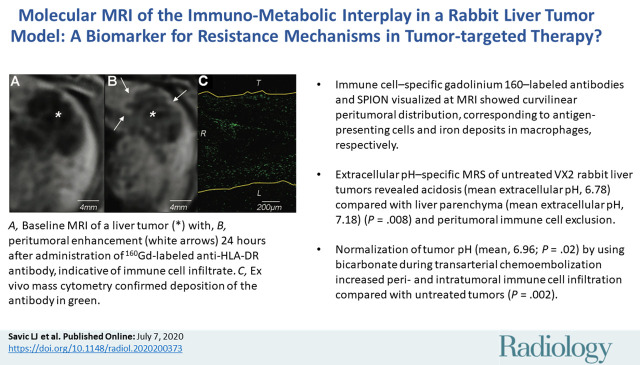
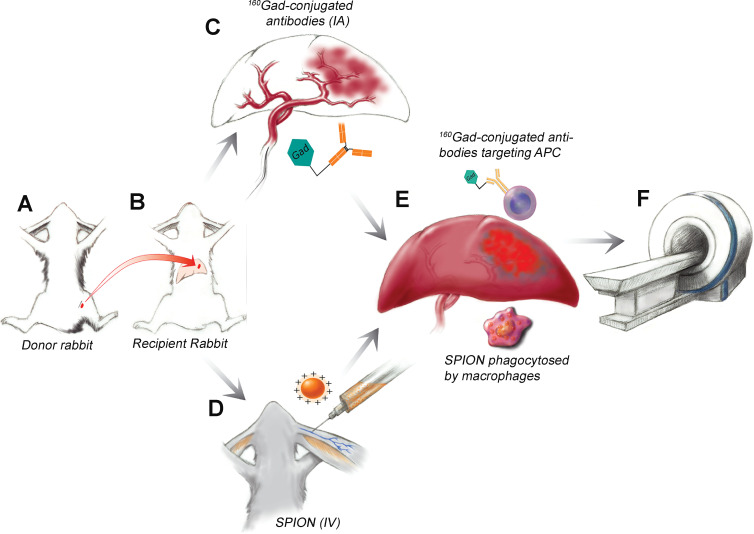
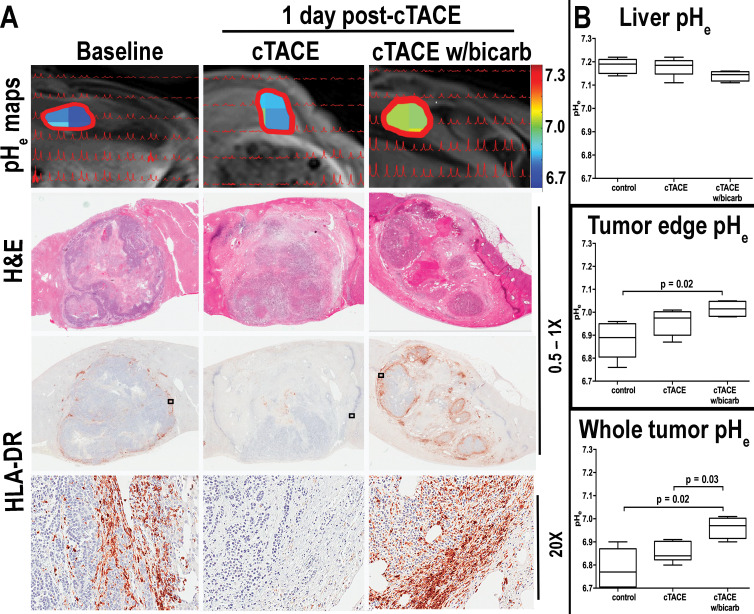
Background The immuno-metabolic interplay has gained interest for determining and targeting immunosuppressive tumor micro-environments that remain a barrier to current immuno-oncologic therapies in hepatocellular carcinoma. Purpose To develop molecular MRI tools to reveal resistance mechanisms to immuno-oncologic therapies caused by the immuno-metabolic interplay in a translational liver cancer model. Materials and Methods A total of 21 VX2 liver tumor-bearing New Zealand white rabbits were used between October 2018 and February 2020. Rabbits were divided into three groups. Group A (n = 3) underwent intra-arterial infusion of gadolinium 160 (160Gd)-labeled anti-human leukocyte antigen-DR isotope (HLA-DR) antibodies to detect antigen-presenting immune cells. Group B (n = 3) received rhodamine-conjugated superparamagnetic iron oxide nanoparticles (SPIONs) intravenously to detect macrophages. These six rabbits underwent 3-T MRI, including T1- and T2-weighted imaging, before and 24 hours after contrast material administration. Group C (n = 15) underwent extracellular pH mapping with use of MR spectroscopy. Of those 15 rabbits, six underwent conventional transarterial chemoembolization (TACE), four underwent conventional TACE with extracellular pH-buffering bicarbonate, and five served as untreated controls. MRI signal intensity distribution was validated by using immunohistochemistry staining of HLA-DR and CD11b, Prussian blue iron staining, fluorescence microscopy of rhodamine, and imaging mass cytometry (IMC) of gadolinium. Statistical analysis included Mann-Whitney U and Kruskal-Wallis tests. Results T1-weighted MRI with 160Gd-labeled antibodies revealed localized peritumoral ring enhancement, which corresponded to gadolinium distribution detected with IMC. T2-weighted MRI with SPIONs showed curvilinear signal intensity representing selective peritumoral deposition in macrophages. Extracellular pH-specific MR spectroscopy of untreated liver tumors showed acidosis (mean extracellular pH, 6.78 ± 0.09) compared with liver parenchyma (mean extracellular pH, 7.18 ± 0.03) (P = .008) and peritumoral immune cell exclusion. Normalization of tumor extracellular pH (mean, 6.96 ± 0.05; P = .02) using bicarbonate during TACE increased peri- and intratumoral immune cell infiltration (P = .002). Conclusion MRI in a rabbit liver tumor model was used to visualize resistance mechanisms mediated by the immuno-metabolic interplay that inform susceptibility and response to immuno-oncologic therapies, providing a therapeutic strategy to restore immune permissiveness in liver cancer. © RSNA, 2020 Online supplemental material is available for this article.
Figures
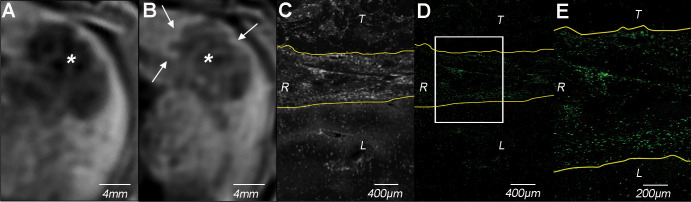
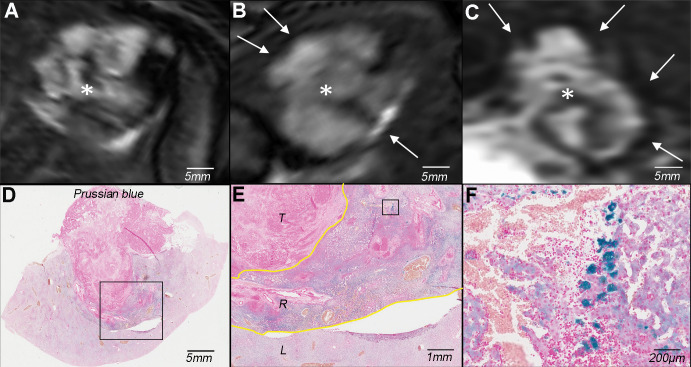
![Molecular imaging of cellular uptake of rhodamine-conjugated superparamagnetic iron oxide nanoparticles (SPIONs) in peritumoral macrophages. A, Baseline T2-weighted fat-suppressed axial spin-echo MRI scan (repetition time msec/echo time msec, 1000/78) of VX2 liver tumor (*). B, Hypointense peritumoral rim demarcation (arrows) on T2-weighted axial MRI scan obtained 24 hours after administration of rhodamine-conjugated SPIONs indicates peritumoral retention. * = tumor. C, Immunofluorescence image of rhodamine on tissue harvested from the same rabbit confirms deposition of SPIONs in the peritumoral rim (outlined by yellow lines). L = liver, R = peritumoral rim, T = tumor. D, Photomicrograph (hematoxylin-eosin [H&E] stain) of VX2 tumor and surrounding liver. E, F, Immunohistochemistry with, E, anti–human leukocyte antigen–DR isotope (HLA-DR) and, F, anti-CD11b antibodies reveals antigen-presenting immune cells and macrophages in the peritumoral rim, respectively.](https://cdn.ncbi.nlm.nih.gov/pmc/blobs/5996/7457944/dc4885b30653/radiol.2020200373.fig4.jpg)
References
-
- Bray F, Ferlay J, Soerjomataram I, Siegel RL, Torre LA, Jemal A. Global cancer statistics 2018: GLOBOCAN estimates of incidence and mortality worldwide for 36 cancers in 185 countries. CA Cancer J Clin 2018;68(6):394–424. - PubMed
-
- Lencioni R, de Baere T, Soulen MC, Rilling WS, Geschwind JF. Lipiodol transarterial chemoembolization for hepatocellular carcinoma: A systematic review of efficacy and safety data. Hepatology 2016;64(1):106–116. - PubMed
-
- JU Marquardt, Saborowski A, Czauderna C, Vogel A. The Changing Landscape of Systemic Treatment of Advanced Hepatocellular Carcinoma: New Targeted Agents and Immunotherapies. Target Oncol 2019;14(2):115–123. - PubMed
Publication types
MeSH terms
Substances
Grants and funding
LinkOut - more resources
Full Text Sources
Medical
Research Materials
Miscellaneous
