. 2020 Aug 6;5(15):e138724.
doi: 10.1172/jci.insight.138724.

The value of genotypic and imaging information to predict functional and structural outcomes in ADPKD

Affiliations

The value of genotypic and imaging information to predict functional and structural outcomes in ADPKD

Sravanthi Lavu et al. JCI Insight. .

Abstract

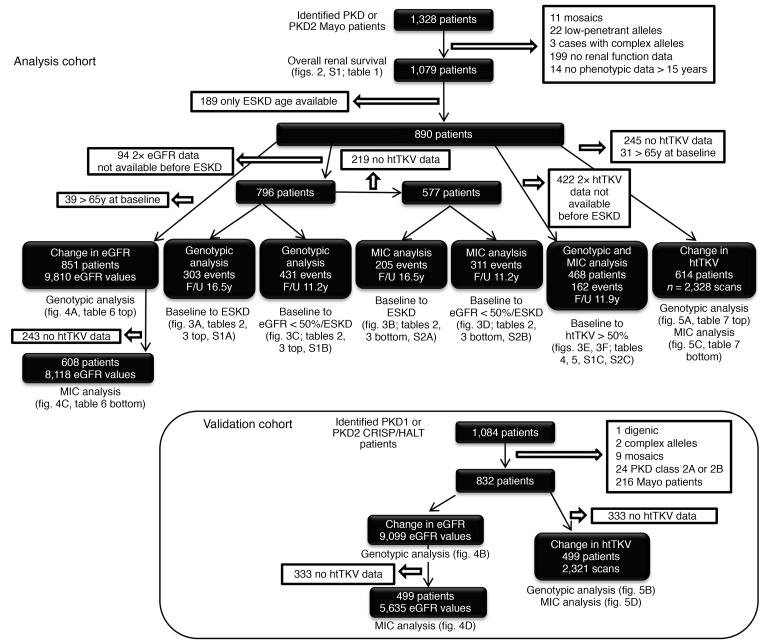
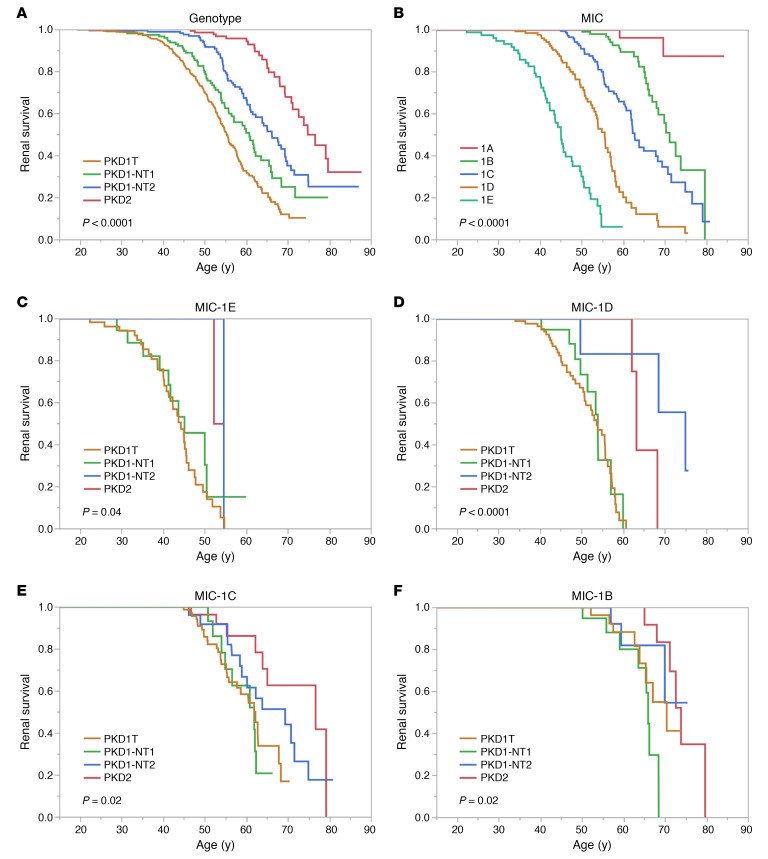
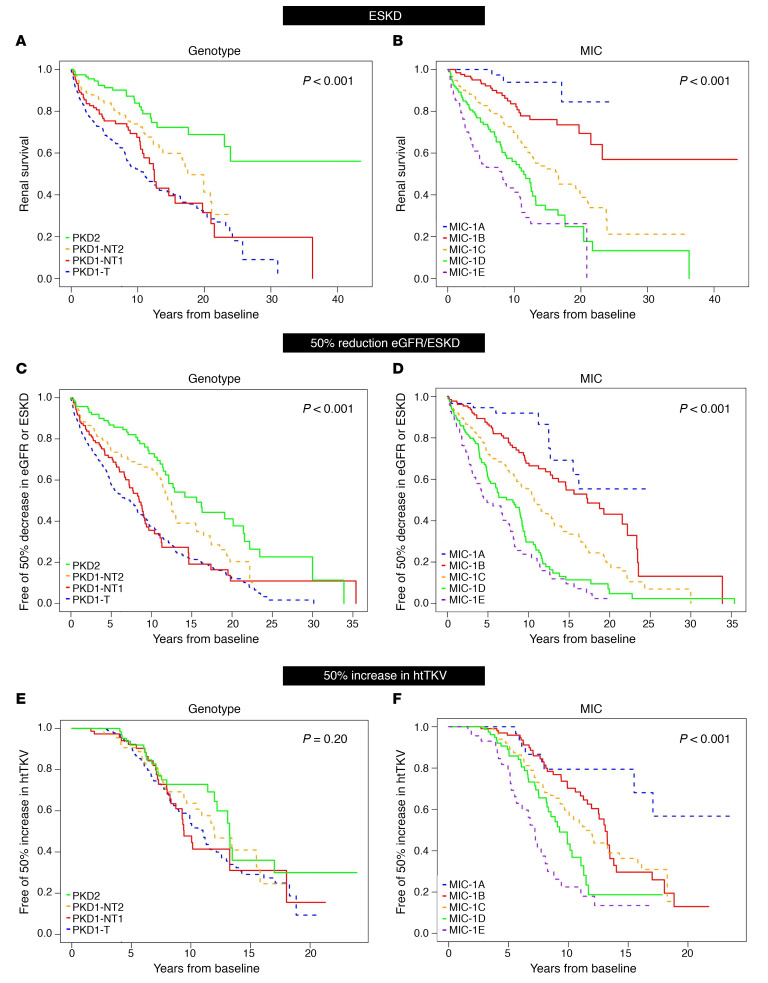
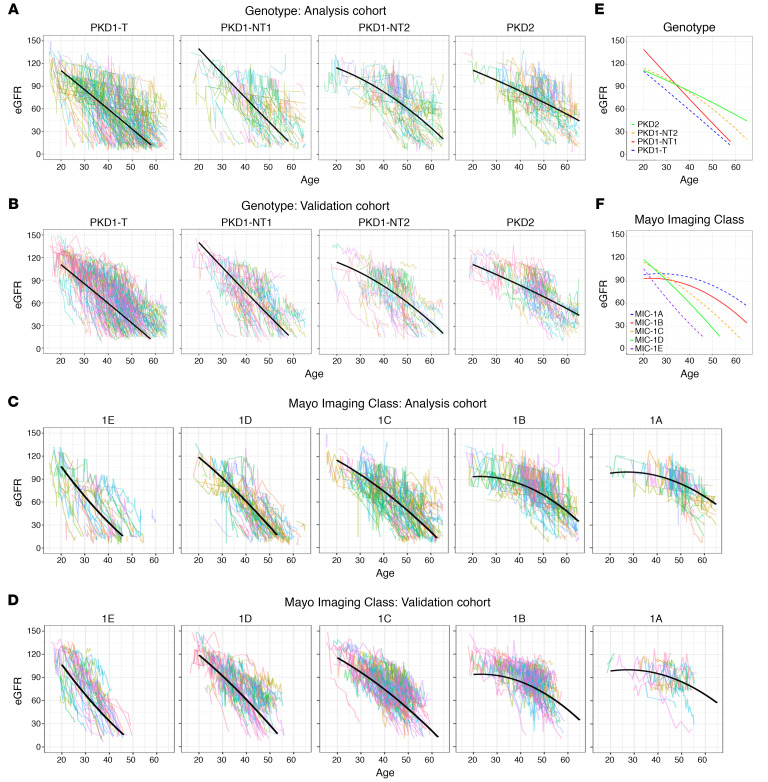
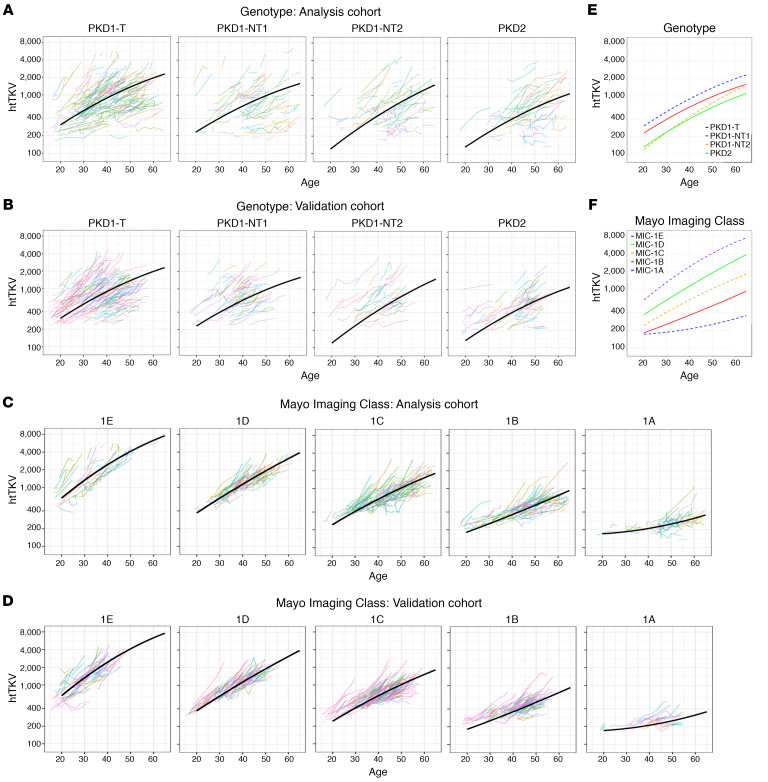
BACKGROUNDA treatment option for autosomal dominant polycystic kidney disease (ADPKD) has highlighted the need to identify rapidly progressive patients. Kidney size/age and genotype have predictive power for renal outcomes, but their relative and additive value, plus associated trajectories of disease progression, are not well defined.METHODSThe value of genotypic and/or kidney imaging data (Mayo Imaging Class; MIC) to predict the time to functional (end-stage kidney disease [ESKD] or decline in estimated glomerular filtration rate [eGFR]) or structural (increase in height-adjusted total kidney volume [htTKV]) outcomes were evaluated in a Mayo Clinic PKD1/PKD2 population, and eGFR and htTKV trajectories from 20-65 years of age were modeled and independently validated in similarly defined CRISP and HALT PKD patients.RESULTSBoth genotypic and imaging groups strongly predicted ESKD and eGFR endpoints, with genotype improving the imaging predictions and vice versa; a multivariate model had strong discriminatory power (C-index = 0.845). However, imaging but not genotypic groups predicted htTKV growth, although more severe genotypic and imaging groups had larger kidneys at a young age. The trajectory of eGFR decline was linear from baseline in the most severe genotypic and imaging groups, but it was curvilinear in milder groups. Imaging class trajectories differentiated htTKV growth rates; severe classes had rapid early growth and large kidneys, but growth later slowed.CONCLUSIONThe value of imaging, genotypic, and combined data to identify rapidly progressive patients was demonstrated, and reference values for clinical trials were provided. Our data indicate that differences in kidney growth rates before adulthood significantly define patients with severe disease.FUNDINGNIDDK grants: Mayo DK058816 and DK090728; CRISP DK056943, DK056956, DK056957, and DK056961; and HALT PKD DK062410, DK062408, DK062402, DK082230, DK062411, and DK062401.

Keywords: Genetic diseases; Genetics; Nephrology.


Conflict of interest statement

Conflict of interest: ABC reports grants and/or other activities with Reata, Sanofi, Otsuka, and Jannsen. RDP reports grants and/or other activities with Otsuka, Sanofi, Reata, Kadmon, and Palladio. MM reports grants and/or other activities with Otsuka, Kadmon, and Reata. KTB reports grants and/or other activities with Kadmon, Otsuka, and Sanofi. ASLY reports grants and/or other activities with Regulus, Otsuka, Sanofi, and Calico. VET reports grants and/or other activities with Otsuka, Palladio, Mironid, Sanofi, Blueprint Medicines, and Reata. PCH reports grants and/or other activities with Otsuka, Mitobridge, Regulus, Vertex, and Navitor.

Figures

Figure 1
Figure 1. Flowchart showing the selection and details of the Analysis and Validation cohorts.
The Analysis Cohort consists of Mayo patients, and the Validation Cohort is derived from the CRISP and HALT PKD study populations. All included patients had a PKD1 or PKD2 mutation, with atypical genotypes removed, as indicated. Patients with an atypical MIC or incomplete data were also removed. The chart also shows the selection, size, available data, and average follow-up time for each of the analyses described in the paper, with corresponding data tables and figures indicated. Comparison of the baseline characteristics of the 2 cohorts are shown in Supplemental Table 3.
Figure 2
Figure 2. Unadjusted Kaplan-Meier renal survival analysis.
(A and B) Unadjusted Kaplan-Meier renal survival analysis from birth (data shown from 15y) analyzing genotype (A) and Mayo Imaging Class (MIC; B), with P values shown. The median age at ESKD is: 55.3y, 60.8y, 66.2y, and 74.4y for PKD1T, PKD1NT1, PKD1NT2, and PKD2, respectively (A) (n = 1079, P < 0.0001); and 45.1y, 55.6y, 62.8y and 71.2y for MIC-1E to -1B, respectively, with less than 20% of MIC-1A patients experiencing ESKD (B) (n = 646, P < 0.0001). (C–F) Similar Kaplan-Meier renal survival analysis from birth analyzes the 4 MICs: MIC-1E (C), -1D (D), 1-C (E), and -1B (F), separated by the 4 genotypic groups. The median age at ESKD for the MIC-1E genotypic groups: PKD1T, PKD1NT1, and PKD1NT2 is 44.3y, 45.1y, and 54.5y, respectively, with less than 50% of PKD2 experiencing ESKD (C, n = 80; P = 0.04); for the MIC-1D genotypic groups, 53.7y, 53.9y, 74.9y, and 63.1y for PKD1T, PKD1NT1, PKD1NT2, and PKD2, respectively (D, n = 140, P < 0.0001); MIC-1C genotypic groups, 61.9y, 61.8y, 69.4y, and 76.6y for PKD1T, PKD1NT1, PKD1NT2, and PKD2, respectively (E, n = 198, P < 0.02); and MIC-1B genotypic groups, 70.3y, 66.0y, and 73.9y for PKD1T, PKD1NT1, and PKD2, respectively, with less than 50% of PKD1NT2 experiencing ESKD (F, n = 156, P < 0.02). Since very few MIC-1A patients reached ESKD (B), we did not plot this class divided by genotypic group.
Figure 3
Figure 3. Unadjusted Kaplan-Meier analysis from baseline of functional and structural kidney disease endpoints.
(A–F) Unadjusted Kaplan-Meier renal survival analysis (A and B), eGFR < 50%/ESKD (C and D), or 50% increase in htTKV (E and F) from baseline analyzing genotype (A, C, and E) and MIC (B, D, and F), with P values shown. Median years to ESKD from baseline are: 11.0y, 12.5y, and 17.5y for PKD1T, PKD1NT1, and PKD1NT2, respectively, with less than 50% of PKD2 patients reaching ESKD throughout follow-up (A, n = 796, P < 0.001) and 8.1y, 11.4y, and 16.4y for MIC-1E, -1D, and -1C, respectively, with less than 50% of -1B and -1A patients reaching ESKD throughout follow-up (B, n = 577, P < 0.001). Median years to a eGFR < 50%/ESKD from baseline are: 7.3y, 8.5y, 12.5y, and 15.6y for PKD1T, PKD1NT1, PKD1NT2, and PKD2, respectively (C, n = 796, P < 0.001) and 4.9y, 8.1y, 10.7y, and 17.3y for MIC-1E, -1D, -1C, and -1B, respectively, with less than 50% of -1A patients reaching the endpoint (D, n = 577, P < 0.001). Median years to htTKV > 50% from baseline was not significantly different between genotypic groups: 11.0y, 9.4y, 12.0y, and 13.3y for PKD1T, PKD1NT1, PKD1NT2, and PKD2, respectively (E, n = 468, P = 0.20). However, MIC was significant different for the htTKV > 50% endpoint: 7.2y, 9.3y, 11.4y, and 13.1y for MIC-1E, -1D, -1C, and -1B, respectively, with less than 50% of -1A cases reaching the endpoint (F, n = 468, P < 0.001).
Figure 4
Figure 4. Trajectory analysis of eGFR decline for the genotypic and imaging groups.
(A–D) Trajectory plots of eGFR for the 4 genotypic groups in the Analysis (A) and the Validation (B) cohorts and the 5 MICs in the Analysis (C) and Validation (D) cohorts. Fitted average eGFR trajectories from the polynomial model determined from the Analysis Cohort are plotted for each genotypic (A) and imaging (C) group, with the same trajectory plotted on the corresponding data from the Validation Cohort (B and D). (E and F) The summary of these plots for the genotypic (E) and MIC (F) groups are also shown. The slope at the average age for each genotypic group is: –2.62, –3.19, –2.34, and –1.55 mL/min/1.73m2/y for PKD1T, PKD1NT1, PKD1NT2, and PKD2, respectively (E), and for the MICs: –3.27, –3.34, –2.60, –1.73, –1.33 mL/min/1.73m2/y for MIC-1E, -1D, -1C, -1B, and -1A, respectively (F). However, because of the curvilinear trajectories for many groups, the rate of decline varies over time (Table 6).
Figure 5
Figure 5. Trajectory analysis of htTKV increase for the genotypic and imaging groups.
(A–D) Trajectory plots of htTKV for the 4 genotypic groups in the Analysis (A) and the Validation (B) cohorts and for the 5 MICs in the Analysis (C) and Validation (D) cohorts. Fitted average htTKV trajectories from the polynomial model determined from the Analysis Cohort are plotted for each genotypic (A) and imaging group (C), with the same trajectory plotted on the corresponding data from the Validation Cohort (B and D). (E and F) The summary of these plots for the genotypic (E) and MIC (F) groups are also shown. The slope at the average age for each genotypic group is: 5.82, 5.08, 7.25, and 5.47 %/y for PKD1T, PKD1NT1, PKD1NT2, and PKD2, respectively (E), and for the MICs: 8.33, 6.96, 5.54, 4.46, 2.10 %/y for MIC-1E, -1D, -1C, -1B and -1A, respectively (F). However, because of the curvilinear trajectories for many groups, the rate of decline varies over time (Table 7).

References

    1. Suwabe T, et al. Epidemiology of Autosomal Dominant Polycystic Kidney Disease in Olmsted County. Clin J Am Soc Nephrol. 2020;15(1):69–79. doi: 10.2215/CJN.05900519. - DOI - PMC - PubMed
    1. Torres VE, Harris PC, Pirson Y. Autosomal dominant polycystic kidney disease. Lancet. 2007;369(9569):1287–1301. doi: 10.1016/S0140-6736(07)60601-1. - DOI - PubMed
    1. Spithoven EM, et al. Renal replacement therapy for autosomal dominant polycystic kidney disease (ADPKD) in Europe: prevalence and survival--an analysis of data from the ERA-EDTA Registry. Nephrol Dial Transplant. 2014;29 Suppl 4:iv15–iv25. - PMC - PubMed
    1. [No authors listed]. United States Renal Data System, 2018 USDRS annual data report: Epidemiology of kidney disease in the United States. United States Renal Data System. https://www.usrds.org/2018/view/Default.aspx Accessed July 7, 2020.
    1. [No authors listed] The polycystic kidney disease 1 gene encodes a 14 kb transcript and lies within a duplicated region on chromosome 16. The European Polycystic Kidney Disease Consortium. Cell. 1994;78(4):725. - PubMed

Publication types

MeSH terms

Substances