. 2020 Aug 6;5(15):e134290.
doi: 10.1172/jci.insight.134290.

MEK activation modulates glycolysis and supports suppressive myeloid cells in TNBC

Affiliations

MEK activation modulates glycolysis and supports suppressive myeloid cells in TNBC

Derek A Franklin et al. JCI Insight. .

Abstract

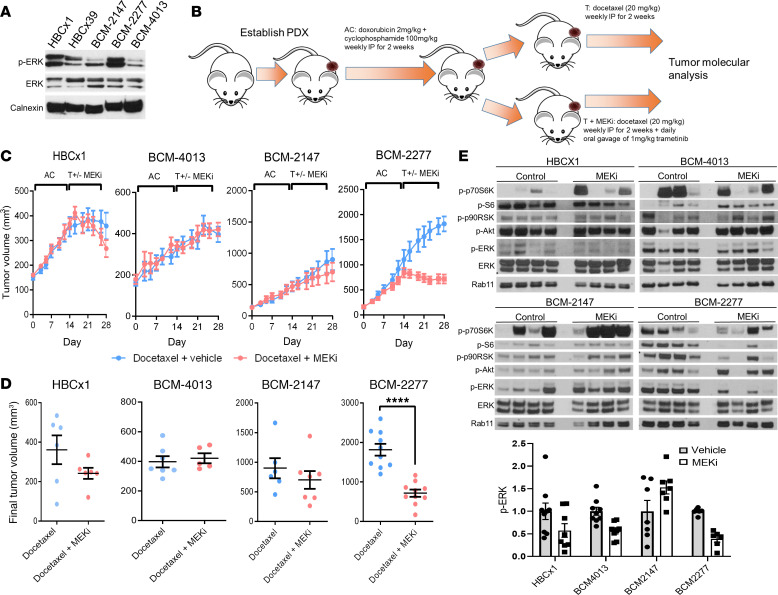
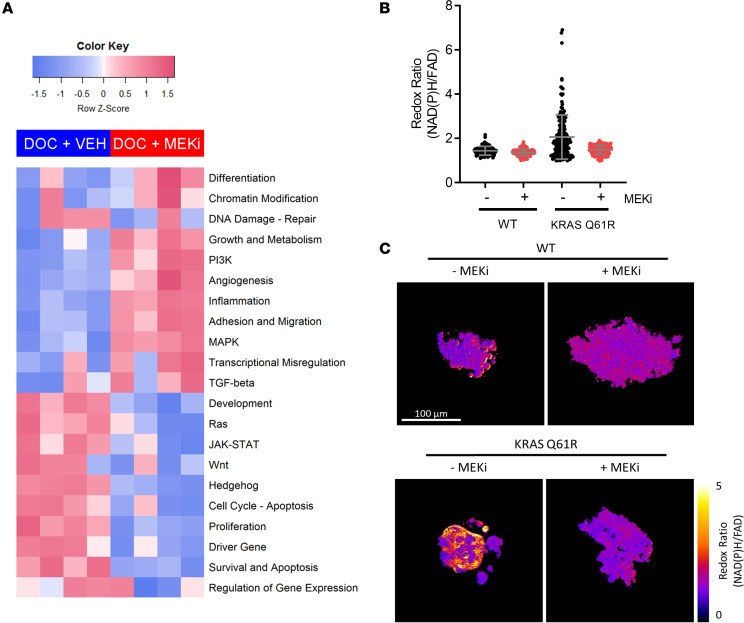
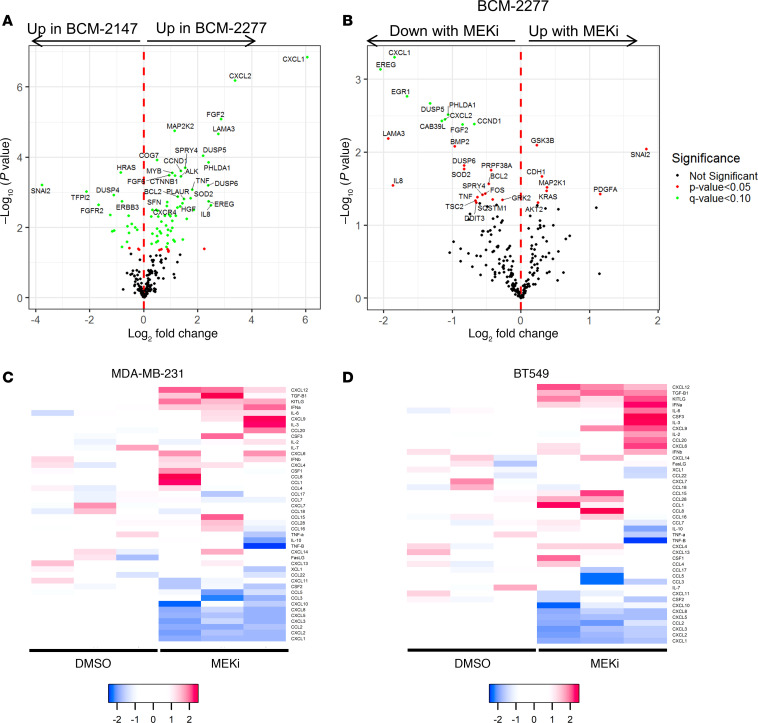
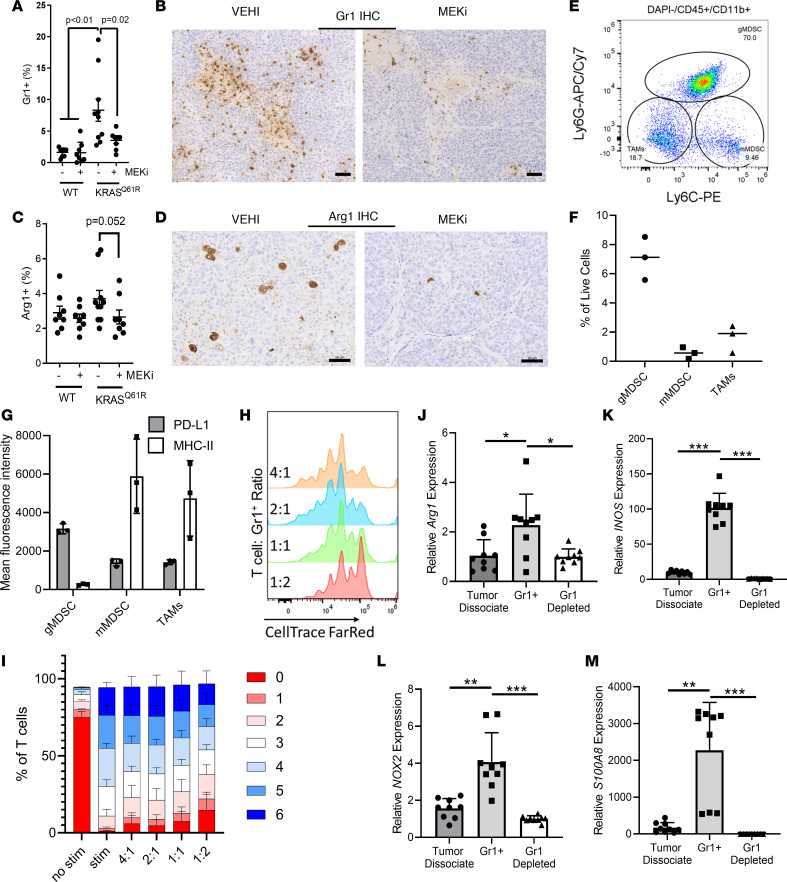
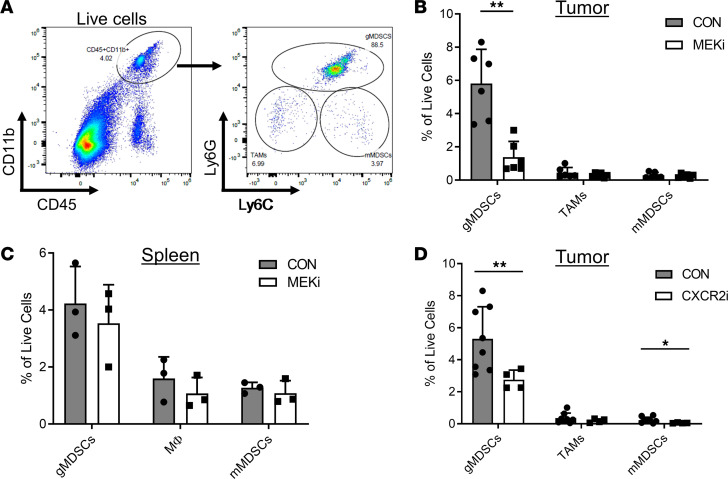
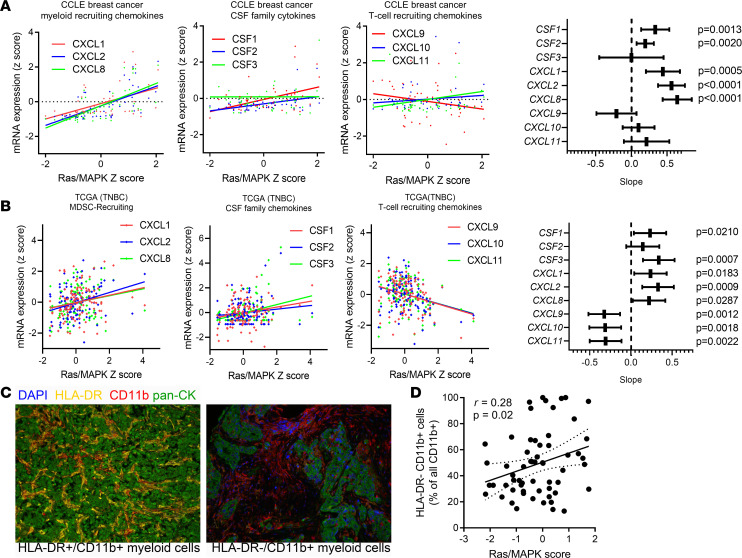
Triple-negative breast cancers (TNBCs) are heterogeneous and aggressive, with high mortality rates. TNBCs frequently respond to chemotherapy, yet many patients develop chemoresistance. The molecular basis and roles for tumor cell-stromal crosstalk in establishing chemoresistance are complex and largely unclear. Here we report molecular studies of paired TNBC patient-derived xenografts (PDXs) established before and after the development of chemoresistance. Interestingly, the chemoresistant model acquired a distinct KRASQ61R mutation that activates K-Ras. The chemoresistant KRAS-mutant model showed gene expression and proteomic changes indicative of altered tumor cell metabolism. Specifically, KRAS-mutant PDXs exhibited increased redox ratios and decreased activation of AMPK, a protein involved in responding to metabolic homeostasis. Additionally, the chemoresistant model exhibited increased immunosuppression, including expression of CXCL1 and CXCL2, cytokines responsible for recruiting immunosuppressive leukocytes to tumors. Notably, chemoresistant KRAS-mutant tumors harbored increased numbers of granulocytic myeloid-derived suppressor cells (gMDSCs). Interestingly, previously established Ras/MAPK-associated gene expression signatures correlated with myeloid/neutrophil-recruiting CXCL1/2 expression and negatively with T cell-recruiting chemokines (CXCL9/10/11) across patients with TNBC, even in the absence of KRAS mutations. MEK inhibition induced tumor suppression in mice while reversing metabolic and immunosuppressive phenotypes, including chemokine production and gMDSC tumor recruitment in the chemoresistant KRAS-mutant tumors. These results suggest that Ras/MAPK pathway inhibitors may be effective in some breast cancer patients to reverse Ras/MAPK-driven tumor metabolism and immunosuppression, particularly in the setting of chemoresistance.

Keywords: Breast cancer; Immunology; Oncology.


Conflict of interest statement

Conflict of interest: SC and JGJ are employees of Xentech. JB, JOB, and CV are employees of Navigate BioPharma Services, Inc. GG and DH are employees of NanoString Technologies. MTL is a founder and limited partner in StemMed Ltd. and a founder and manager in StemMed Holdings, its general partner. He is also a founder of, and equity holder in, Tvardi Therapeutics Inc. JMB receives research support from Genentech/Roche, Bristol Myers Squibb, and Incyte Corporation; has received consulting/expert witness fees from Novartis; and is an inventor on provisional patents US15/376,276 and US16/355,513 regarding immunotherapy targets and biomarkers in cancer.

Figures

Figure 1
Figure 1. Therapeutic and transcriptional response of TNBC PDX models to standard chemotherapy or standard chemotherapy with MEK inhibition.
(A) Representative Western blot of untreated tumors from PDX models. (B) Schematic for treatment of PDX models. (C) Tumor growth curves for PDX models. (n = 5–10 per condition.) AC, adriamycin (doxorubicin) and cyclophosphamide; T, taxane (docetaxel). (D) Final tumor volumes at 28 days. (n = 5–10 per condition.) P value represents 2-sample 2-tailed t test. (E) Western blot of representative treated tumors from C and D. ****P < 0.0001.
Figure 2
Figure 2. Metabolic and inflammatory phenotypes result from KRAS activation and are abrogated by MEK inhibition.
(A) Gene set analysis of BCM-2277 tumors treated with ACdocetaxel + vehicle or ACdocetaxel + trametinib. Signature scores were calculated and visualized using the nSolver package (NanoString). (n = 4.) (B) Single-cell–level optical metabolic imaging of tumor organoids derived from BCM-2147 (KRASWT) and BCM-2277 (KRASQ61R) tumors, treated for 72 hours in the presence of 50 nM trametinib or DMSO control. (n > 75.) (C) Representative metabolic imaging of organoids from B.
Figure 3
Figure 3. Unique transcriptional patterns associated with a rare KRAS mutation in TNBC PDXs.
(A) Volcano plots of changes in gene expression between control group BCM-2277 and BCM-2147 PDX model samples. Genes are color-coded red if adjusted (FDR) P < 0.05, green if both FDR < 0.05 and log2 fold change > 1. (B) Volcano plots of changes in gene expression between control and trametinib-treated BCM-2277 samples. Genes are labeled as in A. (C and D) NanoString RNA analysis with a custom cytokine panel for relative gene expression (log2) in MDA-MB-231 (C) and BT549 (D) cells treated ± MEKi for 24 hours in vitro. (n = 3.)
Figure 4
Figure 4. Myeloid recruitment to TNBC is mediated by Ras/MEK-dependent CXCL1/2 expression.
(A) Quantification of Gr1+ myeloid cells in the tumor microenvironment in BCM-2147 (KRASWT) and BCM-2277 (KRASQ61R) tumors after treatment with AC/docetaxel + vehicle (VEHI) or AC/docetaxel + trametinib (MEKi). (n = 8–10.) Identified P values represent Tukey’s post hoc comparisons following 1-way ANOVA (P < 0.0001). (B) Representative images of Gr1+ cells from BCM-2277 VEHI- and MEKi-treated tumors (Scale bar: 50 μm). (C) Quantification of Arg1+ myeloid cells in the tumor microenvironment in BCM-2147 (KRASWT) and BCM-2277 (KRASQ61R) tumors after treatment with AC/docetaxel + vehicle (VEHI) or AC/docetaxel + trametinib (MEKi). (n = 8–10.) One-way ANOVA was nonsignificant. P value represents a 2-sample, 1-tailed t test between the MEKi and control arms of the KRASQ61R model. (D) Representative images of Arg1+ cells from BCM-2277 VEHI- and MEKi-treated tumors. (Scale bar: 50 μm.) (E) Flow cytometry analysis of Ly6C/Ly6G expression in untreated BCM-2277 (KRASQ61R) tumors, gated on DAPICD45+CD11b+. mMDSC, monocytic MDSC. (F) Relative percentages of 3 populations of myeloid cells as defined in E among 3 tumors. (G) Mean fluorescence intensity of PD-L1 and MHC-II (IA-IE) in the 3 myeloid populations in E. (H) T cell proliferation after 72 hours of coculture with Gr1+ cells and CD3/CD28 bead stimulation measured by CellTrace Far Red fluorescence. (I) Distribution of T cell proliferation in 72-hour cocultures with Gr1+ cells across 3 independent experiments. (JM) RNA isolated from tumor dissociates, Gr1+ cells, and Gr1-depleted dissociates was probed for Arg1, INOS, NOX2, and S100A8 by qRTPCR (n = 3).
Figure 5
Figure 5. Inhibition of MEK or CXCR2 reduces gMDSC recruitment to tumors.
(A) Flow cytometry gating strategy for MDSCs and macrophages. (B) BCM-2277 tumor–bearing mice were treated daily with MEKi before flow cytometry analysis of MDSCs and tumor-associated macrophages (TAMs) within tumor dissociates. (n = 6.) (C) Flow cytometry analysis for MDSCs and macrophages within the spleens of MEKi-treated mice. (D) BCM-2277 tumor–bearing mice were treated daily with CXCR2i (SB225002) before flow cytometry analysis of MDSCs and TAMs within tumor dissociates. (n = 8 CON, and n = 4 CXCR2i.) *P < 0.05; **P < 0.01.
Figure 6
Figure 6. Association of MEK activation with CXCR1/CXCR2 ligands in cancer cell lines and human breast tumors.
(A) Correlation of select cytokine mRNAs with the Ras/MAPK pathway activation gene signature score across 50 breast cancer cell lines in the CCLE. CXCL1, CXCL2, CSF1, CSF2, and CXCL8 gene expression were all significantly associated with Ras/MAPK activity (P < 0.0001 for all), while CXCR3 (T cell–recruiting) chemokines were not associated with Ras/MAPK activity. (B) CXCR1/2 (MDSC-recruiting) chemokines were positively associated with Ras/MAPK activation in human TNBC (TCGA). CSF family members 1 and 3 were positively associated with Ras/MAPK activation in human TNBC (TCGA). CXCL9, CXCL10, and CXCL11 (CXCR3 ligands/T cell–recruiting chemokines) were negatively associated with Ras/MAPK activation in human TNBC (TCGA). (C) Representative quantitative immunofluorescence analysis for HLA-DR (shown in yellow), CD11b (red), and pan-cytokeratin (green) with DAPI as nuclear counterstain. Original magnification, ×200. (D) Correlation of Ras/MAPK transcriptional score versus CD11b+HLA-DR (immunosuppressive myeloid cells) expressed as a percentage of all CD11b+ cells across 61 TNBCs after neoadjuvant chemotherapy (6, 21). Data were assessed in tissue microarray format, using the average cell number across 3 independent cores per patient sample.

References

    1. Lehmann BD, et al. Identification of human triple-negative breast cancer subtypes and preclinical models for selection of targeted therapies. J Clin Invest. 2011;121(7):2750–2767. doi: 10.1172/JCI45014. - DOI - PMC - PubMed
    1. Johnson GL, Stuhlmiller TJ, Angus SP, Zawistowski JS, Graves LM. Molecular pathways: adaptive kinome reprogramming in response to targeted inhibition of the BRAF-MEK-ERK pathway in cancer. Clin Cancer Res. 2014;20(10):2516–2522. doi: 10.1158/1078-0432.CCR-13-1081. - DOI - PMC - PubMed
    1. McCubrey JA, et al. Roles of the Raf/MEK/ERK pathway in cell growth, malignant transformation and drug resistance. Biochim Biophys Acta. 2007;1773(8):1263–1284. - PMC - PubMed
    1. Steelman LS, et al. Roles of the Ras/Raf/MEK/ERK pathway in leukemia therapy. Leukemia. 2011;25(7):1080–1094. doi: 10.1038/leu.2011.66. - DOI - PubMed
    1. Sánchez-Muñoz A, et al. Lack of evidence for KRAS oncogenic mutations in triple-negative breast cancer. BMC Cancer. 2010;10:136. - PMC - PubMed

Publication types

MeSH terms