. 2020 Oct;14(10):2678-2695.
doi: 10.1002/1878-0261.12760. Epub 2020 Aug 29.

The Sp1/FOXC1/HOTTIP/LATS2/YAP/β-catenin cascade promotes malignant and metastatic progression of osteosarcoma

Affiliations

The Sp1/FOXC1/HOTTIP/LATS2/YAP/β-catenin cascade promotes malignant and metastatic progression of osteosarcoma

Ke Liu et al. Mol Oncol. 2020 Oct.

Retraction in

Abstract

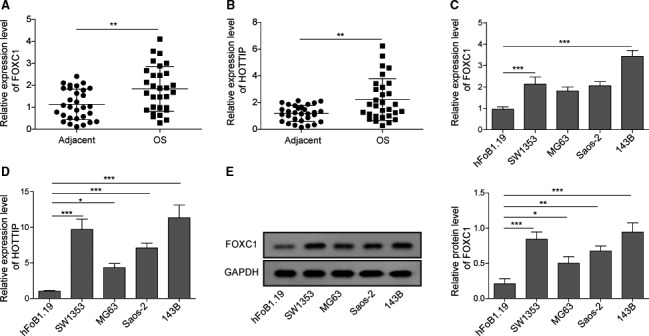
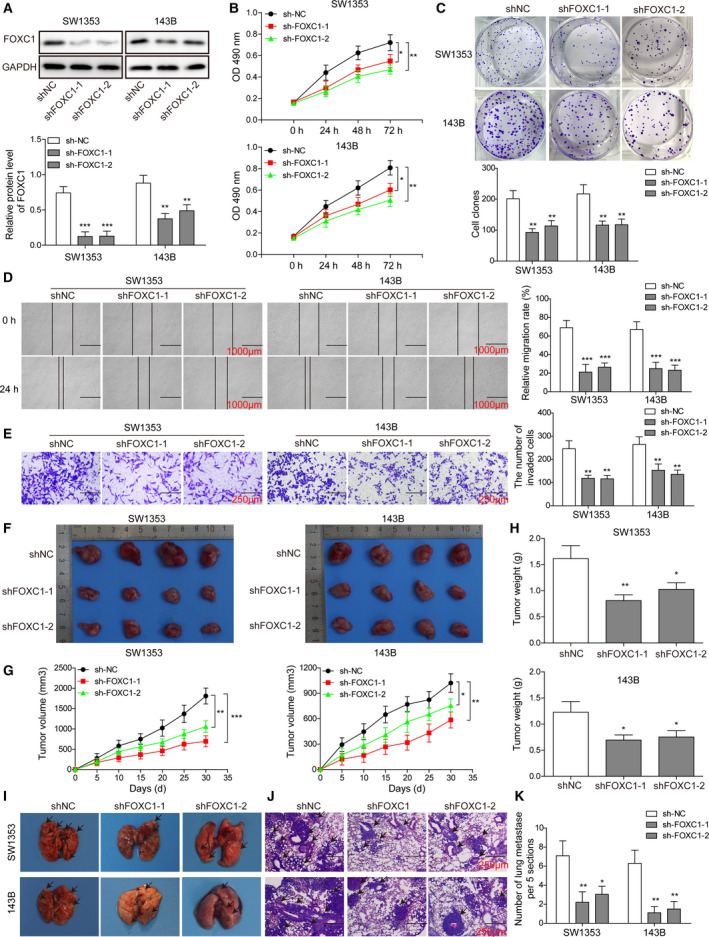
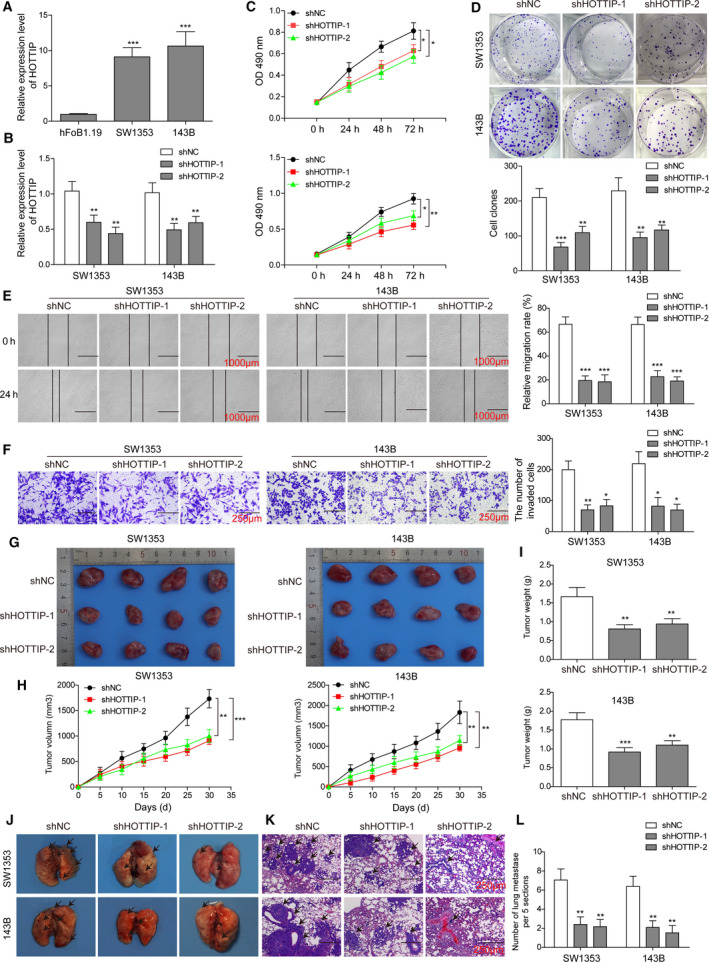
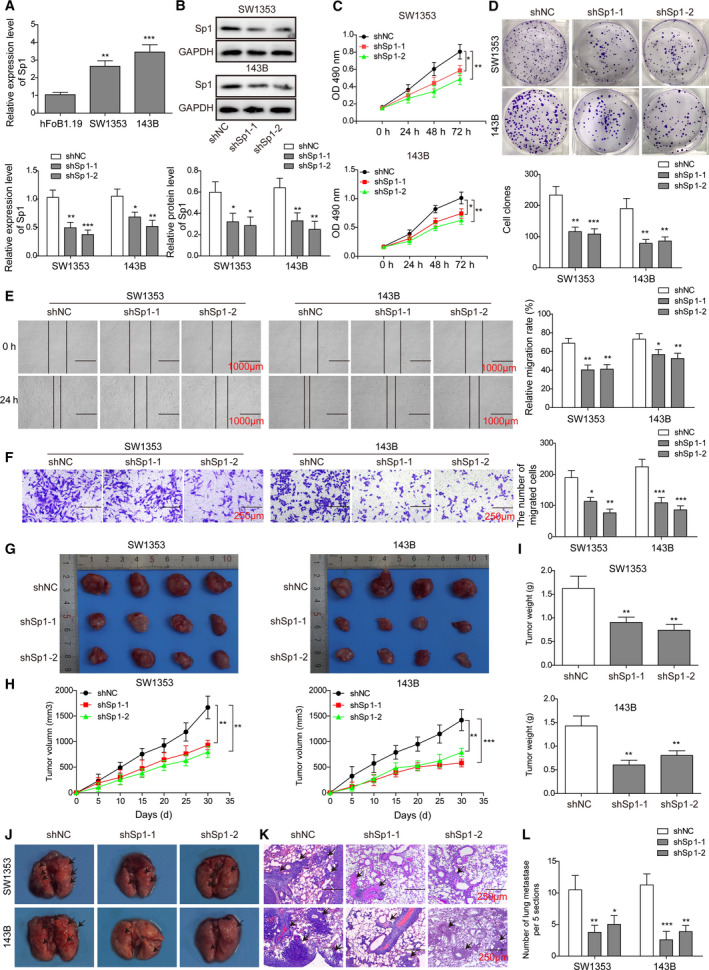
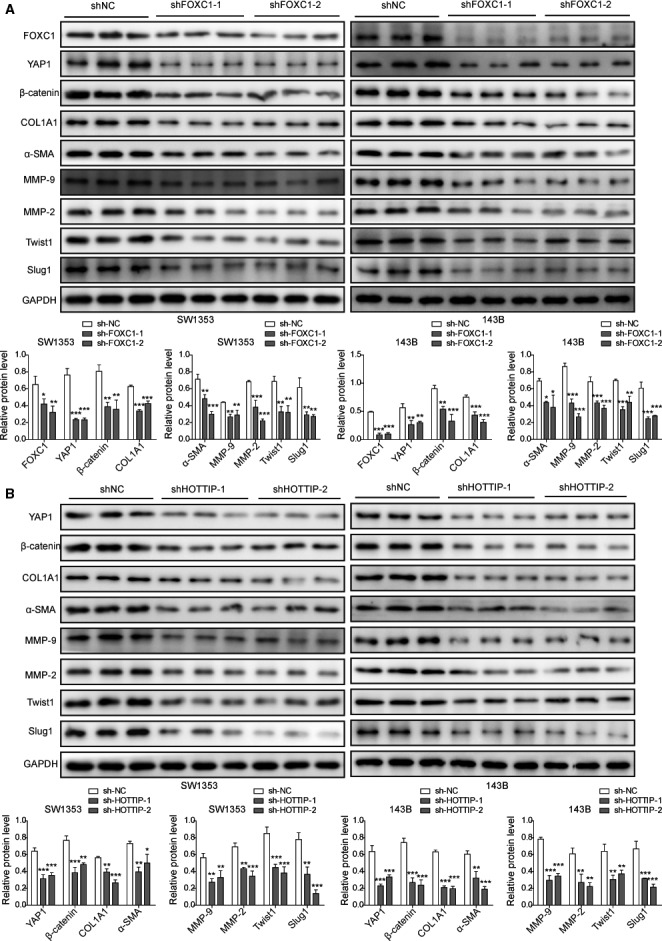
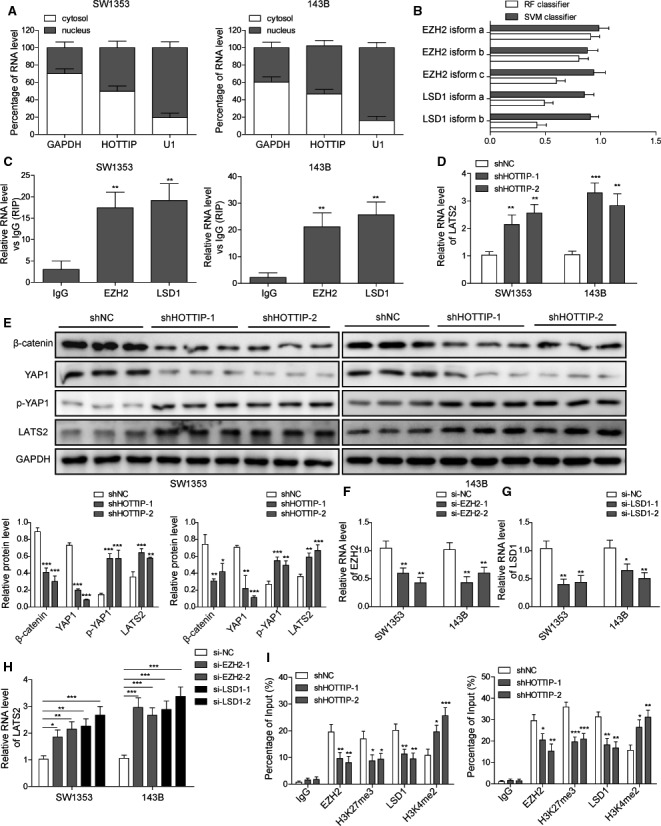
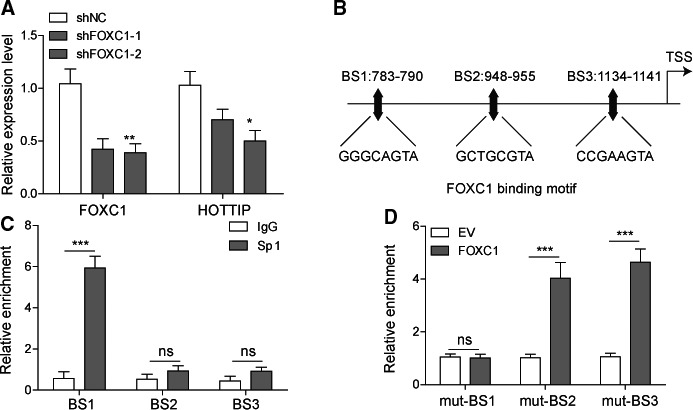
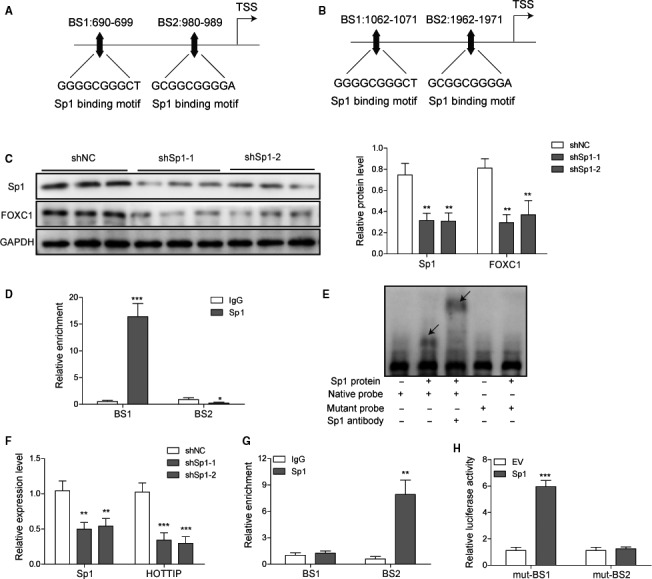
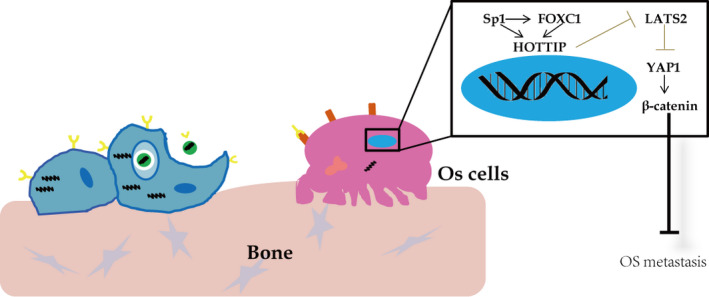
The prognosis for osteosarcoma (OS) is dismal due to the aggressive tumor growth and high incidence of metastasis. The long noncoding RNA human homeobox A transcript at the distal tip (HOTTIP) and the transcription factor forkhead box C1 (FOXC1) present oncogenic activities in OS. Here, we aimed at gaining insights into the underlying mechanisms and their crosstalk. The expression of FOXC1 and HOTTIP in OS tissues or cell lines was examined by real-time PCR (RT-PCR) and western blot. The in vitro effects of FOXC1 or HOTTIP on cell viability, proliferation, migration, invasion, and expression of target genes were examined using MTT, colony-forming assay, wound-healing, Transwell invasion, and western blot, respectively; the in vivo effects were examined using xenograft and experimental metastasis models. Molecular control of HOTTIP on large tumor suppressor 2 (LATS2) or transactivation of FOXC1 or Sp1 on HOTTIP was assessed by combining RNA immunoprecipitation, qRT-PCR, western blot, ChIP, and luciferase assay. Both FOXC1 and HOTTIP were potently up-regulated in OS tissues and cell lines. FOXC1 and HOTTIP essentially maintained viability, proliferation, migration, and invasion of OS cells in vitro and contributed to xenograft growth or lung metastasis in vivo. Mechanistically, HOTTIP recruited enhancer of zeste homolog 2 (EZH2) and lysine-specific demethylase 1 (LSD1) to silence LATS2 and thus activated YAP/β-catenin signaling. Upstream, Sp1 activated FOXC1 and they both directly transactivated HOTTIP. In summary, we showed that the Sp1/FOXC1/HOTTIP/LATS2/YAP/β-catenin cascade presented oncogenic activities in OS cells. Targeting FOXC1 or HOTTIP may therefore prove beneficial for OS treatment.

Keywords: FOXC1; HOTTIP; LATS2; Sp1; osteosarcoma.


Conflict of interest statement

The authors declare no conflict of interest.

Figures

Fig. 1
Fig. 1
Both FOXC1 and HOTTIP were up‐regulated in OS tissues or cell lines. The relative expression of FOXC1 (A) and HOTTIP (B) was measured in 30 pairs of OS vs. adjacent normal tissues by qRT‐PCR. The relative expression of FOXC1 (C) and HOTTIP (D) in indicated OS cells vs. normal osteoblasts (hFOB1.19) was measured by qRT‐PCR. (E) The protein level of FOXC1 from indicated cells was determined by western blot. Error bars represent standard deviation. Student's t‐test with 30 biological independent replicates was used to determine statistical significance (A, B); one‐way analysis of variance followed by Tukey's post hoc test with three biological independent replicates (C, E). *P < 0.05, **P < 0.01, ***P < 0.001, when compared to normal tissues or hFOB1.19 cells.
Fig. 2
Fig. 2
FOXC1 played an essential role sustaining multiple malignant phenotypes of OS cells, both in vitro and in vivo. (A) Upon transfecting SW1353 (left panel) and 143B (right panel) cells with shFOXC1‐1, shFOXC1‐2, or control shRNA (shNC), the expression of FOXC1 protein was determined by western blot. The viability, long‐term proliferation, migration, and invasion of indicated cells at indicated time points were determined by MTT assay (B), colony‐forming assay (C), wound‐healing assay (D), and Transwell invasion assay (E), respectively, and compared between shNC and shFOXC1 cells. (F–H) shNC, shFOXC1‐1, or shFOXC1‐2 SW1353 and 143B cells were injected subcutaneously to establish xenograft tumors. The pictures of isolated xenografts after 28 days were shown in F, the growth curve in G, and the weights in H. (I–K) shNC, shFOXC1‐1, or shFOXC1‐2 SW1353 and 143B cells were injected intravenously to establish lung metastasis. The pictures of isolated lung tissues after 36 days were shown in I and microscopic metastasis detected upon HE staining shown in J and K. Error bars represent standard deviation. Student's t‐test with four biological independent replicates was used to determine statistical significance; *P < 0.05, **P < 0.01, ***P < 0.001, when compared to shNC cells. Scale bars: 1000 μm (D), 250 μm (E), and 100 μm (J).
Fig. 3
Fig. 3
HOTTIP essentially contributed to multiple in vitro and in vivo malignant phenotypes of OS cells. (A) The endogenous expression of HOTTIP in indicated cells was detected by qRT‐PCR. (B) SW1353 (left panel) and 143B (right panel) cells were transfected with shHOTTIP‐1, shHOTTIP‐2, or shNC, and the expression of HOTTIP was determined by qRT‐PCR. (C–L) The in vitro (C–F) and in vivo (G–L) phenotypes of indicated cells were examined as detailed in Fig. 2. Error bars represent standard deviation. Student's t‐test with four biological independent replicates was used to determine statistical significance; *P < 0.05, **P < 0.01, ***P < 0.001, when compared to shNC cells. Scale bars: 1000 μm (E), 250 μm (F), and 100 μm (K).
Fig. 4
Fig. 4
Sp1 is required for maintain malignant OS phenotypes, both in vitro and in vivo. (A) The endogenous expression of Sp1 in indicated cells was detected by qRT‐PCR. (B) SW1353 (left panel) and 143B (right panel) cells were transfected with shSp1‐1, shSp1‐2, or shNC, and the expression of HOTTIP was determined by western blot. (C–L) The in vitro (C–F) and in vivo (G–L) phenotypes of indicated cells were examined as detailed in Fig. 2. Error bars represent standard deviation. Student's t‐test with four biological independent replicates was used to determine statistical significance; *P < 0.05, **P < 0.01, when compared to shNC cells. Scale bars: 1000 μm (E), 250 μm (F), and 100 μm (K).
Fig. 5
Fig. 5
FOXC1 and HOTTIP critically controlled the expressions of multiple biomarker genes involved in OS malignancy. In shNC vs. shFOXC1‐1 and shFOXC1‐2 OS cells (A) and in shNC vs. shHOTTIP‐1 and shHOTTIP‐2 OS cells (B), the expressions of indicated target proteins were examined by western blot. GAPDH was examined as the internal control. Error bars represent standard deviation. Student's t‐test with three biological independent replicates was used to determine statistical significance; *P < 0.05, **P < 0.01, when compared to shNC cells.
Fig. 6
Fig. 6
HOTTIP recruited EZH1 and LSD1 to LATS2 promoter, enhanced promoter methylation, and suppressed the expression of LATS2. (A) The percentage distribution of HOTTIP in the nucleus and cytoplasm was examined by qRT‐PCR. GAPDH and U1 were detected as the marker for cytoplasm and nucleus, respectively. (B) EZH2 and LSD1 were identified as the potential interacting partner of HOTTIP using rpiseq software. (C) The interaction between HOTTIP and EZH2 or LSD1 was examined by RIP assay and presented as fold enrichment values relative to the amount of HOTTIP bound to IgG. (D, E) The expression of LATS2 in shHOTTIP‐1 and shHOTTIP‐2 vs. shNC cells was determined on the mRNA level by qRT‐PCR (D) and western blot (E), respectively. The levels of β‐catenin, YAP1, and p‐YAP1 were also detected by western blot (E). (F–H) SW1353 or 143B cells were transfected with siRNA targeting EZH2 (si‐EZH2‐1 and si‐EZH2‐2), LSD1 (si‐LSD1‐ and si‐LSD1‐2), or control (si‐NC). The expression levels of EZH2 (F), LSD1 (G), and LATS2 (H) were detected by qRT‐PCR. (I) The occupancy of EZH2, H3K27me3, LSD1, and H3K4me2 on LATS2 promoter in indicated cells was determined by ChIP analysis and presented as a fold value relative to the amount of IgG bound to the promoter. Error bars represent standard deviation. Student's t‐test with three biological independent replicates was used to determine statistical significance; *P < 0.05, **P < 0.01.
Fig. 7
Fig. 7
HOTTIP is a direct target activated by FOXC1. (A) The expression levels of FOXC1 and HOTTIP were determined by qRT‐PCR and compared between shNC vs. shFOXC1‐1 and shFOXC1‐2 cells. (B) JASPAR analysis identified three potential binding sites (BS1 to BS3) to FOXC1 within the promoter region of HOTTIP. (C) The occupancy of FOXC1 on the three BSs within HOTTIP promoter from indicated cells was determined by ChIP analysis and presented as a fold value relative to the amount of IgG bound to the promoter. (D) The potential FOXC1‐binding sites (BS1 to BS3) were mutated and cloned upstream of luciferase reporter gene. The reporter gene expression in response to FOXC1 was determined by luciferase assay. Error bars represent standard deviation. Student's t‐test with three biological independent replicates was used to determine statistical significance; *P < 0.05, **P < 0.01, ***P < 0.001.
Fig. 8
Fig. 8
Sp1 directly activated the transcription of both FOXC1 and HOTTIP. (A, B) JASPAR analysis identified two potential binding sites (BS1 and BS2) to Sp1 within the promoter region of FOXC1 (A) and also the promoter of HOTTIP (B). (C) The expression of FOXC1 in shNC vs. shSp1 cells was determined by western blot. (D) The occupancy of Sp1 on the two BSs within FOXC1 promoter from indicated cells was determined by ChIP analysis and presented as a fold value relative to the amount of IgG bound to the promoter. (E) The specific binding between Sp1 and FOXC1 promoter was determined by EMSA. (F) The expression levels of Sp1 and HOTTIP were determined by qRT‐PCR and compared between shNC vs. shSp1 cells. (G) The occupancy of Sp1 on the two BSs within HOTTIP promoter from indicated cells was determined by ChIP analysis and presented as a fold value relative to the amount of IgG bound to the promoter. (H) The two potential Sp1 binding sequences were mutated and cloned upstream of the reporter gene. The effect of overexpressing Sp1 on reporter activity was examined by luciferase reporter assay. Error bars represent standard deviation. Student's t‐test with three biological independent replicates was used to determine statistical significance; *P < 0.05, **P < 0.01, ***P < 0.001.
Fig. 9
Fig. 9
A schematic figure illustrates the working model that Sp1/FOXC1/HOTTIP/LATS2/YAP/β‐catenin cascade facilitates oncogenic activities in OS cells.

References

    1. Lindsey BA, Markel JE & Kleinerman ES (2017) Osteosarcoma overview. Rheumatol Ther 4, 25–43. - PMC - PubMed
    1. Anninga JK, Gelderblom H, Fiocco M, Kroep JR, Taminiau AH, Hogendoorn PC & Egeler RM (2011) Chemotherapeutic adjuvant treatment for osteosarcoma: where do we stand? Eur J Cancer 47, 2431–2445. - PubMed
    1. Wan J, Zhang X, Liu T & Zhang X (2016) Strategies and developments of immunotherapies in osteosarcoma. Oncol Lett 11, 511–520. - PMC - PubMed
    1. Gorlick R (2009) Current concepts on the molecular biology of osteosarcoma. Cancer Treat Res 152, 467–478. - PubMed
    1. James AW (2013) Review of signaling pathways governing MSC osteogenic and adipogenic differentiation. Scientifica (Cairo) 2013, 684736. - PMC - PubMed

Publication types

MeSH terms